Method Optimisation in Hydrophilic-Interaction Liquid Chromatography by Design of Experiments Combined with Quantitative Structure–Retention Relationships*
Maryam Taraji A B C and Paul R. Haddad C D
C D
A The Australian Wine Research Institute, PO Box 197, Adelaide, SA 5064, Australia.
B Metabolomics Australia, PO Box 197, Adelaide, SA 5064, Australia.
C Australian Centre for Research on Separation Science, School of Natural Sciences, University of Tasmania, Private Bag 75, Hobart, Tas. 7001, Australia.
D Corresponding author. Email: paul.haddad@utas.edu.au
Australian Journal of Chemistry 74(11) 778-786 https://doi.org/10.1071/CH21102
Submitted: 30 April 2021 Accepted: 1 June 2021 Published: 5 July 2021
Abstract
Accurate prediction of the separation conditions for a set of target analytes with no retention data available is fundamental for routine analytical assays but remains a very challenging task. In this paper, a quality by design (QbD) optimisation workflow capable of discovering the optimal chromatographic conditions for separation of new compounds in hydrophilic-interaction liquid chromatography (HILIC) is introduced. This workflow features the application of quantitative structure−retention relationship (QSRR) methodology in conjunction with design of experiments (DoE) principles and was used to carry out a two-level full factorial DoE optimisation for a mixture of pharmaceutical analytes on zwitterionic, amide, amine, and bare silica HILIC stationary phases, with mobile phases containing varying acetonitrile content, mobile phase pH, and salt concentration. A dual-filtering approach that considers both retention time (tR) and structural similarity was used to identify the optimal set of analytes to train the QSRR in order to maximise prediction accuracy. Highly predictive retention models (average R2 of 0.98) were obtained and statistical analysis of the prediction performance of the QSRR models demonstrated their ability to predict the retention times of new compounds based solely on their molecular structures, with root-mean-square errors of prediction in the range 7.6–11.0 %. Further, the obtained retention data for pharmaceutical test compounds were used to compute their separation selectivity, which was used as input into a DoE optimiser in order to select the optimal separation conditions. Experimental separations performed under the chosen optimal working conditions showed good agreement with the theoretical predictions. To the best of our knowledge, this is the first study of a QbD optimisation workflow assisted with dual-filtering-based retention modelling to facilitate the method development process in HILIC.
Keywords: quality-by-design, separation optimisation, design of experiments, quantitative structure-retention relationships, prediction accuracy, dual-filtering, retention prediction, similarity searching, hydrophilic interaction liquid chromatography, nucleosides.
Introduction
Much effort has been directed towards the optimisation of high-performance liquid chromatography (HPLC) methods in pharmaceutical analysis.[1,2] Despite extensive endeavours, HPLC method development remains largely a trial-and-error process requiring a substantial investment of human and financial resources. HPLC method development has become even more challenging in recent years owing to the proliferation of new stationary phases with varying chemistry demonstrating complex retention mechanisms.[3–6] The investigation of factors governing chromatographic separation mechanisms remains an area of active research, but often the prediction of retention using a retention equation derived only from full understanding of the separation mechanism is not a viable prospect.[7] For this reason, a key objective in the development of a fast and reliable analytical chromatographic methodology as a routine tool in pharmaceutical analysis is to use a priori computational tools whereby the chemical structure of an analyte can be used to make a retention prediction of sufficient accuracy to identify broad chromatographic conditions that meet the optimal level of performance requirements for the separation of compounds in interest. Thus, the goal of the retention prediction process is to enable the operator to choose which stationary phase is to be used and the approximate composition of the mobile phase. This goal can be defined as ‘scoping’ the chromatographic method and it is always expected that scoping will be followed by a detailed experimental optimisation step. However, if scoping can be undertaken without experimentation, the process of method development is accelerated greatly. Typically, a retention time prediction accuracy of ~10 % is sufficient for scoping and is the target range for retention predictions.
In terms of computational methods in analytical method development, the application of quality by design (QbD) concepts is promising.[7–11] Most recent method optimisations have indicated that modern QbD strategies are indeed capable of making a prediction about the method operable design region with a high degree of fidelity.[7] Such investigations have mainly been made possible by the incorporation of a design of experiments (DoE)[12,13] philosophy into the QbD methodology, which allows rapid determination of multiple optimal assay parameters while leading to a minimised assay development and optimisation timeline. However, the application of this idea is hampered by a lack of prediction accuracy for an external test set. Fortunately, the strategy of pairing a theoretical predictive tool with a DoE philosophy provides an attractive statistical approach well suited to address this challenge.
Quantitative structure–retention relationships (QSRRs), which model chromatographic retention as a sum of theoretically generated molecular descriptors based on chemical structure, are of considerable interest in HPLC method development.[14,15] However, owing to the frequently poor predictive ability of QSRRs, use is often made of the insertion of strategies to improve accuracy, such as molecular descriptor optimisers, feature selection tools, and training subset selectors.[16–19] Previous studies from our group have shown the very significant advantages gained by careful selection of the set of compounds used to train the QSRR.[7,8,20–23] In particular, we have shown that filtering a database of compounds with known molecular descriptors and known retention times to identify a subset of the most relevant training compounds can greatly improve prediction accuracy. For example, such filtering can be performed using a mathematical measure of structural similarity (such as the Tanimoto Similarity Index[24]) to find only those compounds in the database that are structurally similar to the test analyte for which retention is to be predicted.[21,25,26] We have also constructed highly accurate local retention models based on chromatographic similarity searching found by comparing retention factors of database compounds with that of the test analyte.[27] Very recently, we have combined structural similarity and chromatographic similarity in an efficient dual filtering approach consisting of three main steps.[28] First, structural similarity was used as a primary filter to identify a subset of database compounds having structural similarity values above a chosen threshold. Second, a reference compound was chosen from the similarity subset by finding the molecular descriptor having the best correlation with retention time and then identifying which database compound had the closest value of that descriptor when compared with the test analyte. Finally, this reference compound was used to find which compounds in the similarity subset showed similar retention times to the reference compounds. This filtering architecture allows both structural similarity and chromatography similarity considerations to be used to find the optimal set of database compounds to train the QSRR model.
Herein, we describe a QbD optimisation protocol trained to learn in parallel the relationships between the experimental parameters and the structures of known analytes, and to apply these relationships to predict the separation conditions of new analytes that have not been utilised in the modelling process. The performance of this approach is demonstrated by predicting possible separation conditions for a mixture of pharmaceuticals analysed in the hydrophilic interaction liquid chromatography (HILIC) mode. HILIC[8,29–31] has attracted considerable attention in the last two decades, primarily because of its advantages for polar compounds and enhancements in mass spectrometry detection sensitivity[29] as a result of the use of high concentrations of organic solvents in HILIC mobile phases. However, the retention mechanism of HILIC is still not fully understood, making HILIC an ideal candidate for the computational retention predictions used in the present study. In a prior report, we proposed a QbD workflow aided by a compound classification-based QSRR model to determine optimal separation predictions of different pharmaceutical target sets in a HILIC system.[32] The most important assessment of the QbD method lies in determining its accuracy for never-analysed compounds for which the experimental results cannot be forecast based solely on the DoE equation. The QbD method was therefore examined to measure its predictive power for new compounds in a holdout set that was kept hidden from model training. Given our earlier success in applying an integrated QSRR-DoE procedure to predict the optimal conditions for unseen compounds,[7,8,32] we wished to extend the performance of the QbD workflow by implementation of a more advanced training subset selection in the hope of deriving more reliable QSRR models. This study therefore illustrates the first example of a QbD optimisation protocol that uses a combination of dual-filtering-based QSRR calculations and DoE principles for prediction of the retention of never-analysed pharmaceutical compounds over a wide range of HILIC stationary phases and mobile phase conditions.
Results and Discussion
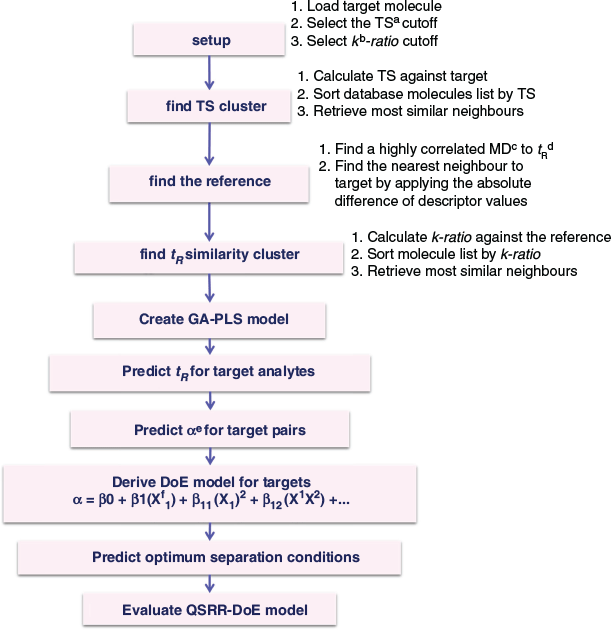
The overall workflow used in this study followed the general sequence shown in Fig. 1. Full details of the procedures used are provided in the Experimental section.
|
DoE Modelling
Owing to limited understanding of the separation mechanism in the HILIC mode and the large number of parameters engaged in the performance of HILIC methods, optimisation is still typically being implemented via a trial-and-error approach[33] in which one variable is assessed at a time, requiring huge effort, resources, and time. In addition, this univariate method development strategy consumes large amounts of organic solvent, leading to potential environmental damage. In contrast, a DoE approach allows multivariate analysis, accounts for linear and quadratic relationships, identifies interactions between variables, utilises the minimal number of experiments, and provides a greater understanding of the method performance.[12,13,34]
As a starting point, three influential HILIC mobile phase parameters[8,31,35] were varied: pH, acetonitrile content, and salt concentration at two levels (see Table 1). With three replicates being performed at the middle point, this represented a total of 11 separate experiments (Table S1, Supplementary Material), which is far less than the number used typically in the trial-and-error approach. The results from the full factorial DoE were analysed in model generation and validation as well as estimation of linear, quadratic, and interaction effects of all the investigated parameters. The retention data were fitted using multiple linear regression analysis[36] as the most common regression method utilised in DoE assay. However, this initial fit yielded residuals (i.e. differences between observed and predicted retention times) that were highly scattered, indicating that non-significant factors were included in the model. The f-tests of statistical importance for the model and P-test for each single coefficient were applied to identify the significant factors and to estimate their coefficients. The insignificant parameters that were not involved in significant interactions were excluded in the final model. The remaining factors in the final model show significant impact (P < 0.005) on the retention time (tR) response. Eqn 1 below shows the final model.

|

where X1 and X2 are organic solvent content and salt concentration, respectively. The values of the model regression coefficients (β) and their statistical analysis for each of the four HILIC columns tested are summarised in Tables S2–S5 in the Supplementary Material.
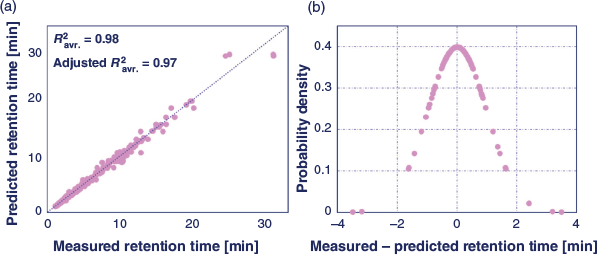
Fig. 2a shows the correlation between predicted and experimental retention times, average adjusted R2 and average R2 values of 0.97 and 0.98, respectively, over all four HILIC stationary phases. Fig. 2b shows the distribution of the residual error. For analysing the retention behaviour of investigated nucleosides, Fig. S1 in the Supplementary Material shows the ranking chart of the final model terms, with the most substantial effect assigned to rank 1. Not surprisingly, the factors acetonitrile content and its quadratic term have major positive coefficient evaluations over all studied HILIC conditions, meaning that an increase of the content of organic solvent in the assay yields a higher retention time. This observation is consistent with the current knowledge of the HILIC retention mechanism and theory, namely that higher organic solvent content promotes hydrophilic partitioning into a static water layer on the surface of the stationary phase, leading to higher retention.[8] A moderate positive effect of salt concentration was also observed on the retention behaviour of nucleosides over all four HILIC system, due possibly to the promotion of stronger hydrophilic partitioning at higher salt concentration resulting from salting-out effects.[8] The absence of the pH term in the DoE models was evidence of insignificant ion-exchange contributions to the retention behaviour of the nucleosides on the studied HILIC stationary phases.
|
While the DoE model describes the retention behaviour of a given set of analytes over the design space, it is not capable of predicting retention and consequently defining the optimal separation condition of unknown test probes. To address this issue, we introduced a QSRR modelling approach in conjunction with DoE principles into a QbD workflow.
Training of Dual-Filtering-Based QSRR Models
Previous studies have suggested that accurate predictive QSRRs can be generated in the case where tR similarity filtering was applied to search for a training subset of compounds that are chromatographically similar to the target analyte.[7,8,27] Tanimoto similarity searching provides a perfect starting point for the application of tR similarity filtering in the determination of chromatographic similarity.[28,37] In the present study, prediction performance of the model was examined on a test set of 16 nucleosides under 11 mobile phase compositions corresponding to a full factorial design matrix and over four different HILIC stationary phases. Each nucleoside was successively removed from the dataset and retained as the test target and was not used during the training course. Tanimoto similarity searching was performed to find a cluster of structurally similar database compounds with a Tanimoto similarity score above 0.5. To implement tR similarity filtering, the correlation between tR and molecular descriptors for the structurally similar analytes was applied to identify the most highly correlated molecular descriptor. For each nucleoside used as the test analyte, strong correlation (R2 > 0.8) between tR and the HOMT molecular descriptor (Harmonic Oscillator Model of Aromaticity index Total) was observed for compounds within the similarity cluster over all mobile phase compositions and stationary phases used in this study. This descriptor was used to rank the structurally similar analytes to determine the analyte having the smallest absolute difference of HOMT value compared with the test analyte. This analyte was then used as a reference compound to identify only those compounds from the structurally similar analytes having a k-ratio value (the ratio of the retention factor values between each compound within the first cluster and the reference analyte) within the range of 1.0–1.5. The final subset of compounds selected in this way was then used to construct a local model for each target analyte for each of the experimental chromatographic conditions under study, utilising both the experimental retention data and the relevant DFT (density functional theory)-computed molecular descriptors of compounds as input into the training course. Models were then used to predict retention factors of all test compounds for all chromatographic systems. A summary of the overall performance of QSRR models for each chromatographic condition in the experimental design is presented in Table S6 (Supplementary Material), with internal validation by root mean square error cross-validation (RMSECV) and cross-validated coefficient of determination Q2CV giving a range of 0.00–0.31 and 0.97–0.99, respectively, over all analysed mobile phase compositions and HILIC stationary phases, indicating good agreement between the predicted and experimental retention values. The predicted retention factors of the test compounds are given in Tables S7–S10 (Supplementary Material) for each of the experimental chromatographic conditions.
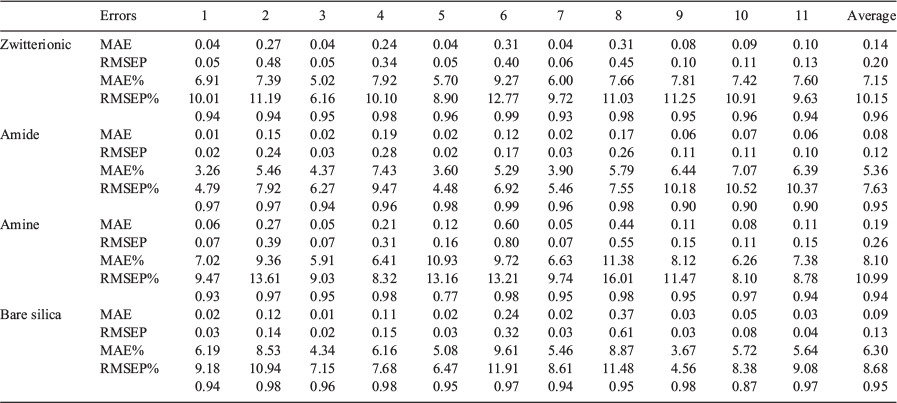
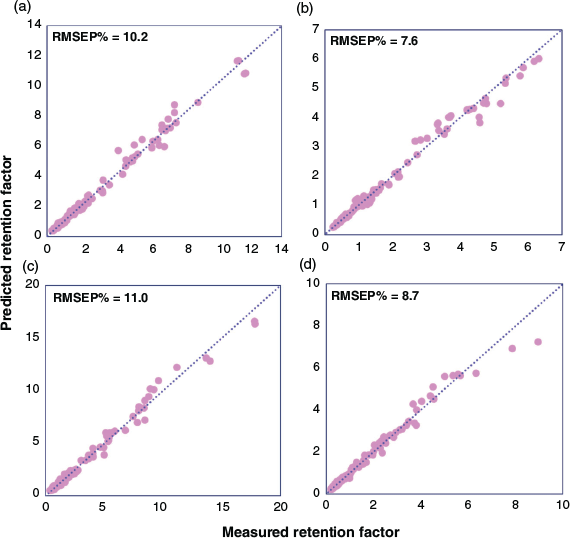
External validation was carried out to assess the predictive ability of the localised QSRR models for target analytes that had not been used in either the feature selection process or training of the QSRR model. Relevant descriptor data for these test compounds were used as input for the genetic algorithm-partial least squares (GA-PLS) regression models and the corresponding retention factors were computed and compared with experimentally measured retention factors. Table 2 summarises figures of merit. Prediction accuracies of retention data are averaged over all chromatographic conditions and presented as root mean squared error prediction percentage (RMSEP%) values of 10.2, 7.6, 11.0, and 8.7 % for zwitterionic, amide, amine, and bare silica columns, respectively (Fig. 3). The normal distribution of residual error (Fig. S2 in the Supplementary Material), the small scattering of data, and the absence of notable outliers prove the potential of the localised QSRR models for the prediction of retention data over a wide range of chromatographic conditions.
|
|
Prediction of Separation Conditions
After generating the dual-filtering-based QSRR models, the question of optimisation of separation conditions for test nucleosides over four different HILIC stationary phases was addressed. Although there are useful and efficient protocols for selecting an optimal chromatographic condition for the separation of specific analytes,[7,38,39] we are not aware of other studies describing the prediction of the separation conditions for unknown analytes with acceptable accuracy. In our previous work, we used a compound-classification-based QSRR modelling process that was introduced into a QbD workflow for the separation of three small test sets of analytes on a HILIC amide stationary phase.[32] In the present study, the aim was to upgrade the performance of this existing workflow by taking advantage of a dual-filtering strategy for training selection. The performance of the predictive models for the separation of a mixture of pharmaceutical analytes over zwitterionic, amide, amine, and bare silica HILIC columns was examined.
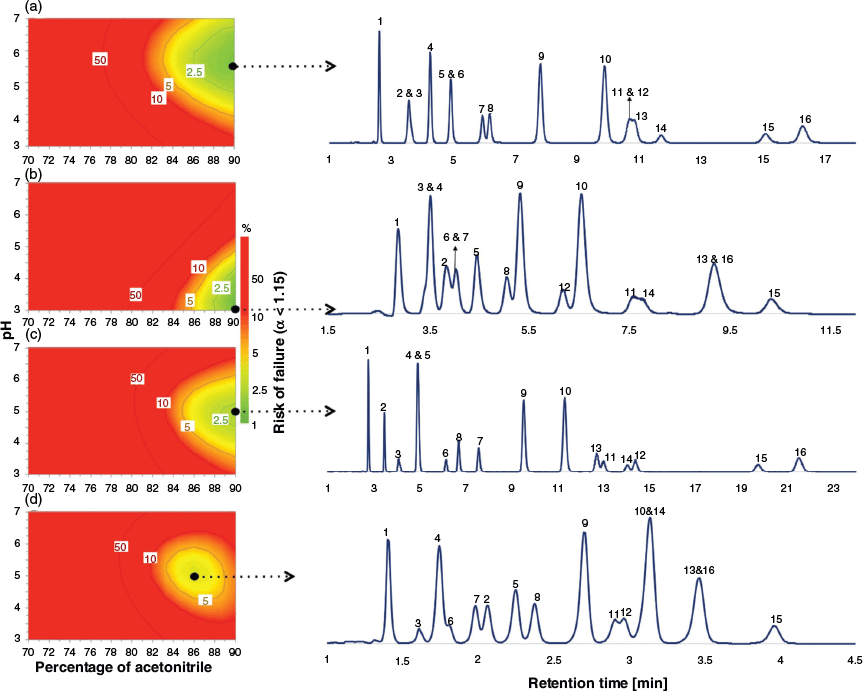
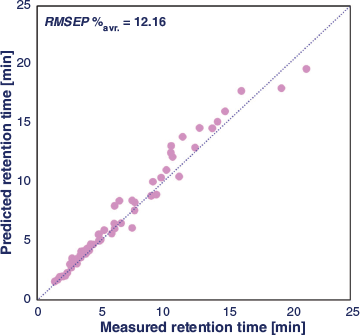
The retention factors predicted in the section Training of Dual-Filtering-Based QSRR Models above were used to calculate the selectivity values (α) for all target pairs as the measured response for DoE optimisation. The experimental domain was explored by applying the optimiser tool of MODDE 10 software[40] to reveal the experimental condition where the best separation of the target analytes was achieved. The percentage risk of failure of the separation, with failure being represented as α < 1.15, was selected as the performance criterion. Monte Carlo simulations[41] were carried out to generate the model uncertainty and to estimate the probability of the defined response criterion, allowing the identification of the region of the design space where optimal separation conditions are located. In this case, a percentage risk of failure below 2 % was computed. The choice of the working condition can be made at any point inside the defined design space, but normally this is selected to be where the risk of failure is lowest. To simplify the display, it is common practice to fix the value of one experimental parameter and to show a two-dimensional representation of the design space over which two experimental factors are varied. Fig. 4 displays the risk of failure plots as the two-dimensional combination of %acetonitrile and pH using a fixed salt concentration of 16.7 mmol L−1, for each column, together with the experimental chromatogram obtained under the selected chromatographic conditions. A comparison between the experimental and predicted retention times showed good agreement (see Fig. 5, Table 3 and Table S11 in Supplementary Material). In general, the averaged RMSEP% value of 12.16 for zwitterionic, amide, amine, and bare silica systems shows a high level of agreement between observed and predicted retention data of all test compounds under the selected working conditions.
|

|
Using this QbD optimisation protocol, coupled to the QSRR retention modelling tool, prediction of the optimal separation conditions can be performed for unknown analytes based only on their chemical structures.
Conclusions
We have demonstrated a new QbD optimisation workflow that can be effectively employed to extract chromatographically meaningful knowledge from a retention database. The new workflow features the combination of the DoE principle and QSRR strategy aided by a dual-filtering technique for selection of the training subset of analytes. This QbD optimisation protocol was able to discover optimal chromatographic separation conditions for a mixture of nucleosides over four HILIC stationary phases, based on chemical structures of the analytes. We propose that this combination of features will prove to be a useful strategy in the optimisation process of other chromatographic separation techniques.
Application of this computational method to predict optimal gradient separation conditions for routine assays is the goal of our ongoing program.
Experimental
Database of Compounds with Known Structures and Retention Times
In this work, an in-house database comprising 61 HILIC conditions for 114 pharmaceutical compounds was used.[42] This database contains analytes having a wide diversity of chemical structures and is representative of typical polar compounds used as analytes in HILIC. For the current study, we selected the retention data of 16 nucleosides generated on four Thermo Fisher Scientific HILIC stationary phases of differing functionalities, namely bare silica (Accucore, 4.6 mm ID × 150 mm, 2.6 μm), amino (Syncronis amino, 4.6 mm ID × 150 mm, 3.0 μm), amide (Acclaim HILIC-10, 3.0 mm ID × 150 mm, 3.0 μm), and a zwitterionic stationary phase (Syncronis, 4.6 mm ID × 150 mm, 3.0 μm). Mobile phase compositions of formate buffer and acetonitrile corresponding to the 11 conditions of a full factorial design experimental matrix were used. The flow rate was 1.0, 1.0, 0.4, and 1.5 mL min−1 for the amine, zwitterionic, amide, and bare silica stationary phases, respectively. Details of methods and materials used for generation of the retention database can be found elsewhere.[42]
Computation of Molecular Geometries and Descriptors
The computations presented in this study were carried out utilising DFT molecular geometries.[43,44] The lowest-energy conformers generated initially by MMff9446[45–48] in Balloon,[49] were fed as input into the semiempirical Parametric Method number 7 (PM7)[50] geometry optimiser performed in Molecular Orbital PACkage (MOPAC).[51] The output from the PM7 optimiser was then fed as input into a Gaussian program[52] for further structural relaxations by the implementation of the Becke exchange with the Lee–Yang–Parr correlation functional (BLYP)[53–56] and the 6–31G (d) basis set.[57] A solvent correction for acetonitrile was performed utilising the integral equation formalism variant of the polarisable continuum model (IEFPCM).[58] The above processes have been proven effective in earlier research from our group for retention modelling on different chromatography systems.[7,8,16,27,28,32]
The minimum-energy conformations calculated above were used as input for Dragon software[59] to calculate molecular descriptors. The software was capable of calculating nearly 3000 molecular descriptors, consisting of topological, constitutional, geometrical, electrostatic, and quantum chemical variables. Comprehensive detail on the nature and computations of Dragon molecular descriptors is given in the Handbook of Molecular Descriptors.[60] The initial molecular descriptors were reduced to 321 descriptors by discarding descriptors with almost-constant values and/or a standard deviation below 0.0001, and also those descriptors that were highly correlated with other descriptors (correlation coefficient > 0.90). This dimensionality reduction minimises the information loss associated with chance correlation. Prior to use in model generation, all descriptors were normalised by conversion to zero mean and unit variance to ensure that no individual descriptor dominated the optimisation. Full details of the software library used are available elsewhere.[16,28,32]
Generation of QSRR Models
Traditional QSRR relies on a randomly generated training set, which often leads to poor prediction accuracy.[14,61] To tackle this issue, we applied a dual filtering based on consideration of both structural and chromatographic similarity. The first cluster of database compounds was obtained by calculating pairwise Tanimoto similarity index values[24] and selecting only those database compounds with a threshold value above 0.5 when compared with the test analyte. Within this cluster, a reference compound was identified by first calculating the molecular descriptor that was most correlated with retention time and then locating which compound in the similarity cluster had the closest value of that molecular descriptor to the test analyte. Chromatographic similarity clustering[27] was then performed by selecting only those compounds from the structural similarity clustering subset that showed a ratio of retention factor (k) values compared with the reference factor in the range 1.0–1.5. The final training subset was therefore the set of compounds showing the highest chromatographic and structural similarity to the test analyte.
In our present implementation, each local model relating retention data as a function of chosen molecular variables was generated utilising partial least-squares (PLS)[62] for regression analysis following application of a genetic algorithm[63] (GA)-PLS method to identify the most relevant descriptors. Our in-house GA-PLS script was based on a Matlab formula created by Leardi,[64] with the following settings: 50 chromosomes in the initial population, a maximum of 20 variables per chromosome with a median selection probability of 10 variables, a mutation probability of 1 % along with a crossover probability of 50 %. A backward selection algorithm following each 100 evaluations was designed to manage the unavoidable random selection nature of GA. Replicates of GA-PLS modelling were performed to further improve the identification of the optimal set of descriptors for the final model. We found that using five replicates of GA-PLS descriptor selection yielded high-quality results at reasonable computational cost.[27,28,37]
The performance of local QSRR models was achieved using an external test set of compounds that were excluded from all aspects of the training of the model. Each analyte from the database was used successively as a test compound by eliminating it from the database and then predicting its retention time using models constructed from the dual-filtered training subset. The predictive ability of each local model was externally evaluated utilising mean absolute error (MAE) and RMSEP along with MAE and RMSEP normalised[65] to the retention data of targets. The external-validated coefficient of determination Q2ext(F2)[66] between the experimental and the predicted retention factors of targets was calculated. The models were also examined by RMSECV and Q2CV, which represent the internal prediction performance of the models.
QSRR-DoE Protocol for Optimising Chromatographic Separation Conditions
QbD is a systematic and risk-based approach to method development and optimisation that provides the opportunity to understand and control the method to the best possible level and ensures both the method performance and inter-instrument transfer with the highest likelihood of success.[10,11] An essential aspect of the QbD approach is the use of DoE philosophy to gain the most useful information on experimental factors while keeping the number of experiments low.[12] In the present study, 16 nucleosides from an in-house HILIC database[42] were used as the target set to develop and validate the QbD optimisation protocol. Fig. 1 shows the basic workflow of the QbD model used in this study. First, the performance objective known as the critical quality attribute (CQA)[10] was defined to be the maximum separation of compounds in the target set based on the selectivity factor (α) with the critical value being set at α ≥ 1.15. Values of α were computed using the predicted retention factors of all pairs of analytes eluted as adjacent peaks. A two-level full factorial DoE (detailed in the DoE Modelling section) was selected covering the influential mobile phase parameters, including acetonitrile content, pH, and buffer concentration, followed by the generation of retention data on all mobile phase compositions and all four HILIC columns (zwitterionic, amide, amine, and bare silica). Further, dual-filtering-based QSRR models[28] were constructed to predict retention data and consequently the separation selectivity data of target compounds that were then used as input into MODDE software[40] to define the most robust areas of the design space. Finally, experiments were carried out to assess the reliability of the QbD predictions.
Supplementary Material
The design matrix with 11 independent trials; values of DoE model regression coefficients with their statistical evaluations; DoE model term ranking chart; the internal validation summary of GA-PLS models; the predicted retention data of test analytes over 11 chromatographic conditions corresponding to the DoE matrix along with their residual plot; and the experimental and predicted retention times of test analytes under the optimal separation conditions are available on the Journal’s website.
Conflicts of Interest
The authors declare no conflicts of interest.
Declaration of Funding
Metabolomics South Australia is funded through Bioplatforms Australia Pty Ltd (BPA), and investment from the South Australian State Government and The Australian Wine Research Institute. Partial funding for this research was provided by the Australian Research Council under Linkage Grant LP120200700.
Acknowledgements
M.T. acknowledges the use of NCRIS (National Collaborative Research Infrastructure Strategy)-enabled ‘Metabolomics Australia’ infrastructure.
References
[1] V. D’Atri, S. Fekete, A. Clarke, J. L. Veuthey, D. Guillarme, Anal. Chem. 2019, 91, 210.| Crossref | GoogleScholarGoogle Scholar | 30406984PubMed |
[2] Q. Zhang, F. Q. Yang, L. Ge, Y. J. Hu, Z. N. Xia, J. Sep. Sci. 2017, 40, 49.
| Crossref | GoogleScholarGoogle Scholar | 27717145PubMed |
[3] K. Broeckhoven, G. Desmet, Anal. Chem. 2021, 93, 257.
| Crossref | GoogleScholarGoogle Scholar | 33300336PubMed |
[4] C. Galea, D. Mangelings, Y. Vander Heyden, Anal. Chim. Acta 2015, 886, 1.
| Crossref | GoogleScholarGoogle Scholar | 26320631PubMed |
[5] P. Jandera, Anal. Chim. Acta 2011, 692, 1.
| Crossref | GoogleScholarGoogle Scholar | 21501708PubMed |
[6] Y. Guo, S. Gaiki, J. Chromatogr. A 2011, 1218, 5920.
| Crossref | GoogleScholarGoogle Scholar | 21737083PubMed |
[7] P. R. Haddad, M. Taraji, R. Szucs, Anal. Chem. 2021, 93, 228.
| Crossref | GoogleScholarGoogle Scholar | 33085452PubMed |
[8] M. Taraji, P. R. Haddad, R. I. J. Amos, M. Talebi, R. Szucs, J. W. Dolan, C. A. Pohl, Anal. Chim. Acta 2018, 1000, 20.
| Crossref | GoogleScholarGoogle Scholar | 29289311PubMed |
[9] R. Cela, E. Y. Ordonez, J. B. Quintana, R. Rodil, J. Chromatogr. A 2013, 1287, 2.
| Crossref | GoogleScholarGoogle Scholar | 22901328PubMed |
[10] S. Orlandini, S. Pinzauti, S. Furlanetto, Anal. Bioanal. Chem. 2013, 405, 443.
| Crossref | GoogleScholarGoogle Scholar | 22941176PubMed |
[11] F. G. Vogt, A. S. Kord, J. Pharm. Sci. 2011, 100, 797.
| Crossref | GoogleScholarGoogle Scholar | 21280050PubMed |
[12] E. Rozet, P. Lebrun, P. Hubert, B. Debrus, B. Boulanger, TrAC Trends Analyt. Chem. 2013, 42, 157.
| Crossref | GoogleScholarGoogle Scholar |
[13] L. V. Candioti, M. M. De Zan, M. S. Camara, H. C. Goicoechea, Talanta 2014, 124, 123.
| Crossref | GoogleScholarGoogle Scholar | 24767454PubMed |
[14] R. Kaliszan, Chem. Rev. 2007, 107, 3212.
| Crossref | GoogleScholarGoogle Scholar | 17595149PubMed |
[15] K. Heberger, J. Chromatogr. A 2007, 1158, 273.
| Crossref | GoogleScholarGoogle Scholar | 17499256PubMed |
[16] M. Taraji, P. R. Haddad, R. I. J. Amos, M. Talebi, R. Szucs, J. W. Dolan, C. A. Pohl, J. Chromatogr. A 2017, 1486, 59.
| Crossref | GoogleScholarGoogle Scholar | 28049585PubMed |
[17] M. Talebi, G. Schuster, R. A. Shellie, R. Szucs, P. R. Haddad, J. Chromatogr. A 2015, 1424, 69.
| Crossref | GoogleScholarGoogle Scholar | 26592563PubMed |
[18] K. Muteki, J. E. Morgado, G. L. Reid, J. Wang, G. Xue, F. W. Riley, J. W. Harwood, D. T. Fortin, J. I. Miller, Ind. Eng. Chem. Res. 2013, 52, 12269.
| Crossref | GoogleScholarGoogle Scholar |
[19] C. Wang, M. J. Skibic, R. E. Higgs, I. A. Watson, H. Bui, J. Wang, J. M. Cintron, J. Chromatogr. A 2009, 1216, 5030.
| Crossref | GoogleScholarGoogle Scholar | 19439313PubMed |
[20] R. I. J. Amos, P. R. Haddad, R. Szucs, J. W. Dolan, C. A. Pohl, TrAC Trends Analyt. Chem. 2018, 105, 352.
| Crossref | GoogleScholarGoogle Scholar |
[21] M. Talebi, S. H. Park, M. Taraji, Y. Wen, R. I. J. Amos, P. R. Haddad, R. A. Shellie, R. Szucs, C. A. Pohl, J. W. Dolan, LC GC 2016, 34, 550.
[22] S. H. Park, M. De Pra, P. R. Haddad, S. Grosse, C. A. Pohl, F. Steiner, J. Chromatogr. A 2020, 1609, 460508.
| Crossref | GoogleScholarGoogle Scholar | 31530383PubMed |
[23] S. H. Park, P. R. Haddad, R. I. J. Amos, M. Talebi, R. Szucs, C. A. Pohl, J. W. Dolan, J. Chromatogr. A 2017, 1520, 107.
| Crossref | GoogleScholarGoogle Scholar | 28916393PubMed |
[24] R. Todeschini, V. Consonni, H. Xiang, J. Holliday, M. Buscema, P. Willett, J. Chem. Inf. Model. 2012, 52, 2884.
| Crossref | GoogleScholarGoogle Scholar | 23078167PubMed |
[25] M. Taraji, P. R. Haddad, R. I. J. Amos, M. Talebi, R. Szucs, J. W. Dolan, C. A. Pohl, Anal. Chem. 2017, 89, 1870.
| Crossref | GoogleScholarGoogle Scholar | 28208251PubMed |
[26] Y. Wen, M. Talebi, R. I. J. Amos, R. Szucs, J. W. Dolan, C. A. Pohl, P. R. Haddad, J. Chromatogr. A 2018, 1541, 1.
| Crossref | GoogleScholarGoogle Scholar | 29454529PubMed |
[27] E. Tyteca, M. Talebi, R. I. J. Amos, S. H. Park, M. Taraji, Y. Wen, R. Szucs, C. A. Pohl, J. W. Dolan, P. R. Haddad, J. Chromatogr. A 2017, 1486, 50.
| Crossref | GoogleScholarGoogle Scholar | 27720174PubMed |
[28] M. Taraji, P. R. Haddad, R. I. J. Amos, M. Talebi, R. Szucs, J. W. Dolan, C. A. Pohl, J. Chromatogr. A 2017, 1507, 53.
| Crossref | GoogleScholarGoogle Scholar | 28587779PubMed |
[29] P. Hemström, K. Irgum, J. Sep. Sci. 2006, 29, 1784.
| Crossref | GoogleScholarGoogle Scholar | 16970185PubMed |
[30] B. Buszewski, S. Noga, Anal. Bioanal. Chem. 2012, 402, 231.
| Crossref | GoogleScholarGoogle Scholar | 21879300PubMed |
[31] Y. Guo, Analyst 2015, 140, 6452.
| Crossref | GoogleScholarGoogle Scholar | 26221630PubMed |
[32] M. Taraji, P. R. Haddad, R. I. J. Amos, M. Talebi, R. Szucs, J. W. Dolan, C. A. Pohl, Anal. Chem. 2017, 89, 1870.
| Crossref | GoogleScholarGoogle Scholar | 28208251PubMed |
[33] B. Dejaegher, D. Mangelings, Y. Vander Heyden, J. Sep. Sci. 2008, 31, 1438.
| Crossref | GoogleScholarGoogle Scholar | 18461571PubMed |
[34] D. B. Hibbert, J. Chromatogr. B 2012, 910, 2.
| Crossref | GoogleScholarGoogle Scholar |
[35] G. Greco, T. Letzel, J. Chromatogr. Sci. 2013, 51, 684.
| Crossref | GoogleScholarGoogle Scholar | 23492984PubMed |
[36] R. E. Bruns, I. S. Scarminio, B. B. Neto, Statistical Design – Chemometrics 2006 (Elsevier: Amsterdam).
[37] Y. Wen, R. I. J. Amos, M. Talebi, R. Szucs, J. W. Dolan, C. A. Pohl, P. R. Haddad, Anal. Chem. 2018, 90, 9434.
| Crossref | GoogleScholarGoogle Scholar | 29952550PubMed |
[38] I. Molnar, J. Chromatogr. A 2002, 965, 175.
| Crossref | GoogleScholarGoogle Scholar | 12236524PubMed |
[39] P. Wiczling, L. Kubik, R. Kaliszan, Anal. Chem. 2015, 87, 7241.
| Crossref | GoogleScholarGoogle Scholar | 26096131PubMed |
[40] MODDE ver. 10 Software for Design of Experiments: User’s Guide and Tutorial 2013 (MKS: Sweden).
[41] M. Á. Herrador, A. G. Asuero, A. G. González, Chemom. Intell. Lab. Syst. 2005, 79, 115.
| Crossref | GoogleScholarGoogle Scholar |
[42] M. Taraji, Quantitative Structure–Retention Relationships for Rapid Method Development in Hydrophilic-Interaction Liquid Chromatography of Pharmaceutical Compounds 2017, Ph.D. thesis, University of Tasmania.
[43] R. Parr, W. Yang, Density-Functional Theory of Atoms and Molecules 1989 (Oxford University Press: New York, NY).
[44] W. Koch, M. C. Holthausen, A Chemist’s Guide to Density Functional Theory, 2nd edn 2001 (Wiley-VCH: Weinheim).
[45] T. A. Halgren, R. B. Nachbar, J. Comput. Chem. 1996, 17, 587.
[46] T. A. Halgren, J. Comput. Chem. 1996, 17, 553.
| Crossref | GoogleScholarGoogle Scholar |
[47] T. A. Halgren, J. Comput. Chem. 1996, 17, 520.
| Crossref | GoogleScholarGoogle Scholar |
[48] T. A. Halgren, J. Comput. Chem. 1996, 17, 490.
| Crossref | GoogleScholarGoogle Scholar |
[49] M. J. Vainio, M. S. Johnson, J. Chem. Inf. Model. 2007, 47, 2462.
| Crossref | GoogleScholarGoogle Scholar | 17892278PubMed |
[50] J. J. Stewart, J. Mol. Model. 2013, 19, 1.
| Crossref | GoogleScholarGoogle Scholar | 23187683PubMed |
[51] J. J. P. Stewart, MOPAC 2012 (Stewart Computational Chemistry: Colorado Springs, CO).
[52] M. J. T. Frisch, G. W. Schlegel, H. B. Scuseria, G. E. Robb, M. A. Cheeseman, J. R. Scalmani, G. Barone, V. Mennucci, B. Petersson, G. A. Nakatsuji, H. Caricato, M. Li, X. Hratchian, H. P. Izmaylov, A. F. Bloino, J. Zheng, G. Sonnenberg, J. L. Hada, M. Ehara, M. Toyota, K. Fukuda, R. Hasegawa, J. Ishida, M. Nakajima, T. Honda, Y. Kitao, O. Nakai, H. Vreven, T. Montgomery, Jr, J. A. Peralta, J. E. Ogliaro, F. Bearpark, M. Heyd, J. J. Brothers, E. Kudin, K. N. Staroverov, V. N. Kobayashi, R. Normand, J. Raghavachari, K. Rendell, A. Burant, J. C. Iyengar, S. S. Tomasi, J. Cossi, M. Rega, N. Millam, J. M. Klene, M. Knox, J. E. Cross, J. B. Bakken, V. Adamo, C. Jaramillo, J. Gomperts, R. Stratmann, R. E. Yazyev, O. Austin, A. J. Cammi, R. Pomelli, C. Ochterski, J. W. Martin, R. L. Morokuma, K. Zakrzewski, V. G. Voth, G. A. Salvador, P. Dannenberg, J. J. Dapprich, S. Daniels, A. D. Farkas, O. Foresman, J. B. Ortiz, J. V. Cioslowski, D. J. Fox, Gaussian 09, Revision A.02 2009 (Gaussian, Inc.: Wallingford, CT).
[53] A. D. Becke, J. Chem. Phys. 1993, 98, 1372.
| Crossref | GoogleScholarGoogle Scholar |
[54] A. D. Becke, Phys. Rev. A 1988, 38, 3098.
| Crossref | GoogleScholarGoogle Scholar |
[55] C. Lee, W. Yang, R. G. Parr, Phys. Rev. B Condens. Matter 1988, 37, 785.
| Crossref | GoogleScholarGoogle Scholar | 9944570PubMed |
[56] P. J. Stephens, F. J. Devlin, C. F. Chabalowski, M. J. Frisch, J. Phys. Chem. 1994, 98, 11623.
| Crossref | GoogleScholarGoogle Scholar |
[57] M. J. Frisch, J. A. Pople, J. S. Binkley, J. Chem. Phys. 1984, 80, 3265.
| Crossref | GoogleScholarGoogle Scholar |
[58] J. Tomasi, B. Mennucci, R. Cammi, Chem. Rev. 2005, 105, 2999.
| Crossref | GoogleScholarGoogle Scholar | 16092826PubMed |
[59] Dragon ver. 6.0 2015 (Talete srl: Milano, Italy).
[60] R. Todeschini, V. Consonni, Handbook of Molecular Descriptors 2000 (Wiley-WCH: Weinheim).
[61] J. Huang, X. Fan, Mol. Pharm. 2011, 8, 600.
| Crossref | GoogleScholarGoogle Scholar | 21370915PubMed |
[62] S. Wold, M. Sjöström, L. Eriksson, Chemom. Intell. Lab. Syst. 2001, 58, 109.
| Crossref | GoogleScholarGoogle Scholar |
[63] J. H. Holland, Adaptation in Natural and Artificial Systems 1975 (University of Michigan Press: Ann Arbor, MI).
[64] R. Leardi, A. Lupiáñez González, Chemom. Intell. Lab. Syst. 1998, 41, 195.
| Crossref | GoogleScholarGoogle Scholar |
[65] M. Taraji, P. R. Haddad, R. I. J. Amos, M. Talebi, R. Szucs, J. W. Dolan, C. A. Pohl, J. Chromatogr. A 2017, 1524, 298.
| Crossref | GoogleScholarGoogle Scholar | 29037590PubMed |
[66] V. Consonni, D. Ballabio, R. Todeschini, J. Chemometr. 2010, 24, 194.
| Crossref | GoogleScholarGoogle Scholar |
* Paul Haddad is the recipient of the 2021 RACI Leighton Memorial Medal.


