
Synoptic-scale atmospheric cyclones in the South-East Tropical Indian Ocean (SETIO) and their relation to IOD variability
Ankit Kavi A and Jochen Kämpf A *
A *
A Flinders University, College of Science & Engineering, Adelaide, SA, Australia.
Journal of Southern Hemisphere Earth Systems Science 72(3) 191-201 https://doi.org/10.1071/ES22020
Submitted: 22 June 2022 Accepted: 2 November 2022 Published: 22 November 2022
© 2022 The Author(s) (or their employer(s)). Published by CSIRO Publishing on behalf of BoM. This is an open access article distributed under the Creative Commons Attribution-NonCommercial-NoDerivatives 4.0 International License (CC BY-NC-ND)
Abstract
This study focuses on the regional wind variability that controls the intensity of cold-water upwelling off Sumatra – a key feature of the Indian Ocean Dipole (IOD). Our analysis of daily atmospheric data reveals the existence of convectively triggered synoptic-scale atmospheric cyclones in the South-East Tropical Indian Ocean (SETIO). The northern branch of the cyclones corresponds to westerly equatorial wind events, whereas the eastern branch involves north-westerly winds that operate to suppress cold-water upwelling off Sumatra’s west coast. Data for the period 1988–2022 show that 5–9 SETIO cyclones normally form each year during the boreal summer–autumn season, effectively suppressing upwelling in the region. In contrast, there are only few (1–2) cyclone events in years identified as positive phases of the IOD, when the absence of cyclones concurs with the development of strong coastal upwelling off Sumatra. Our findings suggest that the absence or presence of SETIO cyclones contributes to IOD variability.
Keywords: atmospheric cyclones, atmosphere–ocean interactions, cyclogenesis, daily variability, equatorial wind events, Indian Ocean Dipole, interannual climate variability, tropical convection.
1. Introduction
The Indian Ocean Dipole (IOD) is a unique coupled ocean–atmosphere mode of climate variability in the tropics of the Indian Ocean that affects the regional and global climatic conditions at interannual time scales (e.g. Saji et al. 1999; Vinayachandran et al. 1999, 2009; Webster et al. 1999; Ashok et al. 2001; Rao et al. 2002; Black et al. 2003; Clark et al. 2003; Saji and Yamagata 2003; Yamagata et al. 2004; Meyers et al. 2007; Chan et al. 2008; Yuan et al. 2008; Cai et al. 2009, 2014; Ummenhofer et al. 2009; Kripalani et al. 2010).
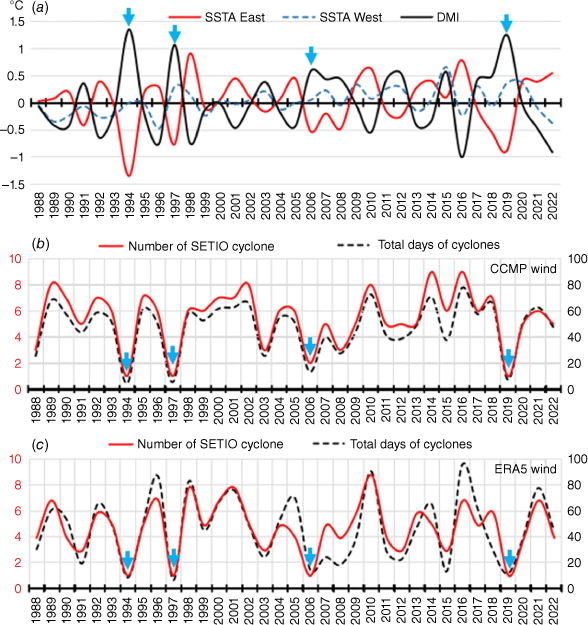
The IOD, first described by Saji et al. (1999), is a pattern of sea surface temperature (SST) fluctuations between the eastern and western intertropical Indian Ocean. The common perception according to previous studies (Saji et al. 1999; Webster et al. 1999; Feng and Meyers 2003; Cai et al. 2014, 2018) is that IOD events develop through the Bjerknes-coupled feedback, wherein an initial cooling off the coast of Sumatra–Java suppresses local atmospheric convection, leading to anomalous easterly equatorial wind, a shoaling thermocline and stronger upwelling which in turn reinforce the initial cooling. Phases of the IOD are described by the Dipole Mode Index (DMI) as the differences of SSTs between defined areas displayed in Fig. 1a.

|
Occasionally, coastal waters off south-western Sumatra experience widespread cooling during late austral winter months (July–September), henceforth classified as ‘IOD season’. Seasonal south-easterly winds regularly create upwelling in the ocean along the coastlines of southern Sumatra and Java during the IOD season, but the intensity and spatial extent of negative SST anomalies off the coast of south-western Sumatra increases dramatically during the positive phase of the IOD, known as positive IOD (pIOD) events (Saji et al. 1999; Webster et al. 1999; Susanto et al. 2001; Du et al. 2008; Chen et al. 2015; Delman et al. 2016; Kämpf and Kavi 2019). The pIOD events are traditionally defined by DMI values above 1°C for a continuous period exceeding 12 weeks. After this definition, only three significant cooling events can be identified in the years 1994, 1997 and 2006 during the period 1988–2017 (Fig. 1b). A strong pIOD event also occurred more recently in 2019 (not shown). Note that SST anomalies during such cooling phases are comparable to those triggered by the El Niño–Southern Oscillation in the eastern equatorial Pacific in terms of magnitude (>2°C), spatial extent (600 km by 200 km) and duration (>3 months).
This study focuses on the South-East Tropical Indian Ocean (SETIO), defined by 80°–110°E and 0–10°S, which comprises the eastern region used in the calculation of the DMI. Previous studies suggest that the variability of surface winds in the SETIO region play an active role in the creation and suppression of positive IOD events (e.g. Saji et al. 1999; Feng and Meyers 2003; Meyers et al. 2007; Vinayachandran et al. 2009; Chen et al. 2015; Delman et al. 2016), but the details of mechanisms triggering this variability remain unclear. The Madden–Julian Oscillation (MJO) is a prominent mode of intraseasonal atmospheric variability in the equatorial Indian Ocean (Madden and Julian 1971; Hendon and Glick 1997; Webster et al. 2002; Shinoda et al. 2013). The MJO dominates the intraseasonal variability of rainfall and wind over South Asia during the months of October–May (Zhang 2005). However, the MJO usually weakens substantially during the IOD season (Madden and Julian 1971, 1972; Webster et al. 2002; Wheeler and Hendon 2004; Chen et al. 2015) and therefore is unlikely to be involved in development of IOD events. Instead, Rao and Yamagata (2004) found that the zonal wind variability in the eastern equatorial Indian Ocean in this season is directly linked to the convective activities over the same region.
According to previous research, two different wind phenomena play a role in the SST variability in the SETIO: (1) westerly equatorial wind events and (2) alongshore winds along the west coast of Sumatra. Westerly equatorial wind events are deemed responsible for the creation of downwelling Kelvin waves transiently deepening the thermocline in the SETIO (Murtugudde et al. 2000; Sprintall et al. 2000; Susanto et al. 2001; Senan et al. 2003; Rao and Yamagata 2004; Iskandar et al. 2005, 2006; Chen et al. 2015; Delman et al. 2016). However, regional winds along the coastline of Sumatra and Java can modify the thermocline depth via the process of coastal upwelling or downwelling (Susanto et al. 2001; see Kämpf and Chapman 2016). Mechanisms that explain the relation between both phenomena and their causes remain unclear.
Recent findings by Kämpf and Kavi (2019) suggest that the coastal wind variability off Sumatra between the equator and 6°S controls the upwelling intensity of SST anomalies establishing farther in the south along the south-west coast of Sumatra. Here we reveal the existence of synoptic-scale atmospheric cyclones as the agent of this coastal wind variability. We also show that the years of low cyclone activity correspond to the development of positive IOD events.
2. Data and methods
Satellite-derived outgoing longwave radiation (OLR) can be used as proxy of atmospheric convective activity in the tropics, where lower OLR values represent deep atmospheric convection and higher OLR values represent suppressed atmospheric convection and open sky conditions. This study employs interpolated OLR data provided by NOAA/OAR/ESRL PSD for the period 1988–2016 to investigate tropical convective activity (Lee 2014; Lee et al. 2014). The surface wind analysis for the period 1988–2022 is performed using daily cross-calibrated multiplatform (CCMP) satellite ocean surface wind vectors derived from CCMP V-2.0 vector wind analyses, produced by Remote Sensing Systems (Atlas et al. 2011). The ERA5 hourly equatorial wind data (Hersbach et al. 2020) are used for comparison with the CCMP product. The horizontal wind streamfunction (ψ) is calculated from V = ∂ψ ÷ ∂x and U = −∂ψ ÷ ∂y, noting that positive anomalies of ψ correspond to negative pressure anomalies under geostrophic conditions. Zonal equatorial winds in the SETIO are characterised by their average over the area defined by 1°N–1°S and 80–90°E, which is within the region of highest wind variability (see Fig. 2c). Upwelling-favourable winds along the coast of Sumatra are characterised by the average of the coast-parallel wind component from 4°S to the equator and within 100 km of the coast. In analogue to the common definition of westerly wind bursts in the Pacific Ocean (see Eisenman et al. 2005), wind events (either along the equator or along the Sumatra coast) are defined here as situations in which the wind speed exceeds a threshold value of 4 m s–1 for more than 5 days. To this end, we also calculated the contribution of such events to the seasonal-averaged value. Anomalies are obtained by subtracting the monthly climatology from the original data and the standard deviation is derived using variation from the long-term mean. Composite maps are prepared by merging daily data based on different criteria described in the text.
|
3. Results and discussion
3.1. Climatology
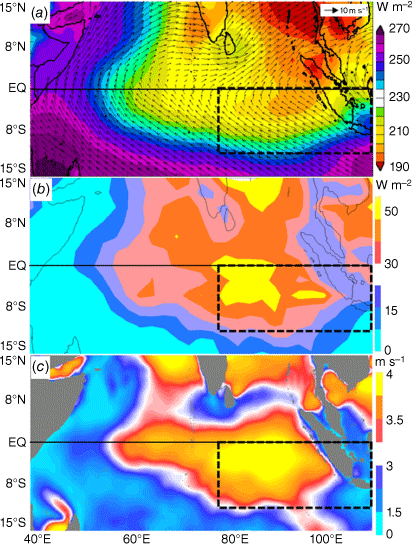
It is well known that the centre of deep atmospheric convection is located over the eastern equatorial tropical Indian Ocean region during the periods of January–May and October–December (Hendon and Glick 1997; Ashok et al. 2001; Schott and McCreary 2001; Webster et al. 2002; Li et al. 2003; Shinoda et al. 2013). However, during the months of boreal summer and autumn (i.e. the IOD season), the centre of deep tropical convection shifts northward to the Bay of Bengal (Shukla 2014), as also seen in our OLR distribution (Fig. 2a), where a local OLR minimum establishes over the Bay of Bengal. This is also consistent with the notion that surface winds tend to blow towards the centre of deep convection. Meehl (1987) concluded that synoptic-scale deep convective activity is characterised by an OLR value below a threshold of 220 W m–2. Applying this identifier to the eastern tropical Indian Ocean shows that a large portion the SETIO region still exhibits deep atmospheric convection during the IOD season (Fig. 2a), noting that the climatological mean surface winds are characterised by a south-easterly direction during this period (Fig. 1a).
3.2. Intraseasonal variability
Atmospheric tropical convection is a highly unstable and irregular phenomenon that exhibits pronounced intraseasonal variability. During the IOD season, the strongest OLR variability develops in two regions: (1) in the Bay of Bengal and (2) over the SETIO region (Fig. 2b). The large variability of zonal surface winds (Fig. 2c) confirms that deep tropical convection is a regular feature of the SETIO region during this season.
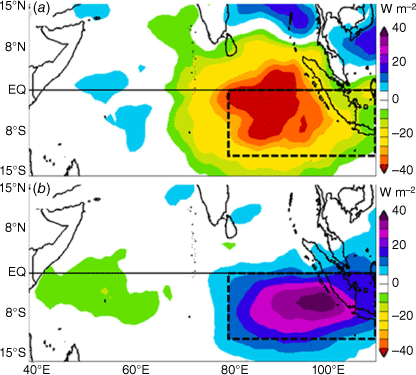
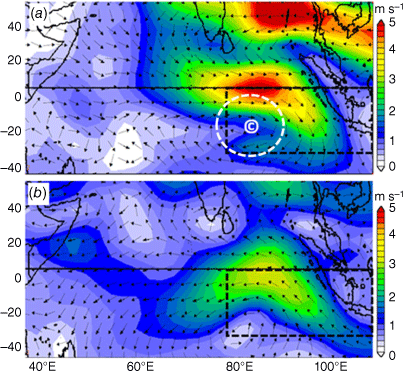
Using daily data, deep tropical convection events during the IOD season are further analysed by defining such events by OLR anomalies <−20 W m–2 (Fig. 3). The distribution of composite OLR anomalies falling within this criterion confirms that the centre of convective activity is located within the SETIO region (Fig. 4a), consistent with the OLR variability displayed in Fig. 2b. The corresponding composite field of surface winds (Fig. 5a) shows that such deep convection events relate to westerly wind anomalies along the equator in conjunction with north-westerly wind anomalies along Sumatra’s western coastline. Note that the remainder days of the OLR time-series with OLR anomalies >−20 W m–2 yield a composite distribution (results not shown) very similar to that corresponding the climatological average that is characterised by south-easterly winds along Sumatra’s western coastline.

|
|
|
The tropical convection within the SETIO region weakens substantially during pIOD events, whereas enhanced tropical convection develops in the western equatorial Indian Ocean (e.g. Ashok et al. 2001; Schott and McCreary 2001; Li et al. 2003). This is consistent with our composite map of OLR anomalies for pIOD events of 1994, 1997 and 2006 (Fig. 4b). In these years, atmospheric convection in the SETIO region is largely suppressed, characterised by positive OLR anomalies with values >20 W m–2 and weak atmospheric convection with OLR anomalies in a range between −10 and −5 W m–2 occurs in the western equatorial Indian Ocean (40–60°E). The corresponding spatial distribution of wind anomalies shows the existence of easterly wind anomalies along the equator together with south-easterly wind anomalies forming along Sumatra’s western coastline (Fig. 5b).
3.3. SETIO cyclones
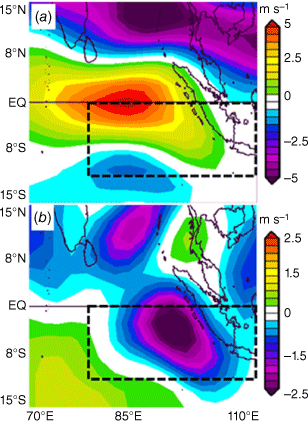
A closer analysis of daily atmospheric data reveals that strong events of deep atmospheric convection in the SETIO region coincide with the creation of relatively short-lived cyclonic wind patterns (Fig. 6 shows examples). Many cyclones, henceforth referred to as ‘SETIO cyclones’, consist of westerly wind along the equator and north-westerly wind along Sumatra’s west coast, which is consistent with the wind distribution shown in Fig. 5a. To derive the statistics for SETIO cyclones, we employed the same methodology that is used for the identification of westerly wind bursts in the equatorial Pacific (see Eisenman et al. 2005). Based on this methodology, SETIO cyclones were defined as westerly equatorial wind events with wind speeds exceeding a threshold value of 4 m s–1 for more than 5 days. With this method, we could identify a total of 162 SETIO cyclones, yielding an average number of 5.7 cyclones per IOD season. The identified cyclones are characterised by westerly equatorial winds (Fig. 7a) in conjunction with north-westerly wind anomalies along Sumatra’s west coast (Fig. 7c). Note that most of the identified cyclones coincide with OLR anomalies <−20 W m–2, which is indicative of the presence of deep atmospheric convection events.

|
|
Based on the identified cyclone events, we reconstructed the typical lifecycle of a SETIO cyclone in the form of daily sequences of the anomalies of OLR, wind speed and horizontal streamfunction (Fig. 8, 9). A few days before the event peak, defined as a westerly equatorial wind burst, a region of negative OLR anomalies starts to form along ~5°S in the SETIO region (Fig. 8). This OLR anomaly intensifies to large values of −50 W m–2 in a longitude range of 80–90°E, indicative of enhanced tropical convection. Concurrently, westerly wind anomalies develop along the equator between 90 and 100°E that rapidly intensify into a strong westerly wind burst. During this development, the streamfunction indicates the formation of cyclone centred in the SETIO region. This cyclogenesis leads to the intensification of north-westerly wind anomalies by ~3 m s–1 along Sumatra’s west coast within 2 days after the peak (Fig. 9). Four days after the peak, both OLR and equatorial wind anomalies have weakened substantially, while strong north-westerly winds along Sumatra’s west coast persist. The latter disappear after another couple of days, and the streamfunction indicates a southward trajectory of the cyclone. Sumatra’s wind anomalies tend to follow equatorial wind anomalies with a correlation coefficient of 0.69 for a lag of 2 days.

|

|
Several previous studies (Senan et al. 2003; Rao and Yamagata 2004; Iskandar et al. 2005; Chen et al. 2015; Delman et al. 2016) noted abruptly triggered westerly wind events over the eastern equatorial Indian Ocean. Our analysis indicates that SETIO cyclones have a characteristic timescale of 10 days, which is within the range of previously reported synoptic-scale summertime tropical disturbances of periods 3–8 days over the Bay of Bengal (Lau and Lau 1990) and quasi-biweekly oscillations of periods 10–20 days observed around Sumatra during boreal spring (May–March) (Wen and Zhang 2008).
3.4. Interannual variability of cyclone events
Our wind analysis reveals that SETIO cyclones are a common feature in the SETIO region (Fig. 10). On average, ~5 cyclone events form during an IOD season with a cumulative duration of ~50 days (Fig. 10b, c). The number of cyclone events during the IOD season varies interannually between 1 and 9 events, and so does their cumulative duration, varying between 10 and 90 days. Few cyclones are formed during pIOD events (1994, 1997, 2006 and 2019), and more cyclones than average are formed during negative phases of the IOD. The CCMP and ERA5 wind data indicate the same minimum and maximum numbers of cyclone events, but CCMP data indicate more cyclones during the period 2011–2018 than do the ERA data. The analysis of this discrepancy is beyond the scope of this paper.
|
For completeness, it should be noted that the IOD season of 2003 had relatively few (3) cyclones (Fig. 10b, c), indicative of a pIOD event. However, anomalous atmospheric convective activity in August 2003 altered the upwelling-favourable winds of the region and suspended the progress of a developing positive IOD event (Rao and Yamagata 2004). Further studies are required to explore the timing of individual cyclone events and their effect on SST anomalies in such years in more detail.
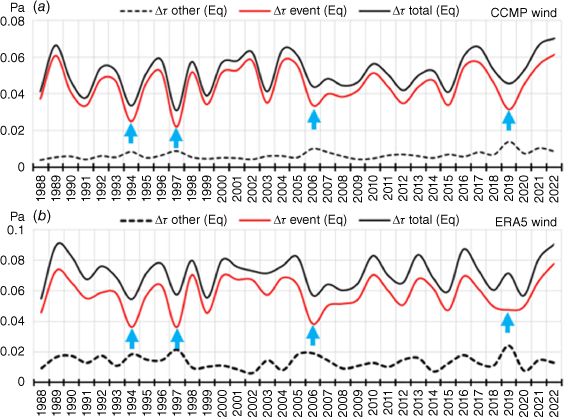
Normally, SETIO cyclones are effective over a cumulative period of 2 months, corresponding to half the IOD season. This frequent occurrence of SETIO cyclones explains their control on average equatorial zonal winds in the eastern Indian Ocean, which are almost absent otherwise (Fig. 11). Cyclones make up most of the average wind-stress magnitude of equatorial winds, and the number of cyclones determines the average wind stress, with is always westerly at longitudes of 80–90°E. The pIOD seasons of 1994, 1997, 2006 and 2019 are characterised by the lowest westerly wind stress on record within longitudes of 80–90°E, noting easterly winds develop closer to Sumatra (not shown). Note that equatorial wind stresses derived from ERA5 data generally exceed CCMP wind stresses by ~30%, but the interannual variability derived from both datasets is almost identical.
|
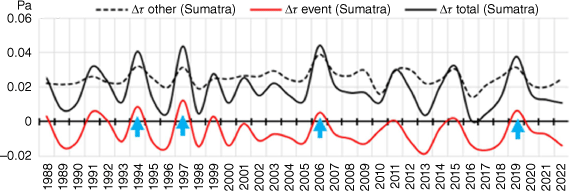
In addition, SETIO cyclones also control the magnitude of upwelling-favourable winds along Sumatra’s west coast within 4° of the equator (Fig. 12). On average, this region experiences mild south-easterly winds with a wind stress of 0.02–0.03 Pa. The SETIO cyclones operate to weaken this wind stress by 0.01–0.02 Pa. The strongest winds occur during pIOD seasons, which is explained by the absence of SETIO cyclones, consistent with previous findings (Kämpf and Kavi 2019).
|
3.5. Discussion
Although the existence of westerly equatorial winds in the eastern Indian Ocean is a well-known feature (e.g. Senan et al. 2003; Rao and Yamagata 2004; Iskandar et al. 2005; Chen et al. 2015; Delman et al. 2016), occasional synoptic-scale wind reversals along Sumatra’s coastline, identified here, have not been explicitly discussed in previous studies.
The periodicity of SETIO cyclones is markedly different from the well-known Boreal Summer Intra-Seasonal Oscillation (BSISO) (Lawrence and Webster 2002). These authors applied a band-pass filter to explicitly remove the higher-frequency modes that occur during the boreal summer with explicit references to periodicities of 7–9 days earlier identified by Lau and Lau (1990) and 10–20 days identified by Krishnamurti and Ardanuy (1980). This filter also removed the periodicity of SETIO cyclones. However, the analysis of Lau and Lau (1990) considered a much larger domain and returned dominant modes of synoptic variability in the Bay of Bengal and the East and South China Seas. This larger-scale variability overshadowed the less pronounced variability associated with SETIO cyclones. Krishnamurti and Ardanuy (1980) identified ‘monsoon breaks’ with a period of 10–20 days from atmospheric pressure data at 5° spatial resolution, which is too coarse to resolve SETIO cyclones.
For completeness, it is worthwhile to compare the equatorial dynamics of the Indian Ocean with that of the Pacific Ocean. The normal situation in the eastern intertropical Pacific Ocean is characterised by easterly equatorial trade winds together with south-easterly winds along Peru’s coast, where it usually creates excessive cold-water upwelling (see Kämpf and Chapman 2016). Occasionally, westerly wind bursts initiated over the oceanic Warm Pool in the western equatorial Pacific trigger an El Niño event that operates to suppress the Peru upwelling (e.g. McPhaden 1999). Conversely, westerly wind bursts and the suppression of upwelling is the normal situation in the eastern intertropical Pacific Ocean, and the intensification of cold-water upwelling is related to the absence of equatorial wind bursts. Hence, wind-disturbances strongly modulate the intensity of coastal upwelling and associated SST anomalies in both oceans. However, the intensity of equatorial upwelling is markedly different. In the Pacific Ocean, easterly trade winds induce continuous equatorial upwelling which is enhanced near the Peruvian coast. Due to the effect of SETIO cyclones, equatorial winds in the eastern Indian Ocean tend to be generally westerly and hence operate to suppress equatorial upwelling.
4. Conclusions
This work reveals the existence of a new type of atmospheric cyclone, called a SETIO cyclone, that frequently forms in the south-east tropical Indian Ocean during late austral winter months (June–September). The special feature of SETIO cyclones is that their northern flank constitutes westerly equatorial wind events, whereas their eastern flank of north-easterly wind anomalies operates to weaken upwelling along Sumatra’s west coast. Overwhelming scientific evidence from previous studies suggests that the wind variability in the SETIO region controls the IOD. Hence, it is reasonable to postulate that SETIO cyclones play a central role in the dynamics of the IOD. Future studies should explore which atmospheric or oceanic conditions support or suppress the formation of SETIO cyclones. For instance, Sumatra’s Barisan Mountains reach heights of up to 3.8 km and therefore pose a topographical barrier for tropospheric disturbances. Future studies should investigate how much topographic interactions with this mountain range can lead to the spin-up of westerly equatorial wind disturbances into mature SETIO cyclones.
Data availability
All data used in this project are publicly available. OLR data are available at https://www.esrl.noaa.gov/psd/data/gridded/data.interp_OLR.html. CCMP V-2.0 vector wind analyses can be downloaded at http://www.remss.com/measurements/ccmp/. NCEP-NCAR reanalysis data can be downloaded at https://www.esrl.noaa.gov/psd/data/gridded/data.ncep.reanalysis.html. ERA5 hourly surface wind data are available from https://cds.climate.copernicus.eu/cdsapp#!/dataset/reanalysis-era5-single-levels?tab=form.
Conflicts of interest
The authors declare that they have no conflicts of interest.
Declaration of funding
This research has not received external funding.
Acknowledgements
We acknowledge discussions with Piers Chapman and the late Matthias Tomczak that helped us in the development of this project.
References
Ashok K, Guan Z, Yamagata T (2001) Impact of the Indian Ocean Dipole on the relationship between the Indian monsoon rainfall and ENSO. Geophysical Research Letters 28, 4499–4502.| Impact of the Indian Ocean Dipole on the relationship between the Indian monsoon rainfall and ENSO.Crossref | GoogleScholarGoogle Scholar |
Atlas R, Hoffman RN, Ardizzone J, Leidner SM, Jusem JC, Smith DK, Gombos D (2011) A cross-calibrated, multiplatform ocean surface wind velocity product for meteorological and oceanographic applications. Bulletin of the American Meteorological Society 92, 157–174.
| A cross-calibrated, multiplatform ocean surface wind velocity product for meteorological and oceanographic applications.Crossref | GoogleScholarGoogle Scholar |
Black E, Slingo J, Sperber KR (2003) An observational study of the relationship between excessively strong short rains in coastal East Africa and Indian Ocean SST. Monthly Weather Review 131, 74–94.
| An observational study of the relationship between excessively strong short rains in coastal East Africa and Indian Ocean SST.Crossref | GoogleScholarGoogle Scholar |
Cai W, Pan A, Roemmich D, Cowan T, Guo X (2009) Argo profiles a rare occurrence of three consecutive positive Indian Ocean Dipole events, 2006–2008. Geophysical Research Letters 36, L08701
| Argo profiles a rare occurrence of three consecutive positive Indian Ocean Dipole events, 2006–2008.Crossref | GoogleScholarGoogle Scholar |
Cai W, Santoso A, Wang G, Weller E, Wu L, Ashok K, Masumoto Y, Yamagata T (2014) Increased frequency of extreme Indian Ocean Dipole events due to greenhouse warming. Nature 510, 254–258.
| Increased frequency of extreme Indian Ocean Dipole events due to greenhouse warming.Crossref | GoogleScholarGoogle Scholar |
Cai W, Wang G, Gan B, Wu L, Santoso A, Lin X, Chen Z, Jia F, Yamagata T (2018) Stabilised frequency of extreme positive Indian Ocean Dipole under 1.5 °C warming. Nature Communications 9, 1419
| Stabilised frequency of extreme positive Indian Ocean Dipole under 1.5 °C warming.Crossref | GoogleScholarGoogle Scholar |
Chan SC, Behera SK, Yamagata T (2008) Indian Ocean Dipole influence on South American rainfall. Geophysical Research Letters 35, L14S12
| Indian Ocean Dipole influence on South American rainfall.Crossref | GoogleScholarGoogle Scholar |
Chen G, Han W, Li Y, Wang D, Shinoda T (2015) Intraseasonal variability of upwelling in the equatorial Eastern Indian Ocean. Journal of Geophysical Research: Oceans 120, 7598–7615.
| Intraseasonal variability of upwelling in the equatorial Eastern Indian Ocean.Crossref | GoogleScholarGoogle Scholar |
Clark CO, Webster PJ, Cole JE (2003) Interdecadal variability of the relationship between the Indian Ocean zonal mode and East African coastal rainfall anomalies. Journal of Climate 16, 548–554.
| Interdecadal variability of the relationship between the Indian Ocean zonal mode and East African coastal rainfall anomalies.Crossref | GoogleScholarGoogle Scholar |
Delman AS, Sprintall J, McClean JL, Talley LD (2016) Anomalous Java cooling at the initiation of positive Indian Ocean Dipole events. Journal of Geophysical Research: Oceans 121, 5805–5824.
| Anomalous Java cooling at the initiation of positive Indian Ocean Dipole events.Crossref | GoogleScholarGoogle Scholar |
Du Y, Qu T, Meyers G (2008) Interannual variability of sea surface temperature off Java and Sumatra in a global GCM. Journal of Climate 21, 2451–2465.
| Interannual variability of sea surface temperature off Java and Sumatra in a global GCM.Crossref | GoogleScholarGoogle Scholar |
Eisenman I, Yu L, Tziperman E (2005) Westerly wind bursts: ENSO’s tail rather than the dog? Journal of Climate 18, 5224–5238.
| Westerly wind bursts: ENSO’s tail rather than the dog?Crossref | GoogleScholarGoogle Scholar |
Feng M, Meyers G (2003) Interannual variability in the tropical Indian Ocean: a two-year timescale of Indian Ocean Dipole. Deep Sea Research – II. Topical Studies in Oceanography 50, 2263–2284.
| Interannual variability in the tropical Indian Ocean: a two-year timescale of Indian Ocean Dipole.Crossref | GoogleScholarGoogle Scholar |
Hendon HH, Glick J (1997) Intraseasonal air-sea interaction in the tropical Indian and Pacific Oceans. Journal of Climate 10, 647–661.
| Intraseasonal air-sea interaction in the tropical Indian and Pacific Oceans.Crossref | GoogleScholarGoogle Scholar |
Hersbach H, Bell B, Berrisford P, et al. (2020) The ERA5 global reanalysis. Quarterly Journal of the Royal Meteorological Society 146, 1999–2049.
| The ERA5 global reanalysis.Crossref | GoogleScholarGoogle Scholar |
Iskandar I, Mardiansyah W, Masumoto Y, Yamagata T (2005) Intraseasonal Kelvin waves along the southern coast of Sumatra and Java. Journal of Geophysical Research 110, C04013
| Intraseasonal Kelvin waves along the southern coast of Sumatra and Java.Crossref | GoogleScholarGoogle Scholar |
Iskandar I, Tozuka T, Sasaki H, Masumoto Y, Yamagata T (2006) Intraseasonal variations of surface and subsurface currents off Java as simulated in a high-resolution ocean general circulation model. Journal of Geophysical Research 111, C12015
| Intraseasonal variations of surface and subsurface currents off Java as simulated in a high-resolution ocean general circulation model.Crossref | GoogleScholarGoogle Scholar |
Kämpf J, Chapman P (2016) ‘Upwelling Systems of the World. A Scientific Journey to the Most Productive Marine Ecosystems.’ (Springer International Publishing)
| Crossref |
Kämpf J, Kavi A (2019) SST variability in the eastern intertropical Indian Ocean – On the search for trigger mechanisms of IOD events. Deep Sea Research – II. Topical Studies in Oceanography 166, 64–74.
| SST variability in the eastern intertropical Indian Ocean – On the search for trigger mechanisms of IOD events.Crossref | GoogleScholarGoogle Scholar |
Kripalani RH, Oh JH, Chaudhari HS (2010) Delayed influence of the Indian Ocean Dipole mode on the East Asia–West Pacific monsoon: possible mechanism. International Journal of Climatology 30, 197–209.
| Delayed influence of the Indian Ocean Dipole mode on the East Asia–West Pacific monsoon: possible mechanism.Crossref | GoogleScholarGoogle Scholar |
Krishnamurti TN, Ardanuy P (1980) The 10 to 20-day westward propagating mode and “breaks in the monsoons”. Tellus 32, 15–26.
| The 10 to 20-day westward propagating mode and “breaks in the monsoons”.Crossref | GoogleScholarGoogle Scholar |
Lau K, Lau N (1990) Observed structure and propagation characteristics of tropical summertime synoptic scale disturbances. Monthly Weather Review 118, 1888–1913.
| Observed structure and propagation characteristics of tropical summertime synoptic scale disturbances.Crossref | GoogleScholarGoogle Scholar |
Lawrence DM, Webster PJ (2002) The boreal summer intraseasonal oscillation: relationship between northward and eastward movement of convection. Journal of the Atmospheric Sciences 59, 1593–1606.
| The boreal summer intraseasonal oscillation: relationship between northward and eastward movement of convection.Crossref | GoogleScholarGoogle Scholar |
Lee H-T (2014) Climate Data Record (CDR) Program, Climate Algorithm Theoretical Basis Document (C-ATBD): Outgoing Longwave Radiation (OLR) – Daily. CDR Program Document Number CDRP-ATBD-0526. (NOAA) Available at https://www.ncei.noaa.gov/pub/data/sds/cdr/CDRs/Outgoing%20Longwave%20Radiation%20-%20Daily/AlgorithmDescription_01B-21.pdf
Lee H-T, Schreck CJ, Knapp KR (2014) Generation of the Daily OLR Climate Data Record. In ‘2014 EUMETSAT Meteorological Satellite Conference’, 22–26 September 2014, Geneva, Switzerland. Available at http://olr.umd.edu/References/Lee_2014_Generation_of_Daily_OLR_CDR_Eumetsat_Sep2014.pdf
Li T, Wang B, Chang C-P, Zhang YS (2003) A theory for the Indian Ocean Dipole-zonal mode. Journal of the Atmospheric Sciences 60, 2119–2135.
| A theory for the Indian Ocean Dipole-zonal mode.Crossref | GoogleScholarGoogle Scholar |
Madden RA, Julian PR (1971) Detection of a 40–50-day oscillation in the zonal wind in the tropical Pacific. Journal of the Atmospheric Sciences 28, 702–708.
| Detection of a 40–50-day oscillation in the zonal wind in the tropical Pacific.Crossref | GoogleScholarGoogle Scholar |
Madden RA, Julian PR (1972) Description of global-scale circulation cells in the tropics with a 40–50-day period. Journal of the Atmospheric Sciences 29, 1109–1123.
| Description of global-scale circulation cells in the tropics with a 40–50-day period.Crossref | GoogleScholarGoogle Scholar |
McPhaden MJ (1999) Genesis and evolution of the 1997–98 El Niño. Science 283, 950–954.
| Genesis and evolution of the 1997–98 El Niño.Crossref | GoogleScholarGoogle Scholar |
Meehl GA (1987) The annual cycle and interannual variability in the tropical Pacific and Indian Ocean regions. Monthly Weather Review 115, 27–50.
| The annual cycle and interannual variability in the tropical Pacific and Indian Ocean regions.Crossref | GoogleScholarGoogle Scholar |
Meyers G, McIntosh P, Pigot L, Pook M (2007) The years of El Niño, La Niña, and interactions with the tropical Indian Ocean. Journal of Climate 20, 2872–2880.
| The years of El Niño, La Niña, and interactions with the tropical Indian Ocean.Crossref | GoogleScholarGoogle Scholar |
Murtugudde R, McCreary Jr JP, Busalacchi AJ (2000) Oceanic processes associated with anomalous events in the Indian Ocean with relevance to 1997–1998. Journal of Geophysical Research: Oceans 105, 3295–3306.
| Oceanic processes associated with anomalous events in the Indian Ocean with relevance to 1997–1998.Crossref | GoogleScholarGoogle Scholar |
Rao SA, Yamagata T (2004) Abrupt termination of Indian Ocean dipole events in response to intraseasonal disturbances. Geophysical Research Letters 31, L19306
| Abrupt termination of Indian Ocean dipole events in response to intraseasonal disturbances.Crossref | GoogleScholarGoogle Scholar |
Rao SA, Behera SK, Masumoto Y, Yamagata T (2002) Interannual subsurface variability in the tropical Indian Ocean with a special emphasis on the Indian Ocean Dipole. Deep Sea Research – II. Topical Studies in Oceanography 49, 1549–1572.
| Interannual subsurface variability in the tropical Indian Ocean with a special emphasis on the Indian Ocean Dipole.Crossref | GoogleScholarGoogle Scholar |
Saji NH, Yamagata T (2003) Possible impacts of Indian Ocean dipole mode events on global climate. Climate Research 25, 151–169.
| Possible impacts of Indian Ocean dipole mode events on global climate.Crossref | GoogleScholarGoogle Scholar |
Saji NH, Goswami BN, Vinayachandran PN, Yamagata T (1999) A dipole mode in the tropical Indian Ocean. Nature 401, 360–363.
| A dipole mode in the tropical Indian Ocean.Crossref | GoogleScholarGoogle Scholar |
Schott FA, McCreary JP (2001) The monsoon circulation of the Indian Ocean. Progress in Oceanography 51, 1–123.
| The monsoon circulation of the Indian Ocean.Crossref | GoogleScholarGoogle Scholar |
Senan R, Sengupta D, Goswami BN (2003) Intraseasonal “monsoon jets” in the equatorial Indian Ocean. Geophysical Research Letters 30, 1750
| Intraseasonal “monsoon jets” in the equatorial Indian Ocean.Crossref | GoogleScholarGoogle Scholar |
Shinoda T, Jensen TG, Flatau M, Chen S (2013) Surface wind and upper-ocean variability associated with the Madden–Julian Oscillation simulated by the coupled ocean-atmosphere mesoscale prediction system (COAMPS). Monthly Weather Review 141, 2290–2307.
| Surface wind and upper-ocean variability associated with the Madden–Julian Oscillation simulated by the coupled ocean-atmosphere mesoscale prediction system (COAMPS).Crossref | GoogleScholarGoogle Scholar |
Shukla RP (2014) The dominant intraseasonal mode of intraseasonal South Asian summer monsoon. Journal of Geophysical Research: Atmospheres 119, 635–651.
| The dominant intraseasonal mode of intraseasonal South Asian summer monsoon.Crossref | GoogleScholarGoogle Scholar |
Sprintall J, Gordon AL, Murtugudde R, Susanto RD (2000) A semiannual Indian Ocean forced Kelvin wave observed in the Indonesian seas in May 1997. Journal of Geophysical Research: Oceans 105, 17,217–17,230.
| A semiannual Indian Ocean forced Kelvin wave observed in the Indonesian seas in May 1997.Crossref | GoogleScholarGoogle Scholar |
Susanto RD, Gordon AL, Zheng Q (2001) Upwelling along the coasts of Java and Sumatra and its relation to ENSO. Geophysical Research Letters 28, 1599–1602.
| Upwelling along the coasts of Java and Sumatra and its relation to ENSO.Crossref | GoogleScholarGoogle Scholar |
Ummenhofer CC, England MH, McIntosh PC, Meyers GA, Pook MJ, Risbey JS, Gupta AS, Taschetto AS (2009) What causes southeast Australia’s worst droughts? Geophysical Research Letters 36, L04706
| What causes southeast Australia’s worst droughts?Crossref | GoogleScholarGoogle Scholar |
Vinayachandran PN, Saji NH, Yamagata T (1999) Response of the equatorial Indian Ocean to an unusual wind event during 1994. Geophysical Research Letters 26, 1613–1616.
| Response of the equatorial Indian Ocean to an unusual wind event during 1994.Crossref | GoogleScholarGoogle Scholar |
Vinayachandran PN, Francis PA, Rao SA (2009) Indian Ocean dipole: processes and impacts. In ‘Current Trends in Science’. (Ed. N Mukunda) pp. 569–589. (Indian Academy of Sciences: Bangalore, India)
Webster PJ, Moore AM, Loschnigg JP, Leben RR (1999) Coupled ocean–atmosphere dynamics in the Indian Ocean during 1997–98. Nature 401, 356–360.
| Coupled ocean–atmosphere dynamics in the Indian Ocean during 1997–98.Crossref | GoogleScholarGoogle Scholar |
Webster PJ, Bradley EF, Fairall C, et al. (2002) The JASMINE pilot study. Bulletin of the American Meteorological Society 83, 1603–1630.
| The JASMINE pilot study.Crossref | GoogleScholarGoogle Scholar |
Wen M, Zhang R (2008) Quasi-biweekly oscillation of the convection around Sumatra and low-level tropical circulation in boreal spring. Monthly Weather Review 136, 189–205.
| Quasi-biweekly oscillation of the convection around Sumatra and low-level tropical circulation in boreal spring.Crossref | GoogleScholarGoogle Scholar |
Wheeler MC, Hendon HH (2004) An all-season real-time multivariate MJO index: Development of an index for monitoring and prediction. Monthly Weather Review 132, 1917–1932.
| An all-season real-time multivariate MJO index: Development of an index for monitoring and prediction.Crossref | GoogleScholarGoogle Scholar |
Yamagata T, Behera SK, Luo J-J, Masson S, Jury MR, Rao SA (2004) Coupled ocean–atmosphere variability in the tropical Indian Ocean. In ‘Earth’s Climate’. (Eds C Wang, S Xie, J Carton) Geophysical Monograph Series, vol. 147, pp. 189–212. (AGU)
| Crossref |
Yuan Y, Yang H, Zhou W, Li C (2008) Influences of the Indian Ocean Dipole on the Asian summer monsoon in the following year. International Journal of Climatology 28, 1849–1859.
| Influences of the Indian Ocean Dipole on the Asian summer monsoon in the following year.Crossref | GoogleScholarGoogle Scholar |
Zhang C (2005) Madden–Julian Oscillation. Reviews of Geophysics 43, RG2003
| Madden–Julian Oscillation.Crossref | GoogleScholarGoogle Scholar |