
Australian rainfall anomalies and Indo-Pacific driver indices: links and skill in 2-year-long forecasts
I. G. Watterson A * , T. J. O’Kane B , V. Kitsios A and M. A. Chamberlain B
A Climate Science Centre, CSIRO, Aspendale, Vic. 3195, Australia.
B Climate Science Centre, CSIRO, Hobart, Tas. 7004, Australia.
Journal of Southern Hemisphere Earth Systems Science 71(3) 303-319 https://doi.org/10.1071/ES21008
Submitted: 16 April 2021 Accepted: 18 November 2021 Published: 9 December 2021
© 2021 The Author(s) (or their employer(s)). Published by CSIRO Publishing on behalf of BoM. This is an open access article distributed under the Creative Commons Attribution-NonCommercial-NoDerivatives 4.0 International License (CC BY-NC-ND)
Abstract
Two-year-long simulations of the atmosphere and ocean by the Commonwealth Scientific and Industrial Research Organisation's (CSIRO) Climate Analysis Forecast Ensemble (CAFE) modelling system are analysed, with a focus on Indo-Pacific sea surface temperature (SST) climate drivers and their teleconnection to Australian rainfall. The simulations are 11-member ensemble forecasts (strictly, hindcasts) initiated each month from 2002 to 2015, supplemented by a 100-year-long control simulation. Using correlations r between seasonal and annual means, it is shown that the links between the interannual variations of All-Australia precipitation (AApr) and the standard driver indices, together with the Pacific-Indian Dipole (PID), are mostly similar to those derived from observational data. The vertically integrated meridional flux of moisture towards northern Australia is linked to both the SSTs and AApr. Correlations between ensemble averages and observations are used as a measure of forecast skill, calculated for each start month and for lead time after start. Positive correlations hold over the first year for much of the low-latitude Pacific and for the drivers. The forecasts become more skillful than persistence, with r for PID averaging 0.3 higher over lead times of 7–13 months. The forecast of seasonal AApr has moderate to good correlations (r 0.4–0.8) for seasons centred on September–February. This is largely consistent with skill in both the flux and in the SST drivers. Correlations are also good for 1-year and 2-year means. This apparent skill is currently being explored using a new larger suite of CAFE forecasts.
Keywords: atmospheric moisture flux, Australian rainfall, ENSO, ERA5, Indo-Pacific climate drivers, Pacific‐Indian Dipole, seasonal and annual forecasts, teleconnection.
1 Introduction
Seasonal rainfall over Australia is notably variable from year to year, in part because of the influence of variations in the atmospheric circulation linked to sea surface temperature (SST) anomalies in the Indo-Pacific region. Typically, these ‘drivers’ of variability can be characterised using one or more indices or time series that quantify the amplitude and sign of their interannual anomalies. The El Niño Southern Oscillation (ENSO) is the most prominent driver for much of the Indo-Pacific region, and the indices Niño4 and Niño3.4 (denoted here NINO4 and NINO34) measure SSTs in the central equatorial Pacific. Anomalies in the Indian Ocean have been represented by the Indian Ocean Dipole (IOD), using regions depicted, along with others, in Fig. 1. The teleconnection between the SST anomalies and Australia has been the subject of many studies, more recently including those by Klingaman et al. (2013), Cai et al. (2019), Van Rensch et al. (2019), and Zhao et al. (2019). The links to Australian rainfall have been reviewed by Dey et al. (2019). The effects of the atmospheric transport of moisture on rainfall have been studied by Taminiau and Haarsma (2007), Gu and Adler (2019), Marshall (2019), Hauser et al. (2020), Holgate et al. (2020), Ye et al. (2020), and others. Watterson (2020) presented regression relationships with various driver indices, including the ‘Pacific-Indian Dipole’ (PID), which combines the west Pacific and the east Indian Ocean anomalies, as represented in the European Centre for Medium-Range Weather Forecasts (ECMWF) reanalysis 5 (ERA5) data (Hersbach et al. 2020). The quantities considered included the vertically integrated (from the surface to top of atmosphere) horizontal moisture transport or ‘flux’ vector. Anomalies in this flux extended from the tropics through to Australia.

|
Although the standard SST drivers link more strongly to rainfall in certain seasons and parts of Australia, there is considerable spatial coherence in rainfall anomalies on annual and longer timescales (e.g. Smith 2004, Power et al. 2006). Watterson (2020) found that the spatial average rainfall over Australia (Fig. 1), All-Australia precipitation (AApr), related particularly well with the PID. The PID anomaly for 2018–2019, a record 2-year dry period for Australia, was linked (simply through regression of 2-year means) to some 46% of the AApr deficit, which is more than for other single indices.
Predictions of the state of ENSO and other drivers have been a focus of numerous modelling centres worldwide, such as those contributing to the North American Multi-model Ensemble (NMME, Barnston et al. 2019). Typically, these are based on ensembles of simulations by coupled atmosphere–ocean modelling systems. Forecasts of temperature and rainfall for many parts of the world are being made (e.g. by ECMWF) for a ‘lead’ time (the time prior to the start of the time period being forecast, or ‘target period’) of a month or longer. There has been some consideration of forecasting the associated moisture fluxes, for example by Zhang et al. (2019) and Mahlstein et al. (2019). Wittenberg et al. (2014) and others provide evidence that ENSO may be predictable several years ahead. Multi-year prediction is actively pursued by the groups contributing to the World Meteorological Organisation’s Lead Centre for Annual-to-Decadal Climate Prediction (WMOLC, hadleyserver.metoffice.gov.uk/wmolc). Prediction of monthly to seasonal rainfall over Australia is performed by the Bureau of Meteorology (Hudson et al. 2017, and www.bom.gov.au/climate/outlooks), supported by studies including Frederiksen et al. (2018), Marshall and Hendon (2019) and King et al. (2020). Recently, the Commonwealth Scientific and Industrial Research Organisation's (CSIRO) Decadal Climate Forecasting Project (DCFP) has developed the Climate Analysis Forecast Ensemble (CAFE) modelling system, described by O’Kane et al. (2019), with the aim of extending forecasts of SST drivers and of Australian climate to lead times of seasons to multiple years.
An interesting feature of the forecasting of NINO indices by many modelling systems is the dependence of the skill at long lead times on the starting month of the model simulations used to make the forecast. Some of this dependence has been denoted the ‘boreal spring predictability barrier’ (Lai et al. 2018). O’Kane et al. (2020) found that an ensemble of CAFE simulations, starting within 2002–2015, provided an improved forecast of NINO4 over most models in the NMME at lead times approaching the end of the year-long NMME data set, in particular for target months corresponding to the boreal spring (March–May). This is attributed to the CAFE system using both the assimilation of the sub-surface ocean data and the use of an ensemble of initial perturbations within the ocean thermocline that is designed to express at the surface after about 6 months. The ensemble average provides an improvement in skill over that of an alternative ensemble (O’Kane et al. 2019). The somewhat lower skill of CAFE before then was attributed to the limited initialisation of the atmosphere and global surface for these runs. In addition, there is an exaggerated strength in ENSO variability in June–August in the ‘control run’ or free-running simulation of the CAFE model, which appears to limit skill in that season for starts in December–February.
The purpose of this study is to make a further assessment of the CAFE ensemble simulations, extending through their second year and addressing the teleconnection to Australian rainfall. With the CAFE model having relatively modest spatial resolution (~2°), some focus on AApr and on the PID index, defined with relatively large regions (Fig. 1), may be helpful.
The following section presents the data used from three main sources: observational (Obs) data, the CAFE control run, and the CAFE forecast simulations. The relationships between AApr, flux, and other variables, as quantified by linear regression, in the control run are compared with those in ERA5. Section 3 examines the links between four SST driver indices, the teleconnection to Australia, moisture flux towards northern Australia, and AApr in the three data sources. Section 4 compares the CAFE forecasts with Obs data, with a basic assessment of skill using the (Pearson) correlation coefficient (r) between running monthly and seasonal averages. The links and forecast skill for annual means are considered in Section 5. It is acknowledged that with the limited number of years from which the ensembles start, there is considerable statistical uncertainty in the correlations. Further, the simulations are actually ‘hindcasts’, so although the correlations found are encouraging, they should only be considered as indicative of potential skill of true forecasts. The conclusions follow. Some supporting figures (denoted S1–S4) are presented in the supplementary material.
2 Data and methods
2.1 Observational data
The Obs SST for the NINO34 and NINO4 regions is the National Centers for Environmental Prediction (NCEP) weekly OISST.v2 data (Reynolds et al. 2002) obtained from www.cpc.ncep.noaa.gov/data/indices. For the analyses used here (as for Watterson 2020), there was no need to normalise the SST data. Except for certain longer-term series, as will be noted, data were not detrended.
For a range of variables in gridded form, we used ERA5 data, which are presented by the Copernicus Climate Change Service (C3S, 2017) and were comprehensively assessed by Hersbach et al. (2020). Watterson (2020) used the monthly mean data from 1979–2019 in an assessment of the regional atmospheric anomalies associated with the low Australian rainfall of 2018–2019. The links with the Indo-Pacific climate driver indices are further analysed here, and the SST data now available in the reanalysis was used to define the PID and IOD indices. Previously, Watterson (2020) used surface air temperature (tas). These indices are the simple differences between the regional averages shown in Fig. 1: PID = PAC–IND and IOD = IODW–IODE. There is a noticeable difference between SST and tas from ERA5 in the Indonesian region, with larger variability in the indices using SST. The effect on regression results is limited, however. Some (minor) differences between the assessment of the CAFE forecasts and earlier results based on the previous ECMWF Re-Analysis Interim (ERA-Interim) reanalyses (see Hersbach et al. 2020) were noted (see Section 4.2). ERA5 was also used for Obs data over the Indo-Pacific of precipitation, mean sea level pressure (psl), wind vectors, and the vertically integrated horizontal moisture flux vector and its convergence.
For rainfall, the focus was on the AApr series provided by the Bureau of Meteorology website. This is based on the current Australian Gridded Climate Data (AGCD) analysis of monthly means, as documented by Evans et al. (2020). The AApr series is very similar to the previous (Australian Water Availability Project, AWAP) series used by Watterson (2020), who showed that the latter was closely correlated with the Australia (Fig. 1) spatial average of ERA5 total precipitation for the annual and seasonal series as used here. In fact, the AGCD r values for the interannual variability of five cases, annual, and four standard seasons, were each slightly higher than for AWAP. The AGCD–ERA5 r values ranged from 0.97 (annual) to 0.99 (JJA, June–August). Time series of AGCD rainfall averaged over other Australian regions were also used in our assessments, but these are not presented here.
Watterson (2020) showed regression coefficients for the relationship between ERA5 seasonal means of AApr and other variables at grid points. The fields of correlation r for grid point rainfall and each moisture flux component are plotted in Fig. 2a for ERA5 from 1980 to 2017. At nearly all locations, the rainfall correlation is positive, supporting coherence of anomalies in each season. The variability of AApr strongly correlated with fluxes across the Australian north coast, especially within the monsoon from the northwest in December–February (DJF). Southward flux provided additional moisture to southeastern Australia in all four seasons. The maximal correlation, for flux components in any direction, is shown in Supplementary Fig. S1a. With the concentration of moisture in the lower troposphere it is suspected that much of the flux anomalies were from horizontal transport below 500 hPa. The focus here on the integrated flux is partly because of its availability from ERA5 but also because of its role in balancing precipitation in the (integrated) atmospheric moisture budget (e.g. Watterson et al. 2021).

|
2.2 CAFE control simulation
The CAFE system is based on the Geophysical Fluid Dynamics Laboratory (GFDL)-CM2.1 model of Delworth et al. (2006), and a long control simulation is analysed for an evaluation of its realism. The model is described in some detail by O’Kane et al. (2019), but a brief summary follows. The atmospheric model, GFDL-AM2, has a resolution of (approx.) 2° in latitude and 2.5° in longitude, and 24 hybrid (sigma-pressure or terrain-following pressure) vertical levels. The land model, GFDL-LM2, is on the same horizontal grid. The ocean grid is in common with the Australian Community Climate and Earth System Simulator-CM2 model described by Bi et al. (2020). The nominal resolution is 1°, with extra latitudinal resolution in the tropics and the Southern Ocean. There are 50 vertical levels, with a 10-m resolution in the upper ocean. The grid is tripolar to avoid the North Pole singularity. As described by O’Kane et al. (2020), the free-running coupled model has an equatorial Pacific cold bias, as is typical of such climate models. The major region of variability in the equatorial Pacific is displaced to the west of the observed maximum. This bias impacts the modelled ENSO phase locking. In the 500-year control simulation considered here, and used in the forecast system, bias in the mode water structure was reduced by restoring the temperature and salinity of water below 2000 m to observations. The ENSO cycle is more vigorous than is observed. Nevertheless, the teleconnection patterns from regression with the ENSO indices have much in common with those obtained from ERA5, as will be shown. The final 100-year sequence of the control run is used here.
The atmospheric model and its output feature in numerous studies (including Wittenberg et al. 2014). The vertically integrated moisture flux is not a standard product, but it has been calculated here using the daily means of winds and specific humidity output on the 24 model levels. This produced a very close approximation to the tropical moisture fluxes that are the focus here. To provide an indication of the realism of the relationship between AApr and gridpoint rainfall and flux in CAFE, the seasonal fields of correlation are shown in Fig. 2b. The patterns are similar to those from ERA5, although with some shifts in position and strength. The statistical uncertainty in such patterns associated with a record of limited length is acknowledged, along with the reduced applicability of linear regression for rainfall, which is often non-normally distributed, especially at gridpoints.
2.3 CAFE forecast simulations
The CAFE forecast data set contains 11-member ensembles of 24-month-long simulations initialised at the beginning of each month from February 2002 to December 2015, making a total of 1837 simulations by the CAFE coupled model. The generation of the initial states is described by O’Kane et al. (2019, 2020). A brief overview is given here. For each starting month, the forecasts were initialised as perturbations about a single analysed state that approximates the coupled climate system for that month. CAFE assimilates a comprehensive range of surface and sub-surface ocean observations using ensemble optimal interpolation. Balance between the atmosphere and the analysed ocean was achieved via additional increments to the atmosphere on the basis of cross-domain covariances between the ocean and atmosphere, but otherwise, atmospheric conditions were generated by the model. Initial conditions for the ensemble forecasts were generated as bred vectors (BVs) on a monthly cycle. The BVs were rescaled relative to the standard deviation (s.d.) for the ocean temperature in the upper 500 m calculated from anomalies relative to a seasonal climatology based on the control simulation. Only temperatures within an isosurface located around the tropical thermocline (not including the surface) were perturbed. The structure of the perturbations was designed to impact the surface after about 6 months and rapidly modify tropical convection and, subsequently, the Hadley Circulation (O’Kane et al. 2019).
O’Kane et al. (2019, 2020) presented analyses of monthly means of the NINO4 index. Here, all results were derived from the atmospheric model’s daily mean output. Driver indices were formed from the spatial mean of surface temperature over the ocean grid points (which is used as SST) in the regions depicted in Fig. 1. Since day-to-day weather was not the focus, 5-day or pentad averages were then taken, followed by running averages of multiple pentads. Results were derived for each calendar starting month in turn.
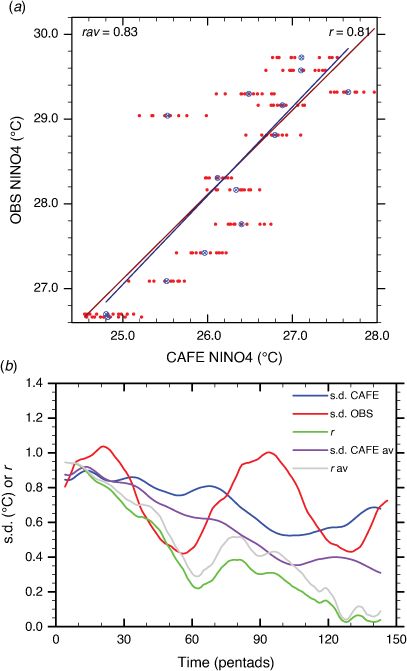
It is worthwhile illustrating the behaviour of an SST index across a multi-year ensemble, and Fig. 3 shows results for runs starting 1 October across 14 years (2002–2015). The NINO4 SST values from the model are plotted against those from NCEP. To allow for consistent processing, the NCEP weekly data were first converted to a daily series, simply by repeating values, and the same was done for the other monthly Obs series. For Fig. 3, seven-pentad running means were then taken, denoted as monthly (but actually 35-day averages). The CAFE NINO4 values from all 154 runs are shown in Fig. 3a for the period centred on pentad 21, so approximating January. The Obs values depend only on the starting year. Also shown is the 11-run ensemble average (denoted ‘av’) for each year case. While the 11 model values within each ensemble are almost identical in the first pentad (1–5 October), there is considerable spread in each case for the period shown. There is a high correlation between the CAFE and Obs values, with a similar coefficient using the individual values (r) or the ensemble averages (denoted rav), as marked. We use ‘high’ to describe r over 0.8, ‘good’ for 0.6–0.8 and ‘moderate’ for 0.4–0.6. The regression lines are also shown in Fig. 3a. Note that these raw model and Obs values only approximately match. Correlations are a measure of agreement that allows for a model bias (and Obs uncertainty) in both mean and s.d. or spread. Note that since the correlations were always for values for the same start and target times, they match the ‘anomaly correlation coefficients’ used by O’Kane et al. (2020). The correlations are shown as a function of time after start in Fig. 3b. For the first month, r and rav were both very high. They fell but remained positive through the 2-year forecast in this case. The correlation for the ensemble average was always a little higher. This is a typical result, as discussed by Christiansen (2019). For both CAFE and Obs, the s.d. across the values at each time is shown. The s.d. for CAFE ensemble averages (av) fell because variability, unrelated to the initial states, grew. Note the minimum for Obs s.d. occurred in June–July (after the boreal spring). After that, a small rise in r followed that in s.d. Note that the time in the x-axis is also the ‘lead time’, with respect to forecasting for a target date that is the centre of the averaging period used. Further comparison of the forecasts and Obs are deferred to Section 4.
|
All such results are presented as representative of the period analysed, supported by some assessment of the mechanisms involved. Inferring results for a hypothetical longer period was not attempted, so statistical significance was not addressed in detail. Naturally, with only 14 year cases available for each starting month, there was considerable statistical sampling uncertainty. For example, a correlation of 0.7 from a hypothetical much larger set of years would, under the usual assumptions, result in a sample r within a range of 0.45–0.85, with an 80% chance. Similarly, r needs to have magnitude 0.37 to reach statistical significance at this modest 0.2 level. In the tables, r values below this level are shown in italics.
3 Links between Australian rainfall and drivers
3.1 ERA5 and CAFE control
The teleconnection between Australian rainfall and the Indo-Pacific climate driver indices was explored by Watterson (2020) using ERA5 data from 1980 to 2017. Maps of regression coefficients (the anomaly at 1 s.d. of the index) for a standard set of variables were presented to illustrate the relationship for seasonal means with either the AApr or a driver index in the same season. Similar maps have been developed for the longer (100-year) CAFE control run, providing a qualitative evaluation of the simulated teleconnection process. The results for the NINO4 index are shown in Fig. 4, and with the interest in longer periods, they are for an annual case, with all quantities being January–December means. The ERA5 maps are similar to the result for the PID index (which is well correlated with NINO4) shown by Watterson (2020, fig. 9a). Detrending NINO4 and using the SST version of the index made little difference. The control run results were broadly very similar. In both, the temperature (tas, here) was high over the NINO4 region and much of the equatorial Pacific. Rainfall was high at the western end, where there were eastward flux anomalies. Although the magnitudes of the fluxes across northern Australia are smaller than those near the equator, the fluxes were mostly northwards. This likely contributed to dryness over much of the continent, where temperature and pressure tended to be higher. Relative to ERA5, the westward shift and strength of the equatorial warmth reflected the modelled ENSO.

|
Certainly, the CAFE model was able to simulate a strong link to Australian rainfall. Returning to the All-Australia mean, the correlations with drivers in the annual and seasonal cases are given in Table 1. The ERA5 1979–2019 r values were very close to those given by Watterson (2020), although the series were updated to the SST-based drivers and to AGCD for AApr. CAFE’s (100-year) annual NINO4 r value of −0.56 matched ERA5’s −0.58 well. The annual result for the driver PID was larger again for ERA5 but not for CAFE. The correlations tend to be stronger in the September–November (SON) season. As discussed by Watterson (2020), and supported by Fig. 4, rainfall anomalies over Australia related to the SST drivers tend to be of the same sign across the continent. Certainly, the location of the strongest influence varied with season and driver. However, in the analyses that follow, correlation for regions tended not to be larger than those for AApr. Using larger spatial averages can limit the variability unrelated to the drivers.

|
Given that the CAFE forecasts cover the shorter period 2002–2017, the Obs correlations for this period are also given in Table 1. Here the NCEP NINO34 and NINO4 series were used. The values for SON and DJF were all more negative, with r for PID reaching −0.94 in SON. Some of the differences between correlations for different years could be considered an effect of statistical sampling. However, Power et al. (2006) linked such variations to longer-term patterns of the coupled climate system. The larger values for 2002–2017 in some cases may indicate that the indices and AApr are potentially more predictable for that period than earlier.
3.2 CAFE forecasts
The time series of correlations between CAFE forecasts and the Obs NINO4 in Fig. 3 is an example of r values that vary not just between the times of the year (running month in that case) but also between the lead times or times after the start of the runs. Links between forecast quantities can be evaluated in a similar way. Running 19-pentad (95-day) means of the simulated driver and rainfall series were taken to produce our ‘running seasonal’ means. The correlations for each set of starting times and lead times were calculated both for all runs and for the 11-member ensemble averages. Fig. 5a shows values for rav between −PID and AApr as a lead-time series, like Fig. 3, but with the y-axis used to allow all starting months. The negative sign allows the colour scheme to be consistent with that in other plots. From the resulting contour ‘start–lead’ plot, it is evident that good to high correlations held for most pairs of start and lead times. The value shown at 1.5 months lead time (centred on the first whole season) after the September start was −0.83 for rav (of +PID). It was a little stronger than the r = −0.69 for all runs, which compared better with previous values for SON in Table 1. Over the other starting months, the seasonal values were fairly similar to the CAFE control results, although with less variation than for Obs 2002–2017. Since the focus of the skill assessment was lead times of over 6 months, values were for the standard seasons, centred on a lead time of 7.5 months, with the corresponding starts given. For each of the four driver indices, the av values were all larger, except for the target season DJF, when values remained small. From Fig. 5a, for PID rav, such low values held only for June and February starts, and high correlations returned later in those runs. Some of this variation, both across the start months and over time, seems likely to be by chance, but some may result from the coupled model’s natural variability emerging. Indeed, at leads of around 1–1.5 years, there were strong links for the target season SON, as for CAFE control. The target SON was at the centre of the diagonal band of high rav, from the September start at 1 year to the March start at 1.5 year.
|
An interpretation of the results is that there is a link between a driver and AApr, relating to a ‘signal’ of teleconnection within a season. Variability in AApr unrelated to the driver diminishes the correlation. Indeed, some of this may result from an individual driver index not representing all of the SST-driven signal. The All results in the forecasts would have a similar ratio of signal to unrelated variability to that of the control run and Obs. By taking 11-member averages, the ratio should be raised and the correlation strengthened, as was seen.
3.3 Moisture transport
To address the mechanism of moisture flux relating to AApr (Fig. 2, Supplementary Fig. S1), we use an index based on moisture flux. The region used is the band over and to the east of northern Australia, 125–155°E, 15–10°S, as shown in Fig. 1. The index is the average of meridional flux over the band, ‘NAF’ for short. A negative NAF represents moisture transport into northeastern Australia. In the control run, NAF correlated with AApr, reaching r = −0.82 in DJF. Slightly higher values held for points a little to the west (Supplementary Fig. S1), but these seem less influenced by the drivers (Fig. 4). Consistent with the supply of low-latitude moisture, southward NAF is positively correlated with AApr.
The link between the negative of NAF and rainfall in the ensemble average of forecast simulations is shown in Fig. 5b. The correlation was over 0.9 for many of the start-lead times, and it was rarely below 0.6. Values (Av) for the target seasons beginning 6 months after the start are given in Table 1. Values for All are also good to high. Evidently the link between flux and AApr anomalies held well in individual runs. There seems to be less unrelated variability that can be overcome by averaging runs. Also given in Table 1 are values for the link between forecast PID and NAF. These reached 0.85 for av in MAM, indicative of a role for PID in generating NAF anomalies. Some variation in r across the seasons would follow from that in the atmospheric circulation and in humidity, such as illustrated for links with PID in ERA5 by Watterson (2020). Sampling and model bias would also contribute.
4 Assessment of skill in CAFE forecasts of monthly and seasonal means
4.1 SST
As shown in Fig. 3, the correlation across the 14 years of 1 October starts between the forecast running monthly SSTs in the NINO4 region and the Obs was initially very high and declined over the simulation (or lead) time. High correlations can be interpreted as a measure of skill in the forecasts; O’Kane et al. (2020) show this measure and some others. Since other ocean regions may be important drivers, it is important to examine correlations for SSTs at other tropical points. For this, the SST fields from the ERA5 data archive were used as Obs, using values remapped to the CAFE grid. The CDO conservative remapping software was used. As for all following results, the model values were the 11-member ensemble averages, and ‘r’ iwas the correlation for these (the rav in Fig. 3). The map of correlations for the first month (here using the usual monthly mean data) and the following months 3–9 are shown in Fig. 6. The decline in r over the 9 months at points in NINO4 relates to that in Fig. 3. Correlations for SSTs elsewhere were also generally high initially and were often positive, even in month 9. Some negative values appear, even initially, a consequence of the influence of the coupled model on the climate state during the data assimilation process. As seen in Fig. 3, the correlation for NINO4 remained positive into the second year. From the maps, we can see that positive correlations should hold for the other indices, in particular NINO34 and PID. The corresponding maps for the starting month June are shown in Supplementary Fig. S2. In that case, positive r continues even more strongly in the equatorial Pacific. Note that some r values over the continents appear in Fig. 6 and Supplementary Fig. S2 as a result of the ERA5 fields including the temperature of the surface of lakes and the CAFE variable covering all surfaces.

|
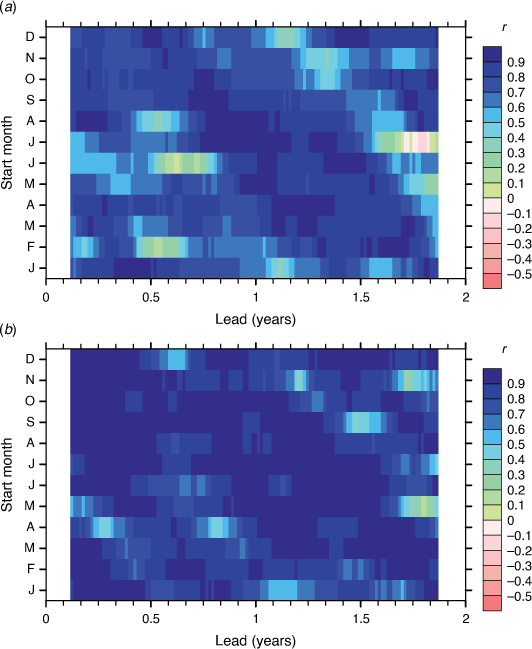
Using ensemble average and monthly means of three driver indices, the correlations for all starting months and lead times are shown as contour plots in Fig. 7, with NINO4 shown in the centre, as Fig. 7b. Note that O’Kane et al. (2020) plotted very similar NINO4 results in their fig. 3a but with the y-axis being the target month. Consistent with the maps in Fig. 6, for October starts, skill (by r) was a little smaller and less persistent for the SSTs to the east (NINO34) and west (PID). There was considerable dependence on the starting month for all. The initial skill was moderate for June starts but persisted for longer. For starts in February–April, the skill fell by the target months June–August, after the boreal spring. However, correlations for these SSTs then returned to moderate values, even into the second year. Note that results for a single target month lie along a backward diagonal here. The set of Obs values will be the same along the diagonal, except if the first or last year changes. Some of the variation with the longer lead times occurred with a diagonal pattern that repeated after 12 months, such as is evident in Fig. 7a, suggesting a return of skill. Other variations are within that which might be expected from statistical uncertainty (say ±0.3), given the limited number of cases. Again, these results are specific to this set of years.

|
As is well known, some of the correlation patterns in forecast SST indices is seen also in the skill of persistence. This is demonstrated here by replacing the forecast SSTs by the values from the first month (at pentad 4), for each start. The resulting start-lead plots are essentially an Obs result and are shown in Supplementary Fig. S3. The correlations diminished with lead time but only slowly for the cases of starts after boreal spring. For each case, the correlation then dropped to near-zero and remained within the sampling uncertainty, consistent with index anomalies having no relationship to the past. For NINO34, the decline from moderate correlation to zero for a persistence forecast occurred rapidly (within a couple of months) but as much as 12 months after the start. The difference in r for forecast minus persistence is shown in Fig. 7d–f. The difference in r was sometimes negative in the lead-time months 2–10, most strongly for NINO34. As discussed by O’Kane et al. (2020), this points to the limitations in the initialisation of the atmosphere and surface ocean and in the coupled variability of the model. However, beyond this period, and particularly after the boreal spring, the forecasts were more skillful than persistence. In the case of PID (Fig. 7d), this improved skill is evident from months 5–14 in all starting months. Skill continued even longer in NINO4, although the correlations of ~0.3 were weak. Still, they occurred for all 12 start months, with separate multi-year ensembles of simulations. Averaging over all starts and lead times from month 7 to month 13, the improvement in r from the forecast over persistence was 0.30 for PID, 0.20 for NINO4, and 0.19 for NINO34. Some negative values in Fig. 7d–f beyond this time may, again, be a result of sampling, although model bias late in the runs may contribute.
With the focus of this study being forecasts on longer timescales, the correlations between running seasonal means of the SST driver indices and Obs were also evaluated for each start month. Aside from the first values being at pentad 10 after the start, the contour plots resembled a somewhat smoothed version of the monthly results, as can be seen in the NINO4 and NINO34 plots in Supplementary Fig. S4 and that for PID in the next section. Also shown in Supplementary Fig. S4 are the results for IOD, for which the correlations were initially moderate for starts in June–October, consistent with (monthly) values in Fig. 6 and Supplementary Fig. S2. However, they fell to near-zero over the following seasons. For starts earlier in the year, there was a little improvement on the weak skill of persistence following the boreal spring.
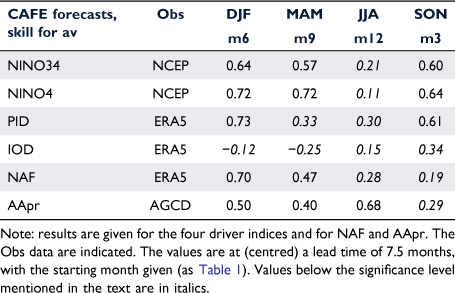
Indicative r values for the skill of these forecasts for the seasonal means of the SST drivers, alongside those for other quantities, are given in Table 2. The values were limited to those for the usual seasons at a lead time of 6 months to the start of the season. The correlations for the Pacific drivers were good in three seasons, with r = 0.73 for PID in DJF, after the June start.
|
4.2 Atmospheric variables
Turning to other variables, it is informative to see the maps of correlations at grid points between the ensemble average forecast values and ERA5 reanalyses. As for SST in Fig. 6, monthly means were used, with results for tas and rainfall from June starts shown in Fig. 8. The correlations for temperature over the low-latitude central Pacific were similar to those for SST (Supplementary Fig. S2) and positive for all 10 months shown. Values elsewhere differred, and the air temperature was not as closely tied to SST in the PID and IOD regions. The correlations for rainfall in the tropics tended to be of the sign of the SST values, as too the r for air temperature. Over land, the correlations for both variables were moderate, particularly over Australia in October–February. As seen in Fig. 4, temperature anomalies over Australia tended to have the opposite sign to those of rainfall. Variability in local monthly mean rainfall unrelated to the drivers was evidently limiting the correlation, and investigation with a larger ensemble is warranted. Further results here are for seasonal and spatial means.

|
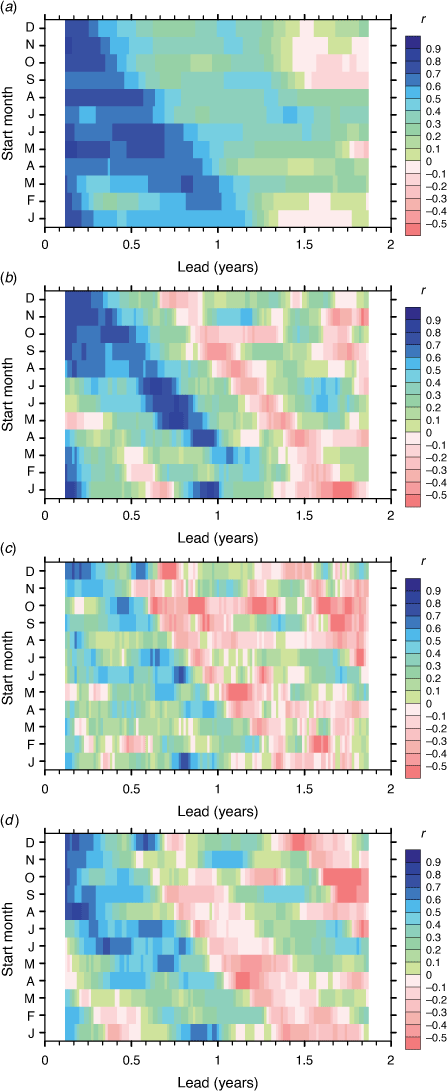
The plots of correlations between ensemble averages and Obs data for four quantities are shown in Fig. 9. Starting with PID (Fig. 9a), for which selected values were given in Table 2, r was always positive for lead times to 16 months or more. The values were moderate to good initially and in the band for target seasons centred on October–February. Consistent with the link between NA meridional flux and the SST drivers, including PID (Table 1), there were moderate correlations for NAF, between the simulations and ERA5 in some seasons. The patterns of the skill of PID and that of NAF across the start–lead times were similar. Selected values are given in Table 2. The strong link between PID and NAF for MAM after the September start allowed for similar, although barely moderate, skill for both at that time. The highest r for NAF at lead 7–9 months after starts in May–July was partly consistent with a PID influence. It is worthwhile noting that the correlations for NAF in Fig. 9b were mostly improved on those obtained from using the ERA-Interim reanalyses for the Obs data. The increase in r, averaged over all starts and to lead 1 year, was 0.04. This is likely because NAF in ERA5 is more accurate than that in ERA-Interim.
|
Before addressing rainfall, it is interesting to consider the forecast of the convergence of the moisture flux vector field, which provides moisture for precipitation through the atmospheric moisture budget equation. As for NAF, forecasts of convergence have not been typically assessed. The result for the All-Australia average convergence, compared to ERA5, is shown in Fig. 9c. The pattern largely resembled that for NAF, although with generally smaller values. Of course, fluxes into and out of Australia from other directions are important. These may result from NAF moisture passing through Australia, possibly after recycling of moisture in the land surface (e.g. Holgate et al. 2020). Further, the accuracy of the CAFE convergence series may be affected by the use of daily data in calculating flux.
The correlations between the simulated running seasonal AApr and the corresponding AGCD series are shown in Fig. 9d. The pattern was like that of convergence but, encouragingly, with mostly higher r. Values were at least moderate in three of the seasons given in Table 2. Aside from the unexpectedly good JJA value for the December start, which coincides with one for convergence (Fig. 9c), the pattern was consistent with that in PID and other Pacific drivers (Table 2). The link between the drivers and AApr in DJF was only weak for the start in June and for the full period of ERA5 (Table 1). The skill in DJF for AApr and NAF in this case is possibly due to drivers not well represented by these indices. Based on the link between IOD and AApr in SON, the poor skill for SON with 6 months lead was partly consistent with that in IOD.
In summary, there appears to be moderate to good skill in the forecasts of the SST drivers, rainfall, and NAF for seasons centred on September–February after starts from June onwards. There appears to be some skill from all starts through to about the season centred on April (MAM), so for beyond a year after February–March starts.
5 Potential skill in multi-year forecasts
While these CAFE forecast simulations are from only a limited number of years, the positive correlations for the comparison with observations for the Pacific SST driver indices, including PID, suggest that there is potentially skill in the forecasts well into the second year. There is a similar pattern to the correlations for AApr, with moderate correlations for running seasons centred on September–April. These months tend to have heavier rainfall over much of Australia and larger interannual variability than the other 4 months, which increases the potential for forecasts of AApr averaged over a whole year.
Consider again the links between drivers and rainfall for annual means. The regression fields shown in Fig. 4 illustrate the teleconnection from a NINO4 anomaly. The CAFE model produced similar patterns, with lower rainfall over most of the continent for a positive NINO4. The correlation for annual AApr was noted in Section 3.1. The annual results for other drivers, in Table 1, were also similar, with only limited difference for Obs in the years of the forecasts.
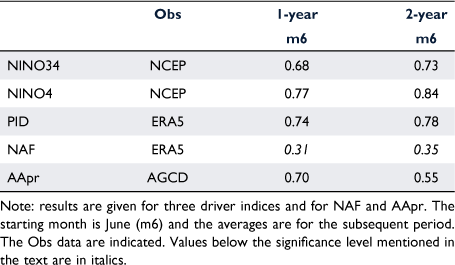
To quantify the links in the forecasts, a running mean of 73 pentads (365 days) of the 2-year time series from each simulation was taken and correlations calculated. The links between the drivers and AApr are given in Table 1 for the year after the start, for starting months January and June, and both all runs and the ensemble averages. The results for the all-run, January start (the usual January–December average) were quite similar to those from the control run and Obs, except that the IOD link was stronger (as it is in MAM). The correlations were stronger again for all the Av cases. The same holds for the June starts, with values a little lower than for January. The links between PID and NAF were similarly strong. Southward flux was highly correlated with AApr, with rav over 0.9 for both starts.
For brevity, the start-lead plots of comparisons with observations are limited to PID and AApr. The plot of r for ensemble average PID is shown in Fig. 10a. The largest r was 0.77 for the first value (centred mid-year) from the May start. The first value for June, given in Table 3, was nearly as large. Values over 0.6 held for leads of up to 6 months (before the start of the 365-day period) from most starts, especially May–June. In these cases, the correlations for AApr, Fig. 10b, were also initially good (at least 0.6), with a peak of 0.7. The patterns resemble a smoothed version of the seasonal results (Fig. 9a, d). There was a little skill for a second year, especially for PID. The initial values for the June start were given for NINO34 and NINO4 (Table 3), with similar r to PID. The r for NAF was lower, consistent with the small values in two seasons. Of course, this flux is only one component of the moisture budget for rainfall.
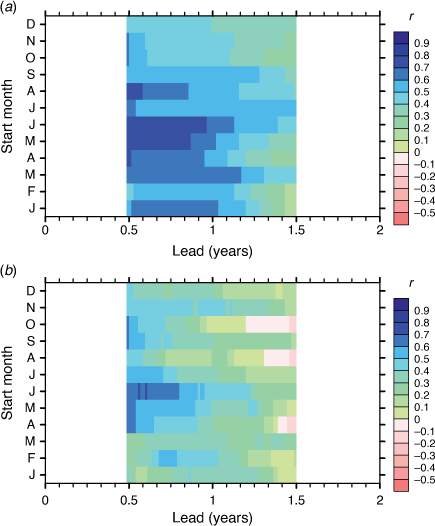
|
|
Averaging over the whole of the 2-year runs allowed only a single r value for each variable, given in Table 3. They were quite similar to the 1-year results, even reaching 0.84 for NINO4. Much of the skill, especially for AApr, was evidently due to the first year. While the skill for annual mean AApr was broadly consistent with the links with the annual mean drivers, it may also have resulted from the model simulating influences that vary with the season. The smaller r for annual NAF and smaller link of that in DJF with the drivers hint at this. Nevertheless, the results encourage the search for influences of larger scale drivers, in time and space, and possibly including PID, which may be partly predictable.
6 Conclusions
This study extends the analysis by O’Kane et al. (2020) of the ensemble forecasts of the NINO4 index in 2002–2017 from the CAFE modelling system to four Indo-Pacific SST drivers and to Australian rainfall. It is first demonstrated, using simple regression that, on the broad scale, the teleconnection pattern for interannual variability of NINO4 in a 100-year simulation of the CAFE coupled model was similar to that in ERA5 reanalyses. The correlations between NINO4, NINO34, IOD and the PID SST indices and AApr, for both seasonal and annual means, were mostly similar also. The flux of moisture towards northern Australia, using the average over a box of the meridional component as the index NAF, was linked to both the SSTs and AApr. Further, using the 11-member ensemble averages of the forecast simulations increased the correlations for various links. For example, for annual means with lead time of 6 months after forecasts starting on 1 January, PID correlated at 0.76 with NAF and at −0.75 with AApr across the 14 year cases, up from 0.68 to −0.60 for the 154 individual runs.
Correlations of forecast ensemble averages with observations across the 2002–2015 cases were used as a measure of skill, calculated for each start month and each time after start. Due to the assimulation of ocean data, initially the SSTs at grid points from forecasts were well correlated with those from ERA5, especially across the tropical Indo-Pacific. Positive correlations held over the coming year for much of the low-latitude Pacific and for the drivers NINO34, NINO4, and PID. The decline for these was more rapid during boreal spring after starts in December–April than it was for the persistence of first-month values. However, the forecasts were subsequently more skillful than persistence, with r averaging 0.3 higher for PID over months 7–13.
The skill of forecast rainfall at Australian grid points was limited, but seasonal AApr had moderate to good correlations (r 0.4–0.8) compared to AGCD for seasons centred on September–February with starts from June onwards. This was largely consistent with skill in the NAF and in the SST anomalies that contributed to driving anomalies in both flux and AApr. Correlations were also good for 1-year running averages after starts in May and June. There appeared to be some skill in AApr and the drivers for averages over the whole of the 2-year simulations. This seems compatible with the fraction of the 2018–2019 AApr deficit that Watterson (2020) related to the anomaly in the PID driver index. Forecasts with these later years, as well as a longer hindcast set, should be examined. A further and larger suite of CAFE forecasts, developed in conjunction with the new CAFE60 reanalyses described by O’Kane et al. (2021) and now contributing to the WMOLC, will allow this.
Data availability
Datasets for this research are available as follows. For ERA5, Copernicus Climate Change Service (C3S, 2017), is downloadable, after registration, from https://cds.climate.copernicus.eu/cdsapp#!/dataset/reanalysis-era5-single-levels-monthly-means. For AGCD, the All-Australia monthly rainfall series is from http://www.bom.gov.au/climate/change (selecting Rainfall-Total, Australia, all months). For the NCEP NINO34 series, see https://www.cpc.ncep.noaa.gov/data/indices (Monthly ERSSTv5). Calculations and plotting were largely performed using the NCL software (NCAR Command Language, NCAR, Boulder, Colorado) and CDO (Climate Data Operators), (see https://code.mpimet.mpg.de/projects/cdo).
Conflicts of interest
The authors declare no conflicts of interest.
Declaration of funding
This research did not receive any specific funding.
Supplementary material
Supplementary material is available online.
Acknowledgements
The authors were supported by the Australian CSIRO DCFP (https://research.csiro.au/dfp). We gratefully acknowledge discussions and advice from team members, including Richard Matear, Dougie Squire, James Risbey, and Mark Collier.
References
Barnston AG, Tippett MK, Ranganathan M, L’Heureux ML (2019) Deterministic skill of ENSO predictions from the North American multimodel ensemble. Climate Dynamics 53, 7215–7234.| Deterministic skill of ENSO predictions from the North American multimodel ensemble.Crossref | GoogleScholarGoogle Scholar | 31929685PubMed |
Bi D, Dix M, Marsland S, O’Farrell S, Sullivan A, Bodman R, Law R, Harman I, Srbinovsky J, Rashid HA, Dobrohotoff P, Mackallah C, Yan H, Hirst A, Savita A, Boeira Dias F, Woodhouse M, Fiedler R, Heerdegen A (2020) Configuration and spin-up of ACCESS-CM2, the new generation Australian community climate and Earth system simulator coupled model. Journal of Southern Hemisphere Earth Systems Science 70, 225–251.
| Configuration and spin-up of ACCESS-CM2, the new generation Australian community climate and Earth system simulator coupled model.Crossref | GoogleScholarGoogle Scholar |
Cai W, Wu L, Lengaigne M, Li T, McGregor S, Kug J-S, Yu J-Y, Stuecker MF, Santoso A, Li X, Ham Y-G, Chikamoto Y, Ng B, McPhaden MJ, Du Y, Dommenget D, Jia F, Kajtar JB, Keenlyside N, Lin X, Luo J-J, Martín-Rey M, Ruprich-Robert Y, Wang G, Xie S-P, Yang Y, Kang SM, Choi J-Y, Gan B, Kim G-I, Kim C-E, Kim S, Kim J-H, Chang P (2019) Pantropical climate interactions. Science 363, eaav4236
| Pantropical climate interactions.Crossref | GoogleScholarGoogle Scholar | 30819937PubMed |
Christiansen B (2019) Analysis of ensemble mean forecasts: the blessings of high dimensionality. Monthly Weather Review 147, 1699–1712.
| Analysis of ensemble mean forecasts: the blessings of high dimensionality.Crossref | GoogleScholarGoogle Scholar |
Copernicus Climate Change Service (C3S) (2017) ERA5: fifth generation of ECMWF atmospheric reanalyses of the global climate. Copernicus climate change service climate data store (CDS). Available at https://cds.climate.copernicus.eu/cdsapp#!/home
Delworth TL, Broccoli AJ, Rosati A, Stouffer RJ, Balaji V, Beesley JA, Cooke WF, Dixon KW, Dunne J, Dunne KA, Durachta JW, Findell KL, Ginoux P, Gnanadesikan A, Gordon CT, Griffies SM, Gudgel R, Harrison MJ, Held IM, Hemler RS, Horowitz LW, Klein SA, Knutson TR, Kushner PJ, Langenhorst AR, Lee H-C, Lin S-J, Lu J, Malyshev SL, Milly PCD, Ramaswamy V, Russell J, Schwarzkopf MD, Shevliakova E, Sirutis JR, Spelman MJ, Stern WF, Winton M, Wittenberg AT, Wyman B, Zeng F, Zhang R (2006) GFDL’s CM2 global coupled climate models. Part I: formulation and simulation characteristics. Journal of Climate 19, 643–674.
| GFDL’s CM2 global coupled climate models. Part I: formulation and simulation characteristics.Crossref | GoogleScholarGoogle Scholar |
Dey R, Lewis SC, Arblaster JM, Abram NJ (2019) A review of past and projected changes in Australia’s rainfall. Wiley Interdisciplinary Reviews: Climate Change 10, e577
| A review of past and projected changes in Australia’s rainfall.Crossref | GoogleScholarGoogle Scholar |
Evans A, Jones D, Smalley R, Lellyett S (2020) An enhanced gridded rainfall analysis scheme for Australia. Bureau Research Report 41. Australian Bureau of Meteorology, p. 45.
Frederiksen CS, Grainger S, Zheng X (2018) Potential predictability of Australian seasonal rainfall. Journal of Southern Hemisphere Earth Systems Science 68, 65–100.
| Potential predictability of Australian seasonal rainfall.Crossref | GoogleScholarGoogle Scholar |
Gu G, Adler RF (2019) Precipitation, temperature, moisture transport variations associated with two distinct ENSO flavors during 1979–2014. Climate Dynamics 52, 7249–7265.
| Precipitation, temperature, moisture transport variations associated with two distinct ENSO flavors during 1979–2014.Crossref | GoogleScholarGoogle Scholar |
Hauser S, Grams CM, Reeder MJ, McGregor S, Fink AH, Quinting JF (2020) A weather system perspective on winter–spring rainfall variability in southeastern Australia during El Niño. Quarterly Journal of the Royal Meteorological Society 146, 2614–2633.
| A weather system perspective on winter–spring rainfall variability in southeastern Australia during El Niño.Crossref | GoogleScholarGoogle Scholar |
Hersbach H, Bell B, Berrisford P, et al. (2020) The ERA5 global reanalysis. Quarterly Journal of the Royal Meteorological Society 146, 1999–2049.
| The ERA5 global reanalysis.Crossref | GoogleScholarGoogle Scholar |
Holgate CM, Evans JP, van Dijk AIJM, Pitman AJ, Di Virgilio G (2020) Australian precipitation recycling and evaporative source regions. Journal of Climate 33, 8721–8735.
| Australian precipitation recycling and evaporative source regions.Crossref | GoogleScholarGoogle Scholar |
Hudson D, Alves O, Hendon HH, Lim E-P, Liu G, Luo J-J, MacLachlan C, Marshall AG, Shi L, Wang G, Wedd R, Young G, Zhao M, Zhou X (2017) ACCESS-S1: The new Bureau of Meteorology multi-week to seasonal prediction system. Journal of Southern Hemisphere Earth Systems Science 67, 132–159.
| ACCESS-S1: The new Bureau of Meteorology multi-week to seasonal prediction system.Crossref | GoogleScholarGoogle Scholar |
King AD, Hudson D, Lim E-P, Marshall AG, Hendon HH, Lane TP, Alves O (2020) Sub-seasonal to seasonal prediction of rainfall extremes in Australia. Quarterly Journal of the Royal Meteorological Society 146, 2228–2249.
| Sub-seasonal to seasonal prediction of rainfall extremes in Australia.Crossref | GoogleScholarGoogle Scholar |
Klingaman NP, Woolnough SJ, Syktus J (2013) On the drivers of inter-annual and decadal rainfall variability in Queensland, Australia. International Journal of Climatology 33, 2413–2430.
| On the drivers of inter-annual and decadal rainfall variability in Queensland, Australia.Crossref | GoogleScholarGoogle Scholar |
Lai AW-C, Herzog M, Graf H-F (2018) ENSO Forecasts near the spring predictability barrier and possible reasons for the recently reduced predictability. Journal of Climate 31, 815–838.
| ENSO Forecasts near the spring predictability barrier and possible reasons for the recently reduced predictability.Crossref | GoogleScholarGoogle Scholar |
Mahlstein I, Bhend J, Spirig C, Martius O (2019) Developing an automated medium-range flood awareness system for switzerland based on probabilistic forecasts of integrated water vapor fluxes. Weather and Forecasting 34, 1759–1776.
| Developing an automated medium-range flood awareness system for switzerland based on probabilistic forecasts of integrated water vapor fluxes.Crossref | GoogleScholarGoogle Scholar |
Marshall AJ (2019) Variation in growing season water balance in central Victoria, Australia, in relation to large-scale climate drivers. Journal of Southern Hemisphere Earth Systems Science 69, 131–145.
| Variation in growing season water balance in central Victoria, Australia, in relation to large-scale climate drivers.Crossref | GoogleScholarGoogle Scholar |
Marshall AG, Hendon HH (2019) Multi-week prediction of the Madden–Julian oscillation with ACCESS-S1. Climate Dynamics 52, 2513–2528.
| Multi-week prediction of the Madden–Julian oscillation with ACCESS-S1.Crossref | GoogleScholarGoogle Scholar |
O’Kane TJ, Sandery PA, Monselesan DP, Sakov P, Chamberlain MA, Matear RJ, Collier MA, Squire DT, Stevens L (2019) Coupled data assimilation and ensemble initialization with application to multiyear ENSO prediction. Journal of Climate 32, 997–1024.
| Coupled data assimilation and ensemble initialization with application to multiyear ENSO prediction.Crossref | GoogleScholarGoogle Scholar |
O’Kane TJ, Squire DT, Sandery PA, Kitsios V, Matear RJ, Moore TS, Risbey JS, Watterson IG (2020) Enhanced ENSO prediction via augmentation of multi-model ensembles with initial thermocline perturbations. Journal of Climate 33, 2281–2293.
| Enhanced ENSO prediction via augmentation of multi-model ensembles with initial thermocline perturbations.Crossref | GoogleScholarGoogle Scholar |
O’Kane TJ, Sandery PA, Kitsios V, Sakov P, Chamberlain MA, Collier MA, Fiedler R, Moore TS, Chapman CC, Sloyan BM, Matear RJ (2021) CAFE60v1: a 60-year large ensemble climate reanalysis. Part I: system design, model configuration and data assimilation. Journal of Climate 34, 5153–5169.
| CAFE60v1: a 60-year large ensemble climate reanalysis. Part I: system design, model configuration and data assimilation.Crossref | GoogleScholarGoogle Scholar |
Power S, Haylock M, Colman R, Wang X (2006) The predictability of interdecadal changes in ENSO activity and ENSO teleconnections. Journal of Climate 19, 4755–4771.
| The predictability of interdecadal changes in ENSO activity and ENSO teleconnections.Crossref | GoogleScholarGoogle Scholar |
Reynolds RW, Rayner NA, Smith TM, Stokes DC, Wang W (2002) An improved in situ and satellite SST analysis for climate. Journal of Climate 15, 1609–1625.
| An improved in situ and satellite SST analysis for climate.Crossref | GoogleScholarGoogle Scholar |
Smith I (2004) An assessment of recent trends in Australian rainfall. Australian Meteorological Magazine 53, 163–173.
Taminiau C, Haarsma RJ (2007) Projected changes in precipitation and the occurrence of severe rainfall deficits in central Australia caused by global warming. Australian Meteorological Magazine 56, 167–175.
Van Rensch P, Arblaster J, Gallant AJE, Cai W, Nicholls N, Durack PJ (2019) Mechanisms causing east Australian spring rainfall differences between three strong El Niño events. Climate Dynamics 53, 3641–3659.
| Mechanisms causing east Australian spring rainfall differences between three strong El Niño events.Crossref | GoogleScholarGoogle Scholar |
Watterson IG (2020) Australian rainfall anomalies in 2018-2019 linked to indo-pacific driver indices using ERA5 reanalyses. Journal of Geophysical Research 125, e2020JD033041
| Australian rainfall anomalies in 2018-2019 linked to indo-pacific driver indices using ERA5 reanalyses.Crossref | GoogleScholarGoogle Scholar |
Watterson IG, Keane RJ, Dix M, Ziehn T, Andrews T, Tang Y (2021) Analysis of CMIP6 atmospheric moisture fluxes and the implications for projections of future change in mean and heavy rainfall. International Journal of Climatology 41, E1417–E1434.
| Analysis of CMIP6 atmospheric moisture fluxes and the implications for projections of future change in mean and heavy rainfall.Crossref | GoogleScholarGoogle Scholar |
Wittenberg AT, Rosati A, Delworth TL, Vecchi GA, Zheng F (2014) ENSO modulation: is it decadally predictable. Journal of Climate 27, 2667–2681.
| ENSO modulation: is it decadally predictable.Crossref | GoogleScholarGoogle Scholar |
Ye C, Zhang H, Moise A, Mo R (2020) Atmospheric rivers in the Australia-Asian region: a BoM-CMA collaborative study. Journal of Southern Hemisphere Earth Systems Science 70, 3–16.
| Atmospheric rivers in the Australia-Asian region: a BoM-CMA collaborative study.Crossref | GoogleScholarGoogle Scholar |
Zhang W, Villarini G, Vecchi GA (2019) Impacts of the Pacific meridional mode on rainfall over the maritime continent and Australia: potential for seasonal predictions. Climate Dynamics 53, 7185–7199.
| Impacts of the Pacific meridional mode on rainfall over the maritime continent and Australia: potential for seasonal predictions.Crossref | GoogleScholarGoogle Scholar |
Zhao S, Li J, Li Y, Jin F-F, Zheng J (2019) Interhemispheric influence of Indo-Pacific convection oscillation on Southern Hemisphere rainfall through southward propagation of Rossby waves. Climate Dynamics 52, 3203–3221.
| Interhemispheric influence of Indo-Pacific convection oscillation on Southern Hemisphere rainfall through southward propagation of Rossby waves.Crossref | GoogleScholarGoogle Scholar |