
Green Sahara influence on South Atlantic dynamics: insights from NASA GISS simulations
Ilana Wainer A * , Allegra N. LeGrande B C , Michael Griffiths D , Luciana F. Prado E and Paulo Silva A
A
B
C
D
E
Abstract
The Mid-Holocene experiment is a well known paleoclimate simulation, typically represented by greenhouse gases (GHG) and orbital forcings. In this study we examine how including other Earth-system components in mid-Holocene simulations, such as the vegetated Green Sahara and expansive African mega-lakes, modulate the South Atlantic’s dynamics. Addressing a gap in understanding the relationship between terrestrial and oceanic systems, we investigate how these additional features influence sea surface temperatures, salinity, circulation patterns and atmospheric dynamics in the South Atlantic. Employing NASA GISS E21-G global climate model experiments, the study compares these effects to a standard mid-Holocene scenario using only GHG and orbital forcing. Key findings include a decrease in sea surface temperatures and salinity due to increased freshwater input originating from enhanced precipitation and African mega-lakes. This leads to a weakened South Atlantic Meridional Overturning Circulation. Winds are modified in response to changes in Green Sahara vegetation and the addition of mega-lakes, which alter the pressure distribution. These findings underscore the influential role of terrestrial changes on the South Atlantic’s climate, contributing to our understanding of global climate impacts and the potential implications of environmental changes on marine and atmospheric systems.
Keywords: African mega-lakes, climate change, Green Sahara, Mid-Holocene, ocean–atmosphere interactions, paleoclimate, South Atlantic circulation.
1.Introduction
The Mid-Holocene (MH), a period marked by enhanced seasonality and CO₂ concentrations near pre-industrial (PI) levels, provides a unique backdrop for understanding how changes in Saharan vegetation influenced both regional and remote climates. This period, known as the Green Sahara (GS), spans approximately from 11,000 to 5000 years before present and was characterised by increased boreal summer insolation that intensified the monsoon system over the Sahara region (Demenocal et al. 2000).
Owing to increased precipitation in Northern Africa during the GS, it is also known as the African Humid Period (Claussen et al. 2017). As a consequence of a stronger West African Monsoon System, there is evidence in paleorecords of vegetation expansion (Tierney et al. 2017) and increase in lake area and levels in Northern Africa (Contoux et al. 2013), resulting in mega-lakes (Krinner et al. 2012; Quade et al. 2018; Specht et al. 2022).
Some climate impacts during the GS period were investigated by previous studies. In Krinner et al. (2012), the effects of dynamic vegetation reinforced the precipitation response in African climate to the prescribed lakes. However, in Specht et al. (2022) vegetation was prescribed and thus changes in precipitation regime were attributed to background and evaporation feedback. They concluded that the location of the prescribed lakes may play a major role in the northward expansion of the African summer monsoon during the GS. The presence of the lakes during the MH in Northern Africa may also have resulted in increased moisture availability, with impacts on the length of the rainy season. According to Specht et al. (2022), the length of the wet season almost doubles in maximum-lake extent and wetland simulations, related to changes in atmospheric circulation. Skinner and Poulsen (2016) found that evaporation cooling results in descending motion over the lakes and ascending motion over the vicinities, showing that the latitudinal position of the lakes is a major issue. Nevertheless, these studies did not address impacts of the lakes on South American climate, nor on the Atlantic Ocean.
Tiwari et al. (2023) examined how greening Saharan vegetation during the MH influenced precipitation patterns over Africa and South America using four fully coupled general circulation models. Their results showed enhanced precipitation over Northern Africa and greater drying over South America in GS simulations. These findings strongly suggest the GS’s capacity to affect remote hydroclimates. However, their study did not explore oceanic impacts.
Given the strong ocean–atmosphere coupling in the South Atlantic, it would be valuable to investigate if the GS could have potentially influenced ocean circulation coupled to surface variables in this sector. In particular, the south-west Atlantic Ocean is characterised by complex circulation patterns coupled to the atmosphere (Wainer and Venegas 2002; Combes and Matano 2014). The key oceanographic features defining its boundaries include the Brazil Current, a warm western boundary southward-flowing current and the northward-flowing Malvinas Current, which meet at ~40°S (Gordon 1989).
The fact that the GS affects precipitation patterns as far away as South America highlights the interconnected nature of our global climate system. Such findings suggest that climatic alterations in one region, like the Sahara, can reach across vast distances, influencing weather and climate in seemingly unrelated areas (Tiwari et al. 2023; Gaetani et al. 2024). Given this context, the South Atlantic Ocean, which can have a significant role in regulating climate and weather patterns for both Africa and South America, emerges as a region of interest.
The South Atlantic Ocean has a profound impact on the climate and weather patterns of both South American and African countries (Haile 2005; Rodrigues et al. 2020). This oceanic region drives extreme weather events such as heatwaves, droughts and floods that can lead to food and water insecurity for millions of individuals across these continents.
One of the mechanisms through which the South Atlantic influences climate is by modulating rainfall variability. There are links between the South Atlantic Subtropical Dipole and rainfall in north-east Brazil (Wainer et al. 2021), as well as with Western (Nnamchi and Li 2011) and Central African (Nana et al. 2023) rainfall variability. Moreover, research has shown that the South Atlantic plays a crucial role in the climate of adjacent continental areas, both through the decadal variability of the sea surface temperature (SST) modes (Gorenstein et al. 2023) and through its active contribution to the Atlantic Meridional Overturning Circulation (AMOC) (Marcello et al. 2018). The AMOC is a critical component in modulating the world’s climate, and the interactions between the Atlantic, Pacific and Indian Ocean Basins, mainly through the tropics at seasonal to multidecadal scales, are vital for improving our ability to predict the planet’s weather and climate (Marcello et al. 2023).
Understanding the South Atlantic’s characteristics is important because it can play a significant role in the establishment of oceanic teleconnections and influences the AMOC water mass structure (Garzoli and Matano 2011).
This study aims to clarify the effect of prescribed vegetation in West Africa and prescribed African (mega) lakes during the MH on the South Atlantic oceanic circulation. Through the analysis of four separate simulations using the NASA-GISS-E2.1-G model, we seek to discern the atmospheric and oceanic responses to varying land surface conditions in Africa and their influence on South Atlantic circulation.
2.Data and analysis
In order to investigate terrestrial effects on the South Atlantic Circulation, we analyse the simulation results of the NASA GISS-E2.1-G model (Kelley et al. 2020) experiments described in Table 1.
| Experiments | Abbreviation | |
|---|---|---|
| PiControl | PI | |
| Mid-Holocene PMIP4 protocols | 6K | |
| 6K + Prescribed VEG | GS | |
| 6K + GS + LAKES | LAKES |
From top to bottom: pre-industrial control simulation; mid-Holocene simulation run with PMIP4 protocols. Mid-Holocene simulation with prescribed vegetation over West Africa and a simulation with contribution from lakes and wetlands (open-water surfaces).
The NASA GISS-E2.1-G model comprises an atmospheric component, specifically the Goddard Institute for Space Studies Model E2.1, and an oceanic component (GISS Ocean Model v1). The atmospheric grid of the GISS-E2.1-G model is structured at a resolution of 2 × 2.5° with 40 vertical levels, whereas the oceanic grid is designed at a resolution of 1 × 1.25° with 40 vertical levels. For the MH simulations, the model follows the simulation protocols set forth by the Coupled Model Intercomparison Project Phase 6 (CMIP6) and the Paleoclimate Modelling Intercomparison Project Phase 4 (PMIP4). The standard PMIP simulation uses greenhouse gases (GHG) and orbital forcings only. These protocols ensure the consistency and comparability of simulation results across different models and studies. In the specific simulation concerning the MH with prescribed GS conditions, additional feedbacks have been incorporated to account for vegetation changes.
The choice of the NASA GISS-E2.1-G model for this study is based on two factors. Firstly, its performance in simulating MH hydroclimate and ocean–atmosphere interactions has already been validated and compared in earlier works (Tiwari et al. 2023, 2024). This prior study utilised the same GISS-E2.1-G model for MH and pre-PI control simulations, which are used here as well. However, their study did not include simulations with African mega-lakes, which is a key focus of this work. Secondly, the model choice is motivated by the well-documented transformation of the Sahara during the MH. Increased rainfall during this period transformed the once dry and arid region into a landscape with extensive wetlands, rivers and lakes. This transition is further supported by the presence of mega-lakes, as evidenced by paleo-lake sediment studies (e.g. Krinner et al. 2012; Specht et al. 2022; Li et al. 2023). The GISS-E2.1-G model LAKES simulations explore these changes, highlighting the significant impact of increased precipitation on the landscape. The fractions of lakes used in the simulations are shown in Supplementary Fig. S1. The lake fraction maps shown were derived from the work of Chandan and Peltier (2020). These were determined by focusing on the large lakes in northern Africa, including extant lakes such as Lake Chad that were significantly larger during the MH.
This approach utilised well-constrained reconstructions of the locations and extents of these lakes, allowing the authors to prescribe specific sources of moisture.
The initial analysis aimed to compare the annual mean fields from various experiments to those from a PI control run, using simple difference calculations. This included a side-by-side comparison of three MH experiment setups: the standard MH setup following the PMIP protocols (referred as 6K), one with prescribed vegetation (referred to as GS), and a novel MH setup that combined prescribed vegetation with expansive African mega-lakes (named LAKES). The PI simulations were initialised at year 2000 and run for 1000 years, with the final 100 years used for analysis. The 6K simulations were run for 1300 years. Subsequently, two additional 200-year extensions were performed: first to incorporate vegetation effects, and then to add lakes. For each extension, the final 100 years were used for analysis. All climatological analyses were based on the last 100 years of their respective simulation periods.
The significance of observed differences between the PI and the 6K setups was determined by conducting a t-test at each grid point to assess whether the mean of one time series differed significantly from the other. Areas where differences were not significant at the 95% confidence level are indicated by stippling on the figures. For wind vector maps, the analysis is further refined by plotting vectors only where the difference was significant for at least one of the two components. Tiwari et al. (2023) also analyse the differences between some MH scenarios, confirming that these differences relative to PI are statistically significant.
3.Results
To better understand the changes in the South Atlantic dynamics relative to MH climate, this study examines both the mean state and the deviations relative to the PI control. Additionally, it investigates the impacts of the different PMIP4 MH runs, prescribed vegetation and the African mega-lakes. For all figures the top-left panel depicts the PI distribution as the baseline reference followed by the differences between PI and the MH scenarios (6K, GS and LAKES). Lastly, differences between GS and LAKES relative to 6K and each other are presented.
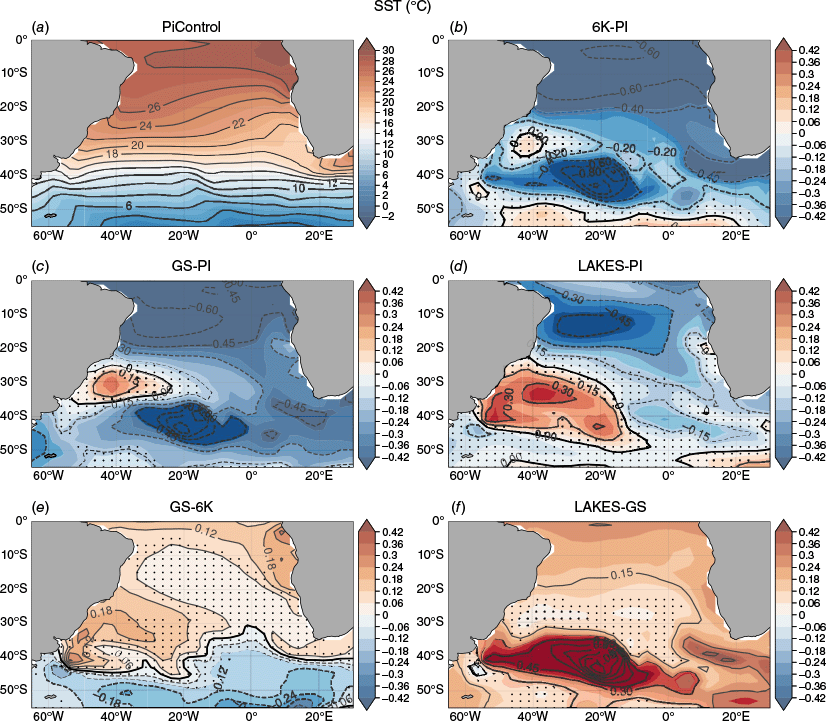
First, variations in SST within the simulation results are examined. These changes are illustrated in Fig. 1, which shows the SST and wind anomalies. Figure 2 further highlights the associated vertical structure of the temperature anomalies. The PI temperature profile (Fig. 2a) reveals a warm upper layer north of ~40°S, transitioning into cooler temperatures with depth, indicating a well-defined thermocline. In the three MH experiments (Fig. 1b–d), a general cooling trend is observed, primarily attributed to lower GHG levels compared to PI. However, an exception occurs near 30°S in the south-west Atlantic, where a warm water pool is evident. The intensity and extent of this anomaly vary between simulations. The 6K simulation (Fig. 1b) shows a coastal warm anomaly with peak deviations of 0.1–0.15°C that are not significant. In the GS simulation (Fig. 1c), the warm region expands, with peak differences of 0.15–0.25°C significant at 95%. The LAKES simulation (Fig. 1d) presents the most extensive warm area, stretching to 10°W and reaching temperature differences of up to 0.3°C also significant at 95%.
Simulated climatological mean sea surface temperature (SST) response (°C) for the South Atlantic: (a) present day (PI) and deviations from PI for (b) 6K (6K-PI), (c) GS (GS-PI) and (d) LAKES (LAKES-PI). Differences between Mid-Holocene scenarios are shown for (e) GS-6K and (f) LAKES-GS. Stippling indicates changes that are not significant at the 95% confidence level.
Zonally averaged, simulated climatological mean vertical temperature profiles (°C) for the south Atlantic: (a) present day (PI) and deviations from PI for (b) 6K (6K-PI), (c) GS (GS-PI) and (d) LAKES (LAKES-PI). Differences between Mid-Holocene scenarios are shown for (e) GS-6K and (f) LAKES-GS. Stippling indicates changes that are not significant at the 95% confidence level.
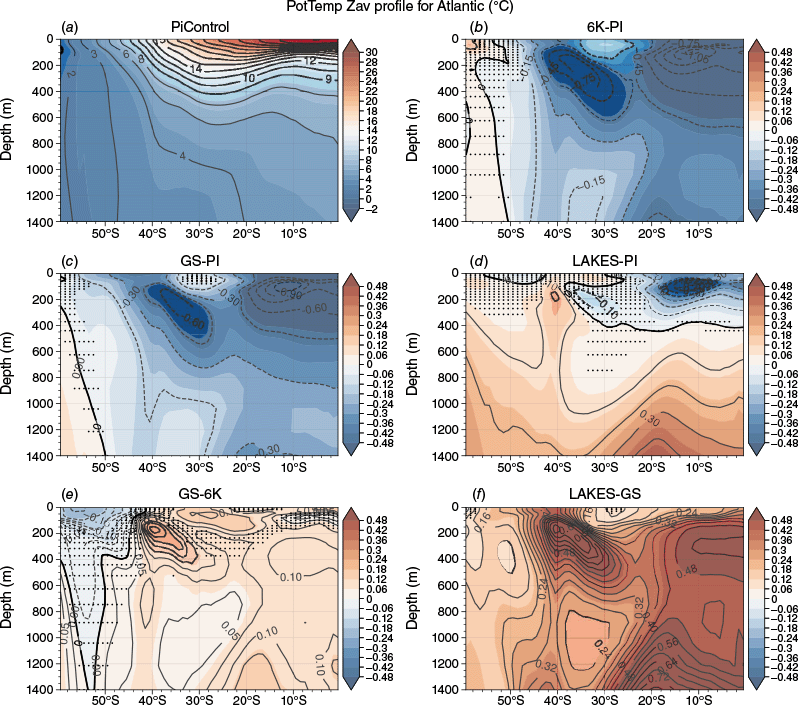
Figure 1e and f compares changes between GS-6K and LAKES-GS respectively. The prescribed vegetation in the GS experiment increases SSTs north of ~35°S, particularly off the African coast and in the Agulhas retroflection zone, with warming reaching 0.25°C. The LAKES experiment (Fig. 1f) shows amplified warming, with anomalies reaching 0.35–0.4°C. In this case, these effects are thought to occur through atmospheric circulation (Li et al. 2023), which will be discussed when examining surface pressure and wind changes.
Planktonic foraminiferal assemblages from marine sediments in the south-west Atlantic (Chapori et al. 2015) provide a proxy-based historical account of SST variations during the Holocene. In the Early Holocene, colder SSTs prevailed, with anomalies reaching −5°C due to increased influence of subpolar and polar waters. By the Mid–Late Holocene, SSTs approached modern values, indicating a greater presence of warm subtropical waters. Proxy records suggest average summer and winter SSTs of ~17 and ~12°C respectively. Consistent with these reconstructions, the model simulates a boreal summer SST anomaly of ~−0.6°C in the proxy core region, closely matching the proxy-based estimate of 0.5°C cooling during the early to mid-Holocene (Chapori et al. 2015). Together, these findings highlight the combined influence of subtropical and subpolar water masses and underscore the agreement between proxy evidence and model simulations.
The simulated zonally averaged vertical distribution of the South Atlantic temperatures can be seen in Fig. 2, which are somewhat consistent with the proxy data description, and shows that most changes are indeed within the upper subtropical warm waters. For the differences between MH experiments with respect to PI (Fig. 2b–d) it is clear that the temperatures were cooler in the upper layers of the tropical South Atlantic. South of ~50°S for the differences of 6K (Fig. 2b) and GS (Fig. 2c) with respect to PI, temperatures are warmer throughout the water column, up to 1500-m depth. However, for the difference between the LAKES and PI simulations (Fig. 2d), the cooling is confined to the upper 200 m north of ~30°S and at the surface at ~45°S.
The South Atlantic Central Water (SACW) is defined by high-salinity surface waters, primarily driven by evaporation and wind-driven circulation, and is most pronounced at lower latitudes (Fig. 3a). At ~600 m the Antarctic Intermediate Water (AAIW) is identified by a salinity minimum, a characteristic signature of its origin in the Southern Ocean and its subsequent northward flow into the Atlantic.
Zonally averaged, simulated climatological mean vertical salinity profiles for the South Atlantic: (a) present day (PI) and deviations from PI for (b) 6K (6K-PI), (c) GS (GS-PI) and (d) LAKES (LAKES-PI). Differences between Mid-Holocene scenarios are shown for (e) GS-6K and (f) LAKES-GS. Stippling indicates changes that are not significant at the 95% confidence level.
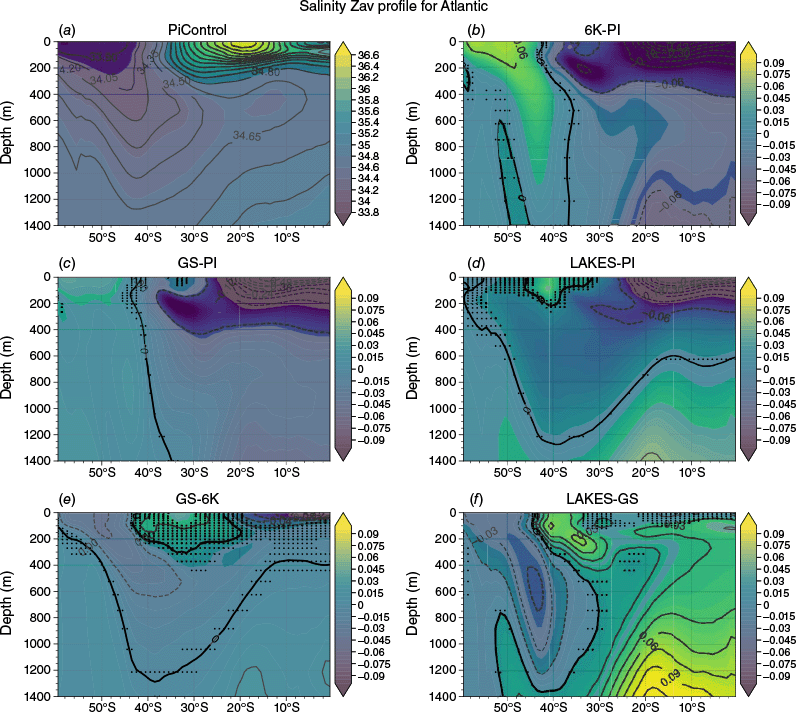
The salinity differences between the MH scenarios (6K, GS and LAKES) relative to PI (Fig. 3b–d) reveal notable changes. The SACW in the tropical upper layer shows significant freshening, likely caused by reduced evaporation or increased precipitation. Simultaneously, the AAIW’s salinity minimum appears altered, suggesting modifications in its formation or a shift in its extent. These changes imply that the AAIW’s influence on the thermocline and its interaction with the SACW were distinct during the MH, with potential consequences for the transport of heat and salt in the ocean. Enhanced freshwater influx and altered evaporation rates likely drove these changes. The precipitation–evaporation (P–E) distributions are shown in Supplementary Fig. S2. The enhanced precipitation, relative to PI in low latitudes (north of 20°S) can be seen, with maximum differences exceeding ~0.6–0.8 mm day–1. The greatest difference (~0.8 mm day–1) is for 6K relative to PI (Supplementary Fig. S2b).
Furthermore, variations in the depth and intensity of the salinity minimum indicate shifts in water mass formation, modification and advection. The differences in the GS and LAKES scenarios (Fig. 3e, f) highlight the impact of increased freshwater input, likely associated with paleo-lakes, explaining the observed salinity changes in the profiles.
In the context of understanding MH ocean–atmosphere dynamics, analysing sea level pressure (SLP) and accompanying wind systems is essential as it provides insights into atmospheric responses to variations in ocean temperatures. This analysis helps the understanding of mechanisms driving large-scale atmospheric circulation during this period.
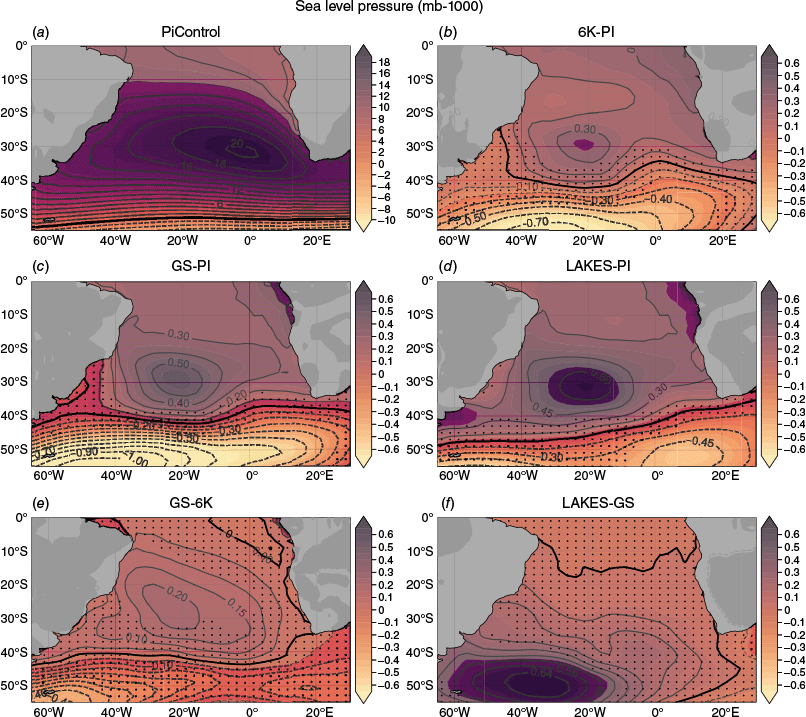
Figures 4a and 5a illustrate the PI mean SLP and surface wind patterns, highlighting higher pressures in the subtropical South Atlantic Ocean within 20–40°S, indicative of the South Atlantic High, and lower pressures near the equator associated with the Intertropical Convergence Zone. The zonal pressure gradient extends from South America to Africa, with south-east trade winds dominating the tropical South Atlantic and transitioning into westerlies at higher latitudes, consistent with the subtropical high-pressure system. Panels b–d in Fig. 4 and 5 show the sensitivity experiment differences (6K, GS and LAKES scenarios) relative to PI. Both the 6K-PI and GS-PI cases (Fig. 4b, c and 5b, c) reveal a westward and southward shift of the subtropical high north of 40°S and negative SLP anomalies southward across the South Atlantic. These shifts coincide with a clockwise wind anomaly in the south-west Atlantic and a weakened subtropical high-pressure system. Intensified westerlies at ~15°W contrast with their weakening eastward, while south-east trade winds are diminished, potentially influencing marine climates and coastal upwelling near south-western Africa. In the LAKES-PI scenario (Fig. 4d and 5d), the patterns are similar to those in the 6K-PI and GS-PI cases, showing enhanced SLP differences north of 40°S and weakened SLP southward, attributed to MH orbital forcing.
Simulated climatological mean SLP response (mb-1000) for the South Atlantic: (a) present day (PI) and deviations from PI for (b) 6K (6K-PI), (c) GS (GS-PI) and (d) LAKES (LAKES-PI). Differences between Mid-Holocene scenarios are shown for (e) GS-6K and (f) LAKES-GS. Stippling indicates changes that are not significant at the 95% confidence level.
Simulated climatological mean surface winds response (m s–1) for the South Atlantic: (a) present day (PI) and deviations from PI for (b) 6K; (c) GS; and (d) LAKES. Differences between Mid-Holocene scenarios are shown for (e) GS-6K and (f) LAKES-GS. Plotted are the vectors where the difference was significant at the 95% confidence level for at least one of the two components, zonal or meridional.
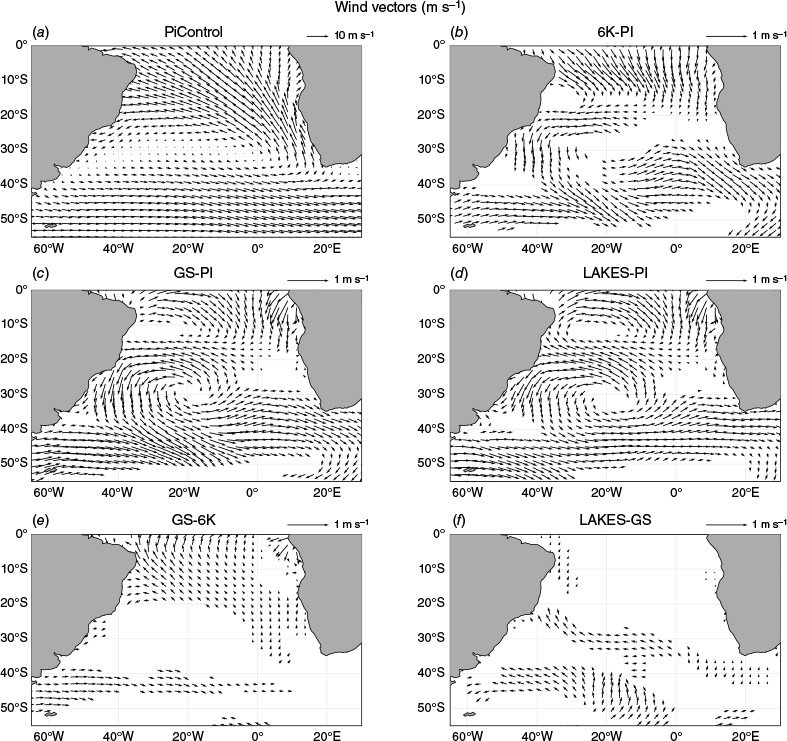
In contrast to the 6K-PI and GS-PI scenarios, the LAKES-PI difference (Fig. 4d and 5d) exhibits stronger positive SLP values north of 40°S, suggesting that presence of African mega-lakes could increase surface pressures compared to the PI baseline. The wind response mirrors the other MH scenarios, with increased westerlies up to~15°W and a reduction further east. The weakening of the south-east trade winds relative to PI is also similar.
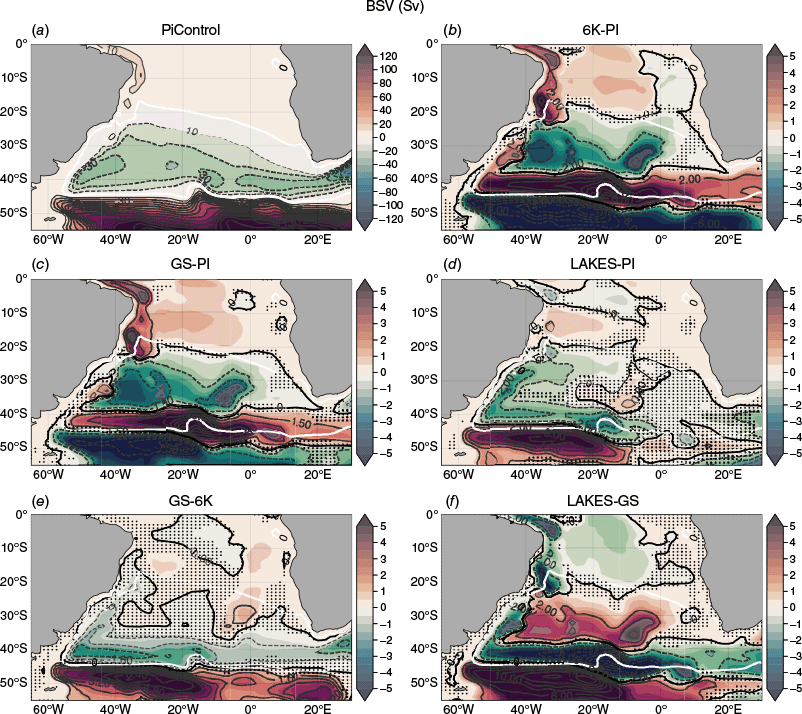
Changes in the barotropic stream function (BSF) are analysed to assess variations in ocean circulation strength and structure. The zero-BSF contour, which marks the boundary between positive (clockwise) and negative (counterclockwise) circulation cells, serves as a key indicator of these dynamics. The relative positions of the zero-BSF contour in the PI scenario and various MH scenarios are compared. Figure 6a illustrates the distribution of circulation patterns for PI, highlighting the subpolar and subtropical gyres. Figure 6b and c reveals negative anomalies north of the PI zero-BSF contour, approximately within 20–40°S, for the 6K and GS scenarios. These anomalies indicate a strengthening or expansion of the subtropical gyre relative to PI. Within 40–50°S, positive differences suggest a weakening or contraction of the subtropical gyre, whereas further south, the subpolar gyre shows weakening through additional positive anomalies. In Fig. 6d, the LAKES-PI differences indicate an enhancement of both the subtropical and subpolar gyres west of 0°W. A comparison between GS and 6K (Fig. 6e) suggests a stronger subtropical and subpolar gyre under GS conditions. Finally, Fig. 6f shows further intensification of these gyres in the LAKES scenario compared to GS.
4.Summary and discussion
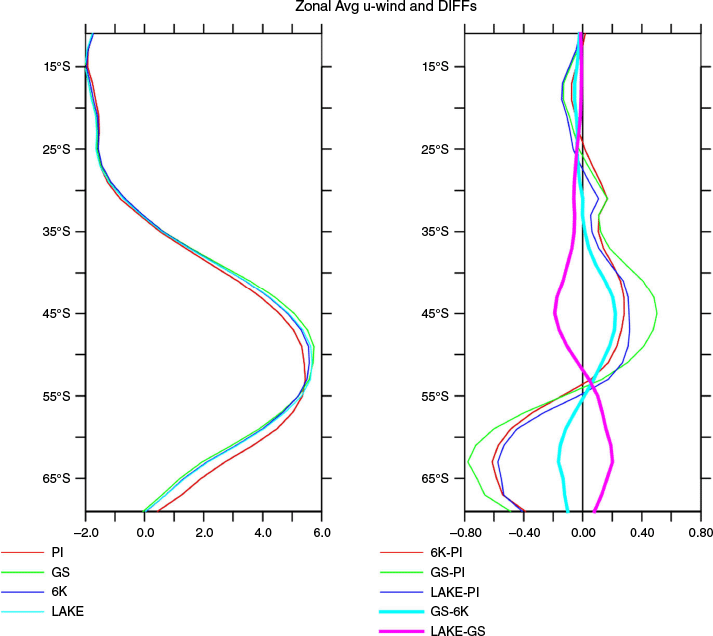
West African terrestrial vegetation and hydrology contributed to warming the South Atlantic Ocean surface during the MH. The SST variations in the MH simulations (Fig. 1) predominantly indicate a cooling trend relative to pre-industrial levels, except in the south-west Atlantic near the Brazil–Malvinas Confluence region, consistent with the findings of Zhang et al. (2021). However, simulations incorporating prescribed vegetation, both with and without expansive African mega-lakes (GS and LAKES), reveal more pronounced warm regions near the African coast and the Agulhas retroflection zone. These localised warming patterns are attributed to modified atmospheric processes driven by vegetation-enhanced hydrology and the presence of mega-lakes. The zonally averaged vertical temperature profiles provide additional understanding into these changes. Generalised cooling is observed down to 1400 m in the 6K and GS simulations, except south of ~50°S, where warming is detected. By contrast, the LAKES simulation shows warming throughout the water column, with cooling limited to the upper 400 m north of ~40°S. When comparing GS to 6K and LAKES to GS, both GS and LAKES scenarios contribute to regional warming, except south of ~50°S in the GS case, highlighting the possible impacts of terrestrial changes on vertical ocean temperature distributions. These temperature changes are accompanied by shifts in South Atlantic water masses, as evidenced by salinity data. The SACW exhibits freshening in the tropical upper layer, likely driven by increased precipitation and runoff resulting from vegetation-enhanced hydrology (Tiwari et al. 2023) and mega-lakes (Li et al. 2023). Additionally, changes in the spatial extent of the AAIW and SACW reflect altered water mass formation and advection, underscoring hydrological and oceanographic transformations during this period. Atmospheric circulation patterns further support these findings. A consistent reduction in SLP south of 30°S is observed across all MH experiments, indicating a weakening of the typical high-pressure system in the eastern South Atlantic. The LAKES scenario, however, shows elevated surface pressures compared to the PI baseline, suggesting that mega-lakes may have strengthened or shifted the subtropical high-pressure system. These SLP changes can be associated with intensified westerlies west of 30°W and weakened south-east trade winds along the African coastline. Figure 7 illustrates the latitude-specific changes in zonally averaged zonal wind components. Across all MH scenarios, westerlies intensify within 30–55°S (left panel), with the strongest westerlies observed in the GS simulation. Differences between GS and LAKES (pink curve, right panel) indicate that the LAKES scenario contributes to the relative weakening of westerlies north of 55°S. In essence, the circulation changes, freshening of water masses and altered westerlies during the MH have significant implications for regional and global climate systems. Strengthening and expansion of the subtropical gyre, alongside the weakening of the subpolar gyre, probably redistributed energy and momentum in the South Atlantic, influencing heat transport. Freshening of the SACW and AAIW, driven by enhanced precipitation and runoff, act to modify the density structure, reducing vertical mixing and increasing stratification in the water column. These changes could have weakened the AMOC, with potential implications for inter-hemispheric heat transport and global climate stability. The intensification of westerlies within 30–55°S suggests shifts in precipitation patterns over adjacent landmasses, whereas weakened south-east trade winds could alter coastal dynamics along the African coastline. These findings are consistent with the complex interactions between terrestrial, atmospheric and oceanic systems, emphasising the sensitivity of the Earth system to environmental shifts and the widespread impacts across interconnected climate subsystems.
Left hand-side panel shows the zonally averaged mean zonal winds (m s−1) for the South Atlantic (10–55°S) considering longitudes west of 30°W for PI (red), 6K (blue), GS (Green) and LAKES (cyan). Right-hand side panel shows the differences in the zonally averaged mean winds for 6K-PI (red), GS-PI (green), LAKES-PI (black), GS-6K (cyan) and LAKES-GS (pink).
5.Conclusions
Within the confines of NASA-GISS-E2.1-G model experiments for the MH period, the inclusion of a vegetated GS and African mega-lakes appears to affect the dynamics of the South Atlantic, deviating from PI conditions. The MH climate simulations reveal a general cooling trend across the South Atlantic but with warming north of ~30°S with intensified positive differences at the African coast and Agulhas retroflection for GS. The addition of the expansive lakes contributes to warmer SSTs when compared to GS alone, particularly in a zonal band at the southern edge of the subtropical gyre. This implies that changes in land cover and hydrology, such as increased vegetation and surface water, modifies atmospheric processes (Li et al. 2023) affecting the adjacent ocean. Furthermore, the observed freshening of the SACW in these scenarios indicates shifts in the hydrological cycle, likely driven by increased freshwater input from enhanced precipitation due to the vegetation changes and the presence of the mega-lakes. The atmospheric response is evident in the reduction of SLP south of 30°S, indicative of a weakened high-pressure system. This is coupled with modifications in wind patterns, specifically the strengthening of the westerlies and the weakening of the south-east trades. Changes in BSF across the scenarios show that subtropical and subpolar gyres are affected. Overall, the study points out the role of terrestrial factors, such as vegetation and lake presence, in modulating the South Atlantic’s climate during the MH, emphasising the complex interplay between terrestrial and oceanic systems.
The MH ocean–atmosphere circulation changes together with freshening of water masses, can have significant implications for regional and global climate systems. Strengthening and expansion of the subtropical gyre, along with weakening of the subpolar gyre, probably redistributed energy and momentum in the South Atlantic, influencing heat transport. Freshening of the SACW and AAIW driven by increased precipitation can alter the density structure, reducing vertical mixing and stratifying the water column. Furthermore, the strengthening of westerlies within 30–55°S suggests shifts in precipitation patterns over adjacent landmasses, whereas weakened south-east trade winds affect coastal dynamics along the African coastline. These findings highlight the connected nature of terrestrial and oceanic systems, emphasising the sensitivity of the Earth system to environmental shifts and their cascading impacts across climate subsystems.
Declaration of funding
This study was supported by grants to Ilana Wainer: 2019/08247-1 and 2020/14356-5 from Fundação de Amparo à Pesquisa do Estado de São Paulo (FAPESP); CNPq-405869/20134, CNPq.MCT.INCT.CRIOSFERA-573720/20088 and CNPq 405607/2023-7 from Conselho Nacional de Desenvolvimento Científico e Tecnológico (CNPq); to Paulo Silva: 2021/04596-1 from FAPESP; and to Luciana Prado: E-26/210.291/2024 from Fundação Carlos Chagas Filho de Amparo à Pesquisa do Estado do Rio de Janeiro (FAPERJ). We also thank the NASA Center for Climate Simulation for institutional support.
References
Chandan D, Peltier WR (2020) African humid period precipitation sustained by robust vegetation, soil, and lake feedbacks. Geophysical Research Letters 47(21), e2020GL088728.
| Crossref | Google Scholar |
Chapori NG, Chiessi CM, Bickert T, Laprida C (2015) Sea-surface temperature reconstruction of the Quaternary western South Atlantic: new planktonic foraminiferal correlation function. Palaeogeography, Palaeoclimatology, Palaeoecology 425, 67-75.
| Crossref | Google Scholar |
Claussen M, Dallmeyer A, Bader J (2017) Theory and modeling of the African humid period and the Green Sahara. In ‘Oxford Research Encyclopedia of Climate Science’. (Oxford University Press) doi:10.1093/acrefore/9780190228620.013.532
Combes V, Matano RP (2014) Trends in the Brazil/Malvinas Confluence region. Geophysical Research Letters 41(24), 8971-8977.
| Crossref | Google Scholar |
Contoux C, Jost A, Ramstein G, Sepulchre P, Krinner G, Schuster M (2013) Megalake chad impact on climate and vegetation during the late Pliocene and the mid-Holocene. Climate of the Past 9(4), 1417-1430.
| Crossref | Google Scholar |
Demenocal P, Ortiz J, Guilderson T, Adkins J, Sarnthein M, Baker L, Yarusinsky M (2000) Abrupt onset and termination of the African humid period: rapid climate responses to gradual insolation forcing. Quaternary Science Reviews 19(1–5), 347-361.
| Crossref | Google Scholar |
Gaetani M, Messori G, Pausata FS, Tiwari S, Alvarez Castro MC, Zhang Q (2024) Mid-Holocene climate at mid-latitudes: assessing the impact of Saharan greening. Climate of the Past 20(8), 1735-1759.
| Crossref | Google Scholar |
Garzoli SL, Matano R (2011) The South Atlantic and the Atlantic Meridional overturning circulation. Deep-Sea Research – II. Topical Studies in Oceanography 58(17), 1837-1847.
| Crossref | Google Scholar |
Gordon AL (1989) Brazil–Malvinas Confluence – 1984. Deep-Sea Research – A. Oceanographic Research Papers 36(3), 359-384.
| Crossref | Google Scholar |
Gorenstein I, Wainer I, Pausata FSR, Prado LF, Khodri M, Dias PLS (2023) A 50-year cycle of sea surface temperature regulates decadal precipitation in the tropical and South Atlantic region. Communications Earth & Environment 4(1), 427.
| Crossref | Google Scholar |
Haile M (2005) Weather patterns, food security and humanitarian response in sub-Saharan Africa. Philosophical Transactions of the Royal Society of London – B. Biological Sciences 360, 2169-2182.
| Crossref | Google Scholar | PubMed |
Kelley M, Schmidt GA, Nazarenko LS, Bauer SE, Ruedy R, Russell GL, Ackerman AS, Aleinov I, Bauer M, Bleck R, Canuto V, Cesana G, Cheng Y, Clune TL, Cook BI, Cruz CA, Del Genio AD, Elsaesser GS, Faluvegi G, Kiang NY, Kim D, Lacis AA, Leboissetier A, LeGrande AN, Lo KK, Marshall J, Matthews EE, McDermid S, Mezuman K, Miller RL, Murray LT, Oinas V, Orbe C, García-Pando CP, Perlwitz JP, Puma MJ, Rind D, Romanou A, Shindell DT, Sun S, Tausnev N, Tsigaridis K, Tselioudis G, Weng E, Wu J, Yao MS (2020) GISS-E2.1: configurations and climatology. Journal of Advances in Modeling Earth Systems 12(8), e2019MS002025.
| Crossref | Google Scholar | PubMed |
Krinner G, Lezine AM, Braconnot P, Sepulchre P, Ramstein G, Grenier C, Gouttevin I (2012) A reassessment of lake and wetland feedbacks on the North African Holocene climate. Geophysical Research Letters 37, L07701.
| Crossref | Google Scholar |
Li Y, Kino K, Cauquoin A, Oki T (2023) Contribution of lakes in sustaining the Sahara greening during the mid-Holocene. Climate of the Past 19(10), 1891-1904.
| Crossref | Google Scholar |
Marcello F, Wainer I, Rodrigues RR (2018) South Atlantic subtropical gyre late 20th Century changes. Journal of Geophysical Research: Oceans 123, 5194-5209.
| Crossref | Google Scholar |
Marcello F, Tonelli M, Ferrero B, Wainer I (2023) Projected Atlantic overturning slowdown is to be compensated by a strengthened South Atlantic subtropical gyre. Communications Earth and Environment 4(1), 92.
| Crossref | Google Scholar |
Nana HN, Tanessong RS, Tchotchou LA, Tamoffo AT, Moihamette F, Vondou DA (2023) Influence of strong South Atlantic Ocean Dipole on the Central African rainfall’s system. Climate Dynamics 62, 1-16.
| Crossref | Google Scholar |
Nnamchi HC, Li J (2011) Influence of the South Atlantic Ocean Dipole on West African summer precipitation. Journal of Climate 24(4), 1184-1197.
| Crossref | Google Scholar |
Quade J, Dente E, Armon M, Ben Dor Y, Morin E, Adam O, Enzel Y (2018) Megalakes in the Sahara? A Review. Quaternary Research 90, 253-275.
| Crossref | Google Scholar |
Rodrigues R, Taschetto A, Sen Gupta A, Foltz G (2020) From severe droughts in South America to marine heatwaves in the South Atlantic. In ‘EGU General Assembly 2020’, 4–8 May 2020, held virtually. EGU2020-5162. (Copernicus GmbH) doi:10.5194/egusphere-egu2020-5162
Skinner CB, Poulsen CJ (2016) The role of fall season tropical plumes in enhancing Saharan rainfall during the African humid period. Geophysical Research Letters 43(1), 349-358.
| Crossref | Google Scholar |
Specht NF, Claussen M, Kleinen T (2022) Simulated range of mid-Holocene precipitation changes from extended lakes and wetlands over North Africa. Climate of the Past 18(5), 1035-1046.
| Crossref | Google Scholar |
Tierney JE, Pausata FS, De Menocal PB (2017) Rainfall regimes of the Green Sahara. Science Advances 3, 1601503.
| Crossref | Google Scholar | PubMed |
Tiwari S, Ramos RD, Pausata FSR, LeGrande AN, Griffiths ML, Beltrami H, Wainer I, de Vernal A, Litchmore DT, Chandan D, Peltier WR, Tabor CR (2023) On the remote impacts of mid-Holocene Saharan vegetation on South American hydroclimate: a modeling intercomparison. Geophysical Research Letters 50(12), e2022GL101974.
| Crossref | Google Scholar |
Tiwari S, Pausata FSR, LeGrande AN, Griffiths M, Wainer I, Beltrami H, de Vernal A, Hopcroft PO, Tabor CR, Chandan D, Peltier WR (2024) Mid-Holocene ENSO variability reduced by northern African vegetation changes: a model intercomparison study. ESS Open Archive [Preprint, published 3 October 2024].
| Crossref | Google Scholar |
Wainer I, Venegas SA (2002) South Atlantic multidecadal variability in the climate system model. Journal of Climate 15(12), 1408-1420.
| Crossref | Google Scholar |
Wainer I, Prado LF, Khodri M, Otto-Bliesner B (2021) The South Atlantic sub-tropical dipole mode since the last deglaciation and changes in rainfall. Climate Dynamics 56(1–2), 109-122.
| Crossref | Google Scholar |
Zhang M, Liu Y, Zhang J, Wen Q (2021) AMOC and climate responses to dust reduction and greening of the sahara during the mid-holocene. Journal of Climate 34(12), 4893-4912.
| Crossref | Google Scholar |