

Effects of nutrient loading on the trophic state of Lake Brunner
P. Verburg A D , J. Horrox B , E. Chaney B , J. C. Rutherford A , J. M. Quinn A , R. J. Wilcock A and C. W. Howard-Williams CA National Institute of Water & Atmospheric Research Ltd, Gate 10, Silverdale Road, Hamilton, PO Box 11115, Hamilton, New Zealand.
B West Coast Regional Council, PO Box 66, Greymouth 7840.
C National Institute of Water & Atmospheric Research Ltd, Christchurch, New Zealand.
D Corresponding author. Email: piet.verburg@niwa.co.nz
Marine and Freshwater Research 64(5) 436-446 https://doi.org/10.1071/MF12128
Submitted: 7 May 2012 Accepted: 16 January 2013 Published: 3 May 2013
Journal Compilation © CSIRO Publishing 2013 Open Access CC BY-NC-ND
Abstract
Lake Brunner, an oligotrophic monomictic lake on the West Coast of the South Island of New Zealand, is under pressure from urban expansion and increased farming activity, which has led to concern for the effects on water quality in the lake. Epilimnetic nitrogen, phosphorus and chlorophyll a concentrations have increased since 1992, and Secchi depth decreased. This suggests an increased algal productivity caused by increased nutrient inputs, further supported by increased hypolimnetic oxygen depletion since 1992. These observations are likely to have resulted from enhancement of pasture drainage and effluent inputs from expanding dairy farms. The Vollenweider model predicted a mean phosphorus concentration in the lake close to that observed, from estimated catchment loading, suggesting that the Vollenweider model adequately estimated the retention of phosphorous. With the Vollenweider model the effects of potential future loading scenarios were explored. Modelling suggested that a 70% increase in phosphorus loading could turn the lake into a mesotrophic state. Trend analysis of total phosphorus suggests that, with present land uses in the catchment (intensive dairy farming) continuing to develop at the same rate using the same land management practises, this transition to a mesotrophic state will occur by 2040.
Additional keywords: eutrophication, Lake Brunner, New Zealand.
Introduction
Water quality and algal biomass in waterbodies are correlated with the intensity of land use in the catchment, with pastoral agriculture having a stronger impact than native forest or arable and horticultural land uses. Inputs of nitrogen (N) and phosphorus (P) from pastoral agriculture affect lake waters by promoting eutrophication. Typically, shallow lakes are affected strongly by agricultural runoff resulting in highly eutrophic lakes (Marsden 1989). Studies showing that large, deep lakes in relatively unpopulated areas are affected by agricultural runoff are more rare.
Lake Brunner is the largest lake in the north-western part of the South Island of New Zealand, in the Grey District 30 km inland from Greymouth (Fig. 1), with a surface area of 41 km2 and a maximum depth of 109 m (Spigel 2008). Lake Brunner is an oligotrophic temperate monomictic lake, stratifying only during summer, and is humic, with a dissolved organic carbon concentration of 2.5 g m–3 (Paerl et al. 1979). The lake is a popular tourist destination, is held in high esteem by trout fishermen and is a regional centre for freshwater recreation. Most of the catchment is undeveloped native forest and the lake is relatively pristine.

|
Presently ~20% of the catchment is used for agriculture (Fig. 1) and dairy farms occupy 8% of the catchment (Rutherford et al. 2008). Pastoral dairy farming is an intensive form of agriculture that is characterised by relatively large export coefficients of N, P, sediment and faecal organisms and has been identified as a major cause of degraded water quality in New Zealand (Wilcock et al. 2007; Quinn et al. 2009).
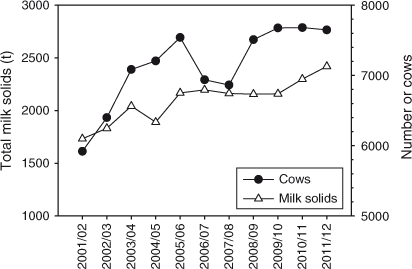
The number of dairy cows and the amount of milk solids produced at farms in the catchment of Lake Brunner increased 29% and 40% respectively between 2001 and 2011 (Fig. 2; data from Westland Milk Products, no data available before 2001). The number of dairy cows in the Grey District increased 143% between 1996 and 2007, more than the average increase of 29% in New Zealand over the same period (www.stats.govt.nz).
|
Average annual rainfall in the Lake Brunner catchment is 3–7 m year–1, and in order to enhance drainage of ponded surface water, farmers contour the land into long ridges with hollows between, a process known as ‘humping and hollowing’ (Brown 2004; McDowell 2008a, 2008b). Paddocks examined in the Lake Brunner catchment in 2006 had been humped and hollowed from 1 to 13 years ago, suggesting that the amount of land contoured into humps and hollows has increased since the early 1990s (McDowell 2008a). Extensive humping and hollowing has led to concern that nutrients are drained faster to the lake and that increased agricultural runoff from dairy farms in particular may affect the lake’s water quality. In view of the enhanced drainage by humping and hollowing, and in view of the increased number of dairy cows in the catchment, we examined the nutrient dynamics in the lake and trends since 1992 when regular water quality monitoring started, and the effect of nutrient loading from the catchment on nutrient status in the lake, in relation to increasing agricultural intensification in the catchment associated with intensive dairy farming.
Methods
Water quality
Depth-integrated water samples were collected with a 25-m tube and Secchi depth was measured at approximately monthly intervals during January 1992 to June 1995 and July 2001 to March 2011 at a central site in Lake Brunner (Fig. 1). Water samples were analysed by the NIWA water quality laboratories for concentrations of chlorophyll a, total nitrogen (TN), total phosphorus (TP), nitrate (NO3N), and dissolved reactive phosphorus (DRP). Ammonia (NH4N), particulate nitrogen (PN), particulate phosphorus (PP), total dissolved nitrogen (TDN), and total dissolved phosphorus (TDP) were analysed only since July 2001. Dissolved organic phosphorus (DOP) was estimated as TDP – DRP and dissolved organic nitrogen (DON) was estimated as TDN – (NO3N + NH4N). Organic nitrogen was given by TN – DIN, where DIN is dissolved inorganic nitrogen (NO3N + NH4N), and organic phosphorus was given by TP – DRP.
Absorbance was measured at 340, 440 and 740 nm since September 2003, on filtered (0.45 μm membrane filter) water samples. The absorption coefficient at 340 nm is estimated by
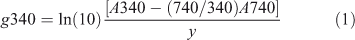
where A is absorbance and which includes a correction for bias from residual scattering derived from near-infrared absorbance at 740 nm (Davies Colley and Nagels 2008), and with y = cell length (0.1 m cells until 2006, and 0.04 m since 2006). The factor ln(10) converts from log10 units (of absorbance) to natural logarithms.
Temperature and oxygen profiles were measured at the same site as the water quality. Data for 1992–95 have been presented in Burns and Rutherford (1998).
Estimation of nutrient loading
Nutrient loading from the catchment was estimated as the product of the relationship between flow rate and nutrient concentrations in the main tributaries and estimated daily average inflow rates. Daily average total inflow rates were estimated by difference from the balance of measured daily outflow rates and daily lake level change, rainfall and estimated open water evaporation in the region (see next section). The total inflow was apportioned between the tributaries based on the average of their measured flows. Water quality and flow were measured approximately monthly in three tributaries, the Crooked, Hohonu and Orangipuku Rivers, which make up 74% of the tributary flow into Lake Brunner, in 2003–07 (n = 119). Water quality and flow were also measured occasionally in two other tributaries – the Carew (a small undeveloped catchment) and the Poerua (which flows into the Crooked). Daily nutrient loads in the Crooked, Hohonu and Orangipuku Rivers during 2003–07 were estimated using relationships between nutrient concentrations and measured flow in each of the tributaries, and daily mean inflow rates (see next section). In the remaining tributaries (26% of total inflow) the concentrations of TP and TN were assumed to be equal to the means in the forested catchment of the Carew River and flow independent.
Water balance
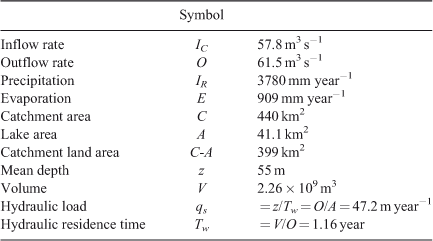
The outflow rate (O) was measured at the Arnold Power Station at the outlet of the lake and daily means computed. The annual mean outflow rate was 61.5 m3 s–1 (Table 1). Evaporation (E) at Lake Brunner, extrapolated from Penman open water evaporation at Greymouth (NIWA CliFlo climate database, using years 2008–09), 27 km from the centre of Lake Brunner and the nearest site for which evaporation data are available, was estimated to be 909 mm year–1. This amounts to a rate of 1.18 m3 s–1 over the full lake area (at Lake Brunner a 1-m lake level change per year in water balance components is equivalent to a flow rate of 1.3 m3 s–1). The annual mean total loss of water (E + O) was 62.7 m3 s–1. Evaporation amounted to only 1.9% of the total water balance of Lake Brunner.
|
Mean annual rainfall (IR) on the lake computed from the means of Arnold Power Station (for 1940–94), Mitchells (1988–93), Te Kinga (2006), and Inchbonnie (1940–2010, NIWA CliFlo climate database) was 3784 mm, amounting to a mean flow rate of 4.93 m3 s–1. Rainfall contributed 7.9% of the annual water budget. Monthly mean rainfall was high throughout the year, between 325 and 385 mm month–1 in May–June and September–January, and between 250 and 300 mm month–1 the rest of the year. Rainfall in the catchment increased with altitude. Of the four sites, only at Inchbonnie was rainfall recorded for most of the period since 1992. At Inchbonnie and two other sites ~30 km away from the centre of the lake annual total rainfall did not change significantly since 1992 (P < 0.05).
The lake level changed, on average, 39 cm between the minimum in March and the maximum in October (with data available since 1969). Although the annual mean lake level increased significantly since 1969 (P < 0.00001) by nearly 70 cm, and ~25 cm since 1992 (P < 0.01), the outflow rate did not change significantly (the lake has a dam at its outlet). The increase in annual mean lake level amounted to an average 0.02 m3 s–1, insignificant relative to the mean outflow rate of 61.5 m3 s–1. However, on a daily basis, the change in volume (Δ) was taken into account in the estimation of the total inflow to the lake. The volume change averaged ~1 m3 s–1 between minimum and maximum lake level.
Mean annual total input of water to the lake from the catchment by rivers and groundwater was:

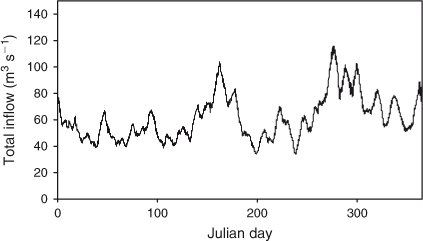
There was no strong seasonality to tributary inflow rates (Fig. 3). Mean monthly total inflow rates were between 50 and 70 m3 s–1 most of the year, with higher flows in June and October (80–90 m3 s–1) as a result of higher rainfall in those months.
|
Results
Description of lake thermal characteristics and seasonal stratification
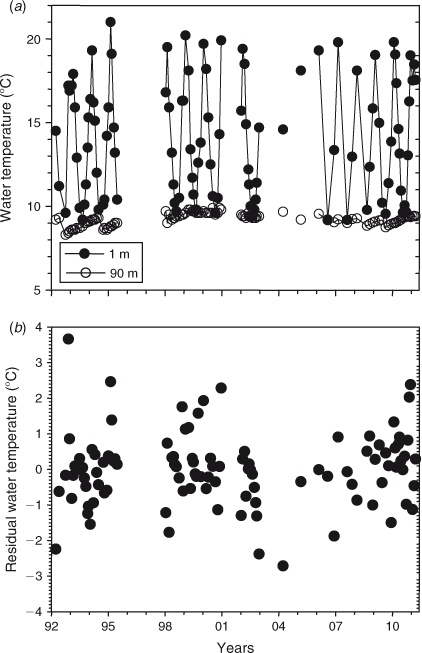
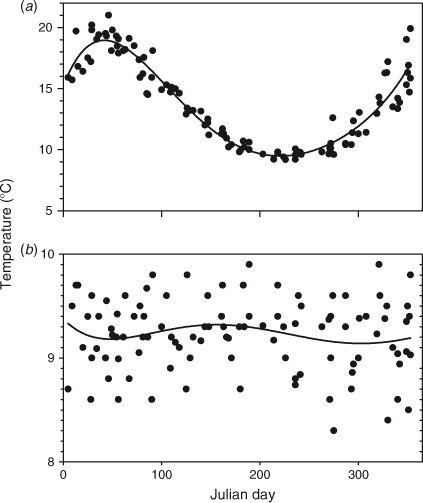
Surface temperatures varied by ~10° and were typically lowest in August and highest in February (Figs 4a, 5a). The thermocline, when present, generally centred at 25 m depth in October–February, slightly deeper in March–June, and was absent in July–September. By July or August the water column was isothermal, allowing the lake to overturn. Bottom water temperature increased ~0.5°C during the stratified months, between October and June, suggesting that vertical mixing of the full water column continued at a slow rate during this season, followed by cooling of the bottom water during most, but not all, winters. Bottom water temperatures peaked around 1998–2000. There was a strong relationship between day of the year and temperature at 1 m (R2 = 0.91, fifth-order polynomial) (Fig. 5a) and the temperature difference between 1 and 90 m depth (R2 = 0.91). The temperature difference between surface and bottom water is a measure of the stability of the water column as a result of stratification, which is zero during winter overturn and maximum during summer. As a result of interannual differences in the seasonal trend in bottom water temperature there was no significant relationship between day of the year and temperature at 90 m depth (R2 = 0.03) (Fig. 5b) or 100 m depth (R2 = 0.04). Temperature at 1 m depth did not change significantly from 1992 (P > 0.05), also not after removing seasonal variability by computing the residuals of fifth-order polynomial fits. There was also no significant trend in the temperature difference between 1 and 90 m depth (Fig. 4b), with or without removing seasonality (P > 0.05).
|
|
Oxygen concentrations
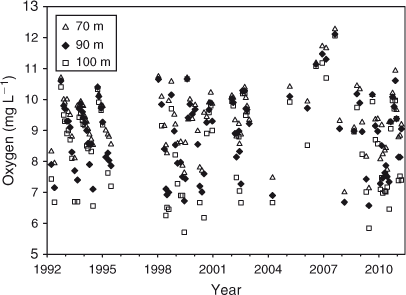
Lowest oxygen concentrations at 100 m depth were ~6–7 mg L–1 and at 70 m depth ~8 mg L–1. Oxygen concentrations at 70–100 m depth were typically highest in October, and they were lowest in June towards the end of the stratified period (Fig. 6). In part because of the sudden and rapid shift in oxygen concentration around October when hypolimnetic oxygen was replenished by vertical mixing the fit of the relationship between day of the year and the oxygen concentration, using polynomials (R2 = 0.42–0.48) was not strong.
|
Lake nutrient status
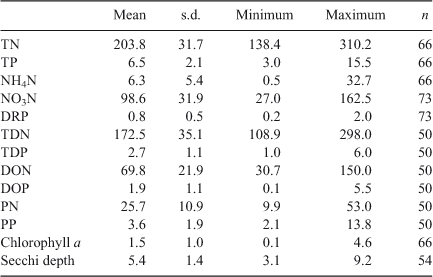
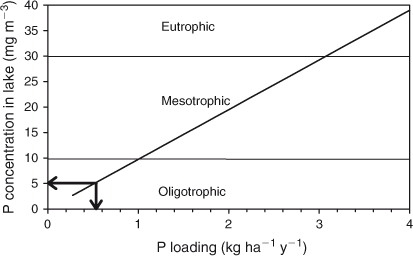
The lake is oligotrophic, as defined by its low TP and chlorophyll a concentrations (Table 2; Fig. 7). The boundary between oligotrophic and mesotrophic states in lakes is considered to be at 10 mg TP m–3, whereas 30 mg TP m–3 separates mesotrophic from eutrophic lakes (Vollenweider 1976; Kalff 2003). The average concentration of TN classifies Lake Brunner among oligotrophic lakes as well (Wetzel 2001). The total P concentration is generally considered the most important of these indicators of trophic state.
|

|
Trends in lake nutrient concentrations and proxies of organic matter
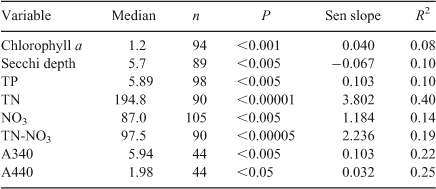
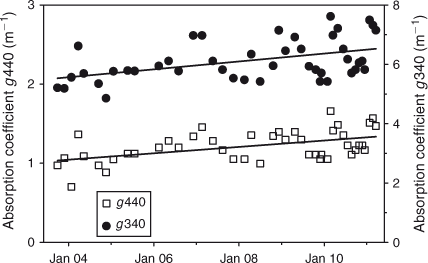
Significant increases occurred in epilimnetic concentrations of chlorophyll a, TN, TP, and NO3N since 1992, whereas Secchi depth decreased (Table 3; Fig. 7). Absorption coefficients measured at 340 and 440 nm increased significantly since 2003 (Table 3; Fig. 8), suggesting an increase in the concentration of coloured dissolved organic matter (CDOM). If the increase of total P continues at the same rate the transition to a mesotrophic state will occur by 2040. DRP was often below the detection limit, making regression meaningless. The explained amount of variation with time was highest for TN (R2 = 0.40, without adjusting for variability explained by seasonality). The slope of the increase from 1992 to 2011 in TN excluding NO3N (TN – NO3N; mostly organic nitrogen) was similar to that of NO3N (2.2 and 1.2 mg m–3 year–1, respectively). TN concentration was 45% higher in 2008–10 than in 1992–94, while TP and chlorophyll a concentrations increased 27% and 82% respectively.
|
|
Using the linear regressions (Fig. 7) between 1992 and 2011, NO3N and TN increased by the same amount, 55%. TP increased by 39% and chlorophyll a by 79%. Although the proportional increase in TN was higher than in TP, there was no significant increase in the TN : TP ratio.
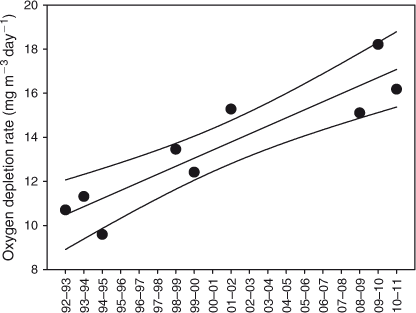
Oxygen depletion rates in the hypolimnion during the stratified season, estimated as the difference in concentration between the maximum (generally in August–October) and the following minimum (in May–July), divided by the number of days, increased with depth. Oxygen depletion at 90 m depth increased significantly since 1992 (P < 0.001, n = 9) (Fig. 9). Similar results were found at 70 (P < 0.01, n = 9), 80 (P < 0.005, n = 9) and 100 m (P < 0.005, n = 9) depth. However, there was no evidence for a long-term decline in bottom water oxygen concentrations (Fig. 6). Oxygen concentrations at 70–100 m depth in any of the months January–June (n = 7–11) or in April–June (n = 24) did not decrease significantly from 1992 to 2010. It may be that the period over which oxygen depletion occurs in the hypolimnion has become shorter, followed by a period of relatively little change such as occurred, for instance, in January–June 2010 (Fig. 6), resulting in a faster estimated rate of depletion but not necessarily in lower oxygen concentrations. Using the same months, October and June (but note that in these months oxygen concentrations were not always at their maximum or minimum, respectively, see above), to estimate oxygen depletion in each year allowed only six estimates instead of nine and did not show a trend of increased oxygen depletion.
|
Nutrients in inflowing rivers
The mean yields from the catchment in 2003–07 estimated from daily inflow rates, tributary concentrations and flow-dependent relationships were 0.60 kg TP ha–1 year–1 and 12.5 kg TN ha–1 year–1 (Table 4). TP and TN specific yields were highest in the Orangipuku River (0.93 kg TP ha–1 year–1 and 21 kg TN ha–1 year–1), the most intensively farmed catchment. Total annual yields were 497 t year–1 TN and 23.8 t year–1 TP.

|
TP and TN concentrations varied only weakly with flow in the forested catchment (Carew River) and in lake outflows (Poerua River). TP concentrations varied strongly with flow in tributaries draining farmland (Fig. 10). TN concentrations varied less with flow than TP in tributaries draining farmland.
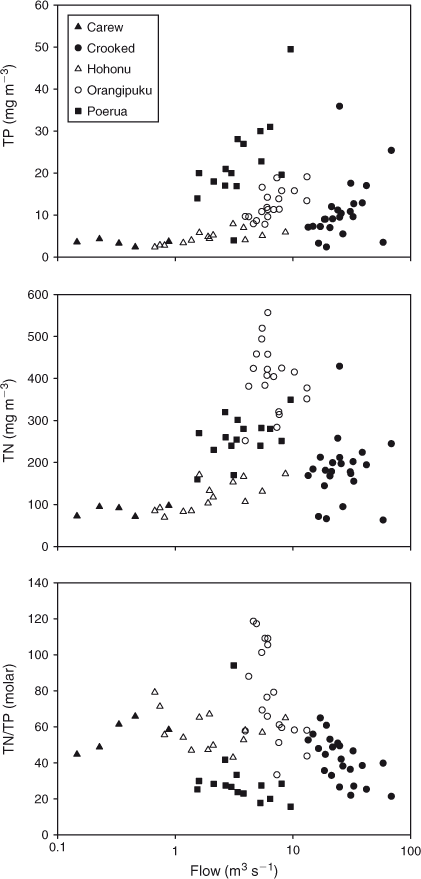
|
Flow-weighted TN : TP ratios for the Poerua, Crooked, Hohonu, Carew and Orangipuku rivers were 23, 33, 57, 58, and 66 mol mol–1 respectively (Fig. 10). The ratio was lowest in the Crooked and Poerua rivers (the latter is part of the Crooked subcatchment), which together make up 61% of the land area in the Brunner catchment and supply 53% of the river flow into the lake. The TN : TP ratio decreased further in the Crooked–Poerua with increasing flow rates (Fig. 10), as a result of increasing TP concentrations. The TN : TP ratio was highest in the catchment of the Orangipuku River (TN : TP = 66 mol mol–1), which drains only 11% of the catchment but is the most intensively developed catchment.
The total area in dairy farming in the catchment of Lake Brunner is 3432 ha (2003–07 data). This is 54% of the total area of high-producing exotic grassland in the catchment. On the basis of the Land Cover Database, 35% of the Orangipuku catchment area is high-producing exotic grassland while the Crooked–Poerua catchment contains 18% high-producing exotic grassland. The proportions in dairy farming in the Crooked–Poerua and Orangipuku catchments are 54 and 69%, respectively, of the areas in high-producing grassland.
In the Orangipuku River TN concentrations were highest (mean 402 TN mg m–3, compared with a mean 85–268 TN mg m–3 for the other rivers). However, its TP load was relative modest (mean 12 mg TP m–3, compared with mean 3.5–35 mg TP m–3 for the other monitored rivers), resulting in high TN : TP ratios. TP concentrations were lowest in the Carew and Hohonu Rivers, which drain the least developed catchments (mean 4 mg TP m–3), 6-fold less than in the more developed Crooked–Poerua catchment. TN : TP ratios in the Carew and Hohonu rivers were intermediate (58 and 57 mol mol–1).
In the three rivers draining the more developed catchments, DIN was a larger proportion of TN (27, 54 and 80% respectively in the Poerua, Crooked, and Orangipuku, flow weighted) compared with the Hohonu River and the forested catchment of the Carew (22 and 13% respectively). In the Hohonu and Carew Rivers a larger share of TN (67 and 84% respectively) was accounted for by DON than in the Poerua, Crooked, and Orangipuku (18, 31 and 15% respectively), while in the lake DON was 34% of TN.
Discussion
Nutrient loading to the lake and predicted lake P concentrations
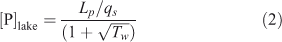
The relationship between P concentration in lakes and the loading rate (Fig. 11) is commonly predicted by the equation
|
(Vollenweider 1976) where Lp is the loading rate of P per area of the lake surface (mg m–2 year–1), equal to total annual load (mg year–1) divided by the lake surface area (m2), qs is the hydraulic load (m year–1) and Tw is the hydraulic residence time (Table 1). From a loading from the catchment of 23.8 t year–1 TP, Eqn 2 predicts a mean TP concentration in the lake of 5.9 mg m–3. The fact that the Vollenweider equation predicts a mean P concentration in the lake close to that observed (Table 2), suggests that the Vollenweider equation adequately models the retention of P in the lake (Nürnberg 1984; Ahlgren et al. 1988).
There are no data on atmospheric nutrient inputs (rainfall + dry fall directly on the lake) to Lake Brunner but they are expected to be small relative to the catchment inputs. The total mean loading in the lake from the catchment amounted to 497 t TN year–1 and 23.8 t TP year–1. Typical rates of atmospheric deposition on the North Island of New Zealand of 3–6 kg TN ha–1 year–1 (Schouten 1983; Timperley et al. 1985) and 0.2 kg TP ha–1 year–1 (Schouten 1983) would add 2–5% and 3%, respectively, to the total N and P loading in the lake. Rates of deposition of inorganic N and P are substantially lower on the South Island (Nichol et al. 1997). Organic deposition data are not available for the South Island but are less than 50% of total atmospheric deposition in the North Island (Schouten 1983; Timperley et al. 1985).
The average inflow TP concentration for all inflows (total load divided by total inflow rate) was 13.1 mg TP m–3. The two major river systems that drain dairy farmland in the Lake Brunner catchment have mean concentrations of 12.5 mg TP m–3 (Orangipuku) and 20.0 mg TP m–3 (Crooked). The average loading rate per area of the catchment (land only) of 0.60 kg P ha–1 year–1 compares well with published yields, which lie in the range 0.5–1 kg P ha–1 year–1 (Menneer et al. 2004). Equation 2 (Fig. 11) suggests a mean concentration in the tributaries of 14.4 mg TP m–3 following from a TP concentration in the lake of 6.5 mg m–3 and the hydraulic loading and mean residence time in Table 1. This estimate of mean inflow concentration compares well with the concentration that follows from the estimated catchment yield.
The critical loading (Lc) in terms of mean P concentrations in the inflow beyond which the lake is expected to become mesotrophic (Kalff 2003) with [P]lake >10 mg m–3, is:

which is equivalent to 1.03 kg P ha–1 year–1 per unit land area in the catchment. This is ~1.7 times the present rate of P loading.
The two main rivers draining dairy farm catchments, the Crooked River and the Orangipuku River, contribute 38.5 m3 s–1 to the lake out of a total inflow of 57.8 m3 s–1 (67%), and transport 18.2 t P year–1 to the lake (77% of total P load), and 278 t N y–1 (56% of total N load). Their volume weighted mean TN : TP ratio of 34 mol mol–1 was lower than the average in the inflows (46 mol mol–1). In particular, the Crooked River discharges relatively more P into the lake, compared with N, than the remainder of the lake’s catchment.
Changes in primary productivity and oxygen consumption
Chlorophyll a, epilimnetic nutrient concentrations (Fig. 7) and absorption coefficients at 340 and 440 nm (Fig. 8) have increased since 1992, and there has been a corresponding decrease in Secchi depth (Fig. 7). Light absorption at 340 and 440 nm is an indicator of CDOM concentrations (Davies-Colley and Nagels 2008). Reduced Secchi depth is likely the result of the combination of increased chlorophyll a and increased CDOM. Both CDOM and nutrient concentrations in the lake may be enhanced by enhanced drainage from dairy farms. While it is likely that increased algal biomass is due to increased nutrient inputs, at present it is not possible to decide to which extent the change in Secchi depth has been the result of increased algal biomass, or the result of increased inputs of CDOM. An effect of high CDOM (Paerl et al. 1979) and non-algal turbidity on water clarity may explain why, while nutrient concentrations suggest an oligotrophic status for the lake, the Secchi disk depth (mean 5.4 m: Table 2) suggests a state closer to that of a mesotrophic system (Lind 1986).
The lack of a significant trend in the temperature difference between 1 and 90 m depth suggests there is no evidence for a long-term change in vertical mixing. Therefore the increase in epilimnetic nutrient concentrations since 1992, in particular of NO3, is not a result of a change in vertical mixing. Regional long-term oscillations in rainfall, linked to cyclical climate controls, can result in cycles with timescales in the order of decades in runoff and export of DOC and nutrients from the catchment to the lake. Such long-term cycles in rainfall can result in long-term cycles in transparency and productivity in lakes (Gaiser et al. 2009). However, there was no evidence for an increase in rainfall in the catchment affecting Lake Brunner’s water quality through increased export of nutrients from the catchment to the lake (our results and Wilcock et al. 2013). Therefore, increased intensification of land use through development of dairy farms, coupled with rapid drainage from humping-and-hollowing is likely to be the major cause of increased nutrient concentrations and algal productivity in Lake Brunner.
The average oxygen consumption at 70–100 m depth during the summer was 10–15 mg O2 m3 day–1. Oxygen consumption in the hypolimnion is crucial for the relations between nutrient loading, epilimnetic nutrient and chlorophyll a concentrations, Secchi depth, algal biomass and rates of primary productivity. At present the hypolimnion in the centre of the lake is well oxygenated throughout the year, suggesting little release of P from sediments. Between October and May an oxygen consumption rate in bottom water of ~70 mg m3 day–1 would be required to result in anoxia, or about 5-fold the present rate of oxygen consumption.
Vollenweider relationships between TP concentrations in inflows and in the lake (Eqn 2 and Eqn 3) were based on lakes with oxygenated bottom waters. In lakes where part or all of the bottom temporarily or permanently becomes anoxic, the method would underestimate TP concentrations in the lake. When external P loading and lake productivity exceed a certain threshold, resulting in reduced oxygenation of bottom water by sedimentation of organic matter, a smaller proportion of P will be permanently buried and additional inputs to the water column of dissolved P will appear through release of P from the sediments (Nürnberg 1984).
Oxygen concentrations in the hypolimnion were consistently drawn down in each warm stratified season, although the oxygen concentration usually remained above 6 g m–3 (~55% saturation; the lowest value was usually reached in May or June). Throughout the stratified season the decrease in oxygen concentration over time was linear (R > 0.94 between 1992 and 1995; see Burns and Rutherford 1998), suggesting a constant rate of oxygen consumption.
The relation between rates of primary productivity as predicted from P loading rates is non-linear, as a result of self-shading by high algal biomass at high levels of productivity (Wetzel 2001). Primary productivity in Lake Brunner is estimated to be ~85 g C m–2 year–1, following from an equation in Wetzel (2001), using P loading rates (with [P]i for the mean inflow concentration) and residence time:
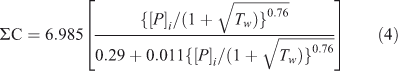
Real primary productivity may be lower as a result of light limitation by high CDOM. However, it is probably not substantially lower because the predicted algal production of 85 g C m–2 year–1 agrees well with the estimated oxygen consumption. The oxygen consumption, ~6.3 mol O2 m–2 year–1 (taking a mean oxygen consumption of 10 mg O2 m3 day–1, and a mean water column of 55 m) is nearly equal to predicted primary productivity (7.1 mol C m–2 year–1). Taking into account a respiration quotient of 1.2 suggests 8.5 mol O2 is needed to respire 7.1 mol organic C. The difference of 35% with the annual O2 consumption is accounted for by burial of organic C in the sediments, loss of organic matter by the outflow, and by error in the estimate of annual O2 consumption. On the other hand, it may be that actual primary productivity is lower in Lake Brunner than predicted by Eqn 4 because of light attenuation by CDOM, potentially resulting in a substantial component of O2 consumption to be explained by respiration of allochthonous CDOM.
Primary productivity in Lake Brunner is probably sensitive to increases in P loading because of the large difference between the N and P concentrations, with high NO3 : DRP (274) and TN : TP (69 : 1) ratios relative to the average stoichiometric demand (16 : 1) of phytoplankton for productivity (Paerl et al. 1979; Wetzel 2001). Unless light limitation overrides nutrient limitation in Lake Brunner, a very swift response to increased P loading is expected by increased growth rates of phytoplankton rapidly assimilating available P entering the lake.
While Flint (1975) (in Paerl et al. 1979) reported Anabaena in Lake Brunner, Paerl et al. (1979) found no cyanophytes and found diatoms to dominate the phytoplankton. The low concentration of P compared with N probably prevents the occurrence of blooms of N-fixing cyanobacteria in Lake Brunner.
Bottom water temperature peaked around 1998–2000 and decreased since then, suggesting, in general, enhanced mixing and cooling during winters after 1999. The reason behind the maximum in bottom water temperature in 1998–2000 and reduced vertical mixing is probably the unusually warm air temperatures and sea surface temperatures occurring in the region at that time (Sutton et al. 2005). Decreased vertical mixing in 1998–2000 has also been observed in other New Zealand lakes (unpubl. data).
Conclusions
Increasing chlorophyll a concentrations since 1992 suggest increased algal productivity, probably due to increased nutrient inputs, indicating that land use may have deteriorated the water quality in the lake. The increased nutrient concentrations may be the result of an increase in the number of dairy cows and of enhanced drainage of dairy pasture in the catchment. Increased algal productivity is consistent with an apparent increase in the hypolimnetic oxygen depletion rate since 1992, suggesting that the amount of organic matter remineralised in the hypolimnion has increased. An estimated mean oxygen consumption in the hypolimnion of ~10–15 mg O2 m3 day–1 was consistent with an estimated primary productivity of 7 mol C m–2 year–1.
The critical mean TP concentration in the lake inflows that will cause the lake to shift from its current oligotrophic state to a mesotrophic state is 22.5 mg m–3, amounting to a 1.7-fold increase of the present rate of P loading, as suggested by the Vollenweider relationship based on residence time. Based on an estimated yield of 2.4 kg P ha–1 year–1 from the 16% high-producing exotic grassland in Lake Brunner’s catchment and 0.1 kg P ha–1 year–1 from the remainder (Rutherford et al. 2008), a change to a mesotrophic state would be brought about by a doubling of the area used by dairy farming, unless mitigations are successfully applied to substantially reduce the P yield from dairy farms.
TP and TN specific yields were highest in the Orangipuku River (0.93 kg P ha–1 year–1 and 21 kg N ha–1 year–1), the most intensively farmed catchment. Lake Brunner is vulnerable to changes in P loading, because of the large difference between the N and P concentrations relative to the stoichiometric demand of phytoplankton productivity. The two major streams draining dairy farms contribute 85% of the lake’s total P load. A monitoring study (Wilcock et al. 2013) has been underway in one of the dairying subcatchments of the Lake Brunner catchment since 2004. Results have shown very high catchment losses of P and N towards the lake that are well above average for intensively farmed land elsewhere in New Zealand. These losses are undoubtedly driven by the very high rainfall in the area (on average 3.8 m per year) and are likely enhanced by on-farm engineering to improve drainage. In view of the strong P limitation throughout the year in the lake, as suggested by N : P ratios, managing the P in the runoff from dairy farms is important for controlling algal productivity and the water quality of Lake Brunner.
Acknowledgements
This study was funded by two Envirolink Grants from the Ministry of Environment (748-WCRC66 and 886-WCRC776) and was based on research carried out in FRST program C10X0603 ‘Delivering Environmental Solutions for Sustainable Productivity Outcomes for New Zealand’s Pastoral Industries’. Further funding was received from MOBIE program C01X1002 ‘Aquatic Rehabilitation’. Sanjay Wadhwa prepared the land-use map. We thank Westland Milk Products for data of the number of dairy cows and milk solids produced since 2001 in the Lake Brunner catchment, and Brent Beadle, Jack Grinstead, Casey Beel, Steffi Henkel for help with data collection. Water samples were analysed by NIWA water quality laboratory in Christchurch until 2006 and by NIWA Hamilton since then.
References
Ahlgren, I., Frisk, T., and Kamp-Nielsen, L. (1988). Empirical and theoretical models of phosphorus loading, retention and concentration vs. lake trophic state. Hydrobiologia 170, 285–303.| Empirical and theoretical models of phosphorus loading, retention and concentration vs. lake trophic state.Crossref | GoogleScholarGoogle Scholar | 1:CAS:528:DyaL1MXhsl2jtrk%3D&md5=b1bc5503ea62d87678295f5828f56e75CAS |
Brown, S. (2004). Review of humping and hollowing on the West Coast. OPUS International Consultants Limited. Prepared for West Coast Regional Council, Reference 380145.00/005CP.
Burns, N.M., and Rutherford, J.C. (1998). Results of monitoring New Zealand lakes, 1992–1996. NIWA Client report for the Ministry for the Environment: MFE80216.
Davies-Colley, R. J., and Nagels, J. W. (2008). Predicting light penetration into river waters. Journal of Geophysical Research 113, G03028.
| Predicting light penetration into river waters.Crossref | GoogleScholarGoogle Scholar |
Flint, E. (1975). Phytoplankton in some New Zealand lakes. In ‘New Zealand Lakes’. (Eds V. H. Jolly and J. M. A. Brown.). pp. 163–192. (Auckland University Press/Oxford University Press.)
Gaiser, E. E., Deyrup, N. D., Bachmann, R. W., Battoe, L. E., and Swain, H. M. (2009). Multidecadal climate oscillations detected in a transparency record from a subtropical Florida lake. Limnology and Oceanography 54, 2228–2232.
| Multidecadal climate oscillations detected in a transparency record from a subtropical Florida lake.Crossref | GoogleScholarGoogle Scholar |
Kalff, J. (2003). ‘Limnology.’ 2nd edn. (Prentice Hall.)
Lind, W. T. (1986). The effect of non-algal turbidity on the relationship of Secchi depth to chlorophyll a. Hydrobiologia 140, 27–35.
| The effect of non-algal turbidity on the relationship of Secchi depth to chlorophyll a.Crossref | GoogleScholarGoogle Scholar | 1:CAS:528:DyaL2sXptV2n&md5=363fadb460c004c03e3a56d2a0ca5b87CAS |
Marsden, M. W. (1989). Lake restoration by reducing external phosphorus loading: the influence of sediment phosphorus release. Freshwater Biology 21, 139–162.
| Lake restoration by reducing external phosphorus loading: the influence of sediment phosphorus release.Crossref | GoogleScholarGoogle Scholar | 1:CAS:528:DyaL1MXlsF2lurc%3D&md5=bc3514f2e4c8764c31fec950447caa31CAS |
McDowell, R. W. (2008a). Phosphorus in humped and hollowed soils of the Inchbonnie catchment, West Coast. I: Variation with age and distribution. New Zealand Journal of Agricultural Research 51, 299–306.
| Phosphorus in humped and hollowed soils of the Inchbonnie catchment, West Coast. I: Variation with age and distribution.Crossref | GoogleScholarGoogle Scholar | 1:CAS:528:DC%2BD1cXhsFCrsr3E&md5=b2da5a2891014256739cf6ad008b78b0CAS |
McDowell, R. W. (2008b). Phosphorus in humped and hollowed soils of the Inchbonnie catchment, West Coast. II: Accounting for losses by different pathways. New Zealand Journal of Agricultural Research 51, 307–316.
| Phosphorus in humped and hollowed soils of the Inchbonnie catchment, West Coast. II: Accounting for losses by different pathways.Crossref | GoogleScholarGoogle Scholar | 1:CAS:528:DC%2BD1cXhsFCrsr3F&md5=7c4ac6cfef25b8598c6d886c37f4d885CAS |
Menneer, J. C., Ledgard, S. F., and Gillingham, A.G. (2004). Land use impacts on nitrogen and phosphorus loss and management options for intervention. Hamilton, AgResearch Client Report: 52.
Nichol, S. E., Harvey, M. J., and Boyd, I. (1997). Ten years of rainfall chemistry in New Zealand. Clean Air (Brighton) 31, 30–37.
Nürnberg, G. K. (1984). The prediction of internal phosphorus load in lakes with anoxic hypolimnia. Limnology and Oceanography 29, 111–124.
| The prediction of internal phosphorus load in lakes with anoxic hypolimnia.Crossref | GoogleScholarGoogle Scholar |
Paerl, H. W., Payne, G. W., Mackenzie, A. L., Kellar, P. E., and Downes, M. T. (1979). Limnology of nine Westland beech forest lakes. New Zealand Journal of Marine and Freshwater Research 13, 47–57.
| Limnology of nine Westland beech forest lakes.Crossref | GoogleScholarGoogle Scholar |
Quinn, J. M., Wilcock, R. J., Monaghan, R. M., McDowell, R. W., and Journeaux, P. (2009). Grassland farming and water quality in New Zealand. Tearmann: Irish Journal of Agricultural-Environmental Research 7, 69–88.
Rutherford, K., Chague-Goff, C., and McKerchar, A. (2008). Nutrient load estimates for Lake Brunner. NIWA Client Report for West Coast Regional Council, HAM2008-060.
Schouten, C. J. (1983). Budget of water and its constituents for Lake Taupo (New Zealand). In ‘Dissolved Loads of Rivers and Surface Water Quantity/Quality Relationships’. International Association of Hydrological Science 141, 277–297.
Spigel, R. (2008). Lake Brunner study: Modelling thermal stratification. NIWA Client Report for West Coast Regional Council, CHC2008-080.
Sutton, P. J. H., Bowen, M., and Roemmich, D. (2005). Decadal temperature changes in the Tasman Sea. New Zealand Journal of Marine and Freshwater Research 39, 1321–1329.
| Decadal temperature changes in the Tasman Sea.Crossref | GoogleScholarGoogle Scholar |
Timperley, M. H., Vigor-Brown, R. J., Kawashima, M., and lshigami, M. (1985). Organic nitrogen compounds in atmospheric precipitation: their chemistry and availability to phytoplankton. Canadian Journal of Fisheries and Aquatic Sciences 42, 1171–1177.
| Organic nitrogen compounds in atmospheric precipitation: their chemistry and availability to phytoplankton.Crossref | GoogleScholarGoogle Scholar | 1:CAS:528:DyaL2MXlvVegsLg%3D&md5=1d8fab46250250935aa74db52af40042CAS |
Vollenweider, R. A. (1976). Advances in defining critical loading levels for phosphorus in lake eutrophication. Memorie dell’Istituto Italiano di Idrobiologia 33, 53–83.
| 1:CAS:528:DyaE1cXktFemtA%3D%3D&md5=2dee373e25b24fcde01687668d00a4dbCAS |
Wetzel, R. G. (2001). ‘Limnology, Lake and River Ecosystems.’ 3rd edn. (Academic Press.)
Wilcock, R. J., Monaghan, R. M., Thorrold, B. S., Meredith, A. S., Betteridge, K., and Duncan, M. J. (2007). Land–water interactions in five contrasting dairying watersheds: issues and solutions. Land Use and Water Resources Research 7, 2.1–2.10.
Wilcock, R. J., Monaghan, R. M., McDowell, R. W., Verburg, P., Horrox, J., Chagué-Goff, C., Duncan, M. J., Rutherford, A., Zemansky, G., Scarsbrook, M. R., Wright-Stow, A. E., Howard-Williams, C., and Cotton, S. (2013). Managing pollutant inputs from pastoral dairy farming to maintain water quality of a lake in a high-rainfall catchment. Marine and Freshwater Research 64, 447–459.
| Managing pollutant inputs from pastoral dairy farming to maintain water quality of a lake in a high-rainfall catchment.Crossref | GoogleScholarGoogle Scholar |