

Long-term strategies for studying rare species: results and lessons from a multi-species study of odontocetes around the main Hawaiian Islands
Robin W. Baird A * , Sabre D. Mahaffy A , Brittany Hancock-Hanser B , Tori Cullins C , Kristi L. West D E , Michaela A. Kratofil A , Daniel M. Barrios A , Annette E. Harnish A and Paul C. Johnson F
A
B
C
D
E
F
Abstract
Funding agencies are often unlikely to fund research on rarely-encountered species and limited time is usually spent with such species when they are not the focus of research. Thus, knowledge of these species often lags behind their encounter rates.
To gain information on rarely-encountered odontocetes in Hawai‘i while simultaneously studying common ones.
During a long-term small-boat based study, we prioritised time spent with rarely-encountered species, collecting photos and biopsy samples, and satellite tagging. Sample sizes were augmented with photo contributions from members of the public and other researchers, and genetic samples from stranded animals and other researchers. Results from genetic and tag data analyses were interpreted in the context of social network placement and re-sighting histories.
Pygmy killer whales (Feresa attenuata) represented <2% of odontocete sightings, and sighting rates varied by depth and among islands. Photo-identification shows that 318 of 443 identified individuals are linked by association in the main component of the social network. Movements among islands were limited, with individuals off O‘ahu and Hawai‘i exhibiting high site fidelity, although resident groups from each island share a common mitochondrial haplotype. Three groups involved in mass strandings in two different years were not linked to the main component of the social network, and did not share mitochondrial haplotypes with known resident groups.
The approach of prioritising rarely-encountered species for additional sampling is an effective way of learning more about poorly-known species.
Such an approach may be critical for filling data gaps for populations potentially at risk from human activities.
Keywords: citizen science, Feresa attenuata, Hawai‘i, Lagenodelphis hosei, movements, mtDNA, population structure, pygmy killer whale, satellite tagging, Stenella coeruleoalba, stranding.
Ka Hōʻuluʻulu
Ka Pōʻaiapili. ʻAʻole paha e kākoʻo nā keʻena kālā i ka noiʻina i nā lāhulu e ʻike kākaʻikahi ʻia a ʻaʻole hoʻi nui nā hola e lilo ana i ka launa ʻana me ia mau lāhulu inā hoʻi ʻaʻole nō lākou ke kia o ka noiʻina. No laila, ʻoi loa aku ke emi o ka ʻike i ia mau lāhulu ma mua o ka nui o ka launa pū ʻana aku. Nā Pahuhopu. No ka loaʻa ʻana o ka ʻikepili o nā koholā niho ma Hawaiʻi ma ka wā hoʻokahi o ke kālailai ʻia ʻana o nā mea laha. Nā Kiʻina Hana. Ma ka noiʻi hikiāloa ma kekahi waʻapā, hoʻomakakoho mākou i nā hola e launa ana me nā lāhulu e ʻike kākaʻikahi ʻia, i ka ʻohi ʻana mai i nā kiʻi me nā hāpana ʻokina, a i ka hoʻolēpili ukali ʻana. Hoʻololi ʻia ka nui o nā hāpana i nā kiʻi i ʻohi ʻia mai ke kaiāulu a me nā kānaka noiʻi ʻē aʻe, a pēlā pū i nā hāpana ōewe o nā holoholona ili me nā kānaka noiʻi ʻē aʻe. Kālailai ʻia ka hopena o nā hāpana ōewe me nā wehewehena ʻikepili lepili i loko ka pōʻaiapili o ka hoʻonoho launa a me nā moʻokūʻauhau ʻike hou ʻana. Nā hua nui. Mai loko mai o nā ʻikena i nā koholā niho, ʻike ʻia nā koholā luku ʻiʻi (Feresa attenuata) he ʻuʻuku iho o ka ʻelua pākēneka, a kū ka pinepine o ka ʻike ʻia ʻana i ka hohonu a puni nā mokupuni. Hōʻike ʻia nā kiʻi, pili he 318 mai loko mai o ka 443 i ka ʻūmaupaʻa nui o ka hoʻonoho launa. ʻAʻole i nui ka holo ʻana i waena o nā mokupuni, hōʻike ʻia naʻe ke kū loa o nā mea ma kai aku o Oʻahu me Hawaiʻi i ka leo, like naʻe kekahi ōewe hoʻoilina i waena o nā pūʻulu noho o kēlā me kēia mokupuni. ʻAʻohe pilina o ʻekolu pūʻulu i pili i nā nuʻa ili o ʻelua makahiki ʻokoʻa i ka ʻūmaupaʻa nui o ka hoʻonoho launa, a ʻaʻole hoʻi i kaʻana like ʻia kekahi mau ōewe hoʻoilina me nā pūʻulu noho ʻike mua ʻia. Nā hopena. He kiʻina hana kūpono ka hoʻomakakoho ʻana i nā lāhulu ʻike kākaʻikahi ʻia no ka hāpana hou ʻana i mea e mōakāka hou aku ai ka ʻike no nā lāhulu laha ʻole. Nā panina manaʻo. He mea koʻikoʻi nō pha kēia ʻano kiʻina hana no ka hoʻopihapiha ʻana aku i nā ʻikepili kōā no nā lāhulu pā paha i nā hana kānaka.
Introduction
There have been incredible advances in the knowledge of many species and populations of cetaceans in the past 30 years, often identifying conservation threats or management needs. In some areas, the species studied have been those that have been easiest to study, particularly populations found in nearshore waters and/or that are easily spotted and followed. Studies on species such as humpback whales (Megaptera novaeangliae), grey whales (Eschrichtius robustus), common (Tursiops truncatus) and Indo-Pacific (T. aduncus) bottlenose dolphins, and killer whales (Orcinus orca), among others, have often involved multiple independent research organisations carrying out long-term dedicated field efforts combined with dozens of graduate students focusing on more detailed investigations. The predominant paradigm for research undertaken by graduate students and most other researchers involves single-species studies – why do humpback whales sing? How many spinner dolphins (Stenella longirostris) live around this island? This approach, focusing in increasing detail over time on just a single commonly-encountered species has advantages and disadvantages, but perhaps the biggest disadvantage to cetacean research, conservation, and management is that little time is often spent with less frequently encountered species when they are encountered and thus, knowledge of their biology, behaviour, ecology, and conservation needs have not advanced at a pace proportionate to their encounter rates.
However, by definition rare species are not encountered very often, so focusing on them when they are encountered imposes little lost opportunity cost for those studying more frequently-encountered species. For example, those studying humpback whales in the shallow and somewhat protected waters between the islands of Maui and Lānaʻi, Hawaiʻi, may have hundreds of humpback whale encounters each season, but only one or two false killer whale (Pseudorca crassidens) encounters during the same period. Thus, focusing some time and effort on the rarely-encountered species would result in little difference in the sample size available for humpback whale studies in a particular year, but potentially lead to identifying important conservation and management needs for false killer whales in the long term. However, obtaining funds to study rarely-encountered species is difficult; funding agencies typically want to fund work that results in some near-term gain in information, and rarely-encountered species are encountered so infrequently that few funding agencies can be convinced of the value of supporting such work.
So, what is the best way to collect information on some of these poorly-known and rarely-encountered species in a limited funding environment? Here, we discuss a long-term multi-species research effort undertaken in the Hawaiian Islands that has taken a different approach than the standard single-species paradigm. Baird et al. (2013b) laid out much of the background and details on this study, but not within the context of research focused disproportionately on rare species. The effort was originally started off Maui in 1999, an area with high encounter rates of humpback whales (and a long history of research on them, e.g. Tyack 1981) during winter months, and an easily-studied resident population of spinner dolphins (e.g. Bazúa-Durán and Au 2002; Stack et al. 2020). Some work was undertaken on these frequently-encountered species (e.g. Baird et al. 2000, 2001a). However, from the beginning our research effort has taken the approach that infrequently encountered species received a disproportionate amount of research attention even when a particular field project is focused on a more common species. This approach may not work well in the time frame of a typical graduate degree, with a student going out and collecting their own data for analysis. However, it has been remarkably effective at building up datasets that in the long run have provided hitherto unavailable insights into the behaviour and ecology of a number of both commonly- and rarely-encountered species, including providing a basis for many graduate degrees (e.g. Aschettino et al. 2012; Courbis et al. 2014; Mahaffy et al. 2015). Efforts to study rarely-encountered species have also benefited dramatically from contributions of photos obtained from members of the public that voluntarily help collect data, often referred to as citizen scientists. These include passengers and crew from tour operations, fishermen, and private recreational boaters. Slowly building up sample sizes of information on rarely-encountered species (e.g. of sightings, photographic identifications, biopsy samples, tagging data) through a combination of directed research and citizen science has, in the long-run, provided a basis for understanding many aspects of the behaviour and ecology of rarely-encountered species around the Hawaiian archipelago (see e.g. Baird 2016, 2019; Bradford et al. 2018).
Here, we provide more details on the history of this work, including the progression of species studied versus funding available. We provide an overall summary of the species encountered as well as an analysis of sighting rates in relation to depth for a number of rarely-encountered species, updating the results presented by Baird et al. (2013b) with an additional 10 years of sighting and effort data. We focus the majority of our results on one species, the pygmy killer whale (Feresa attenuata), to illustrate this approach for an extremely rarely-encountered species both in Hawaiian waters and worldwide. This species accounts for less than 2% of odontocete encounters, and is seen on average only two or three times per year in our field efforts. In addition to encounters from directed research (led by Cascadia Research Collective, CRC), much has been learned about this species from citizen science contributions. Here, we combine results from our work with this species with extensive contribution of photographs from citizen scientists and other researchers, and genetic analyses of both biopsy samples and samples from stranded animals, to update and expand on the results of McSweeney et al. (2009) and Baird et al. (2011a) in understanding this poorly-studied species (Baird 2018; Braulik 2018). We also outline lessons learned that could be applied to studies elsewhere, at least those in areas where there is more than a single species present.
Materials and methods
Study area(s), periodicity of field days, and research vessels
The study originally began around the islands of Maui and Lānaʻi in 1999, expanded to include waters off Kahoʻolawe in 2000 and Oʻahu and Hawaiʻi Island in 2002, and then expanded further to include waters off Kauaʻi and Molokaʻi in 2003. Initial field efforts based off Maui were undertaken periodically (e.g. weekly or bi-weekly) when weather forecasts suggested conditions for small-boat based field work were promising. Beginning in 2002 and continuing through February 2020 field work was undertaken in shorter periods typically ranging from 1 week to 6 weeks in duration with daily or almost daily field operations for the entire period (referred to as ‘dedicated field efforts’), with field operations during any particular period typically being undertaken off just one island or island area. In 2002 and 2003, field efforts off three or four island areas were undertaken consecutively one after another, but typically there were gaps of months between dedicated field efforts off different islands. In response to the COVID pandemic, starting in May 2020, field operations off Hawaiʻi Island were undertaken on a ‘rapid response’ basis when sightings of high priority species were reported to a Hawaiʻi Island-based team member; these efforts ranged from having multiple field days within a week to having a month or more between field days (Baird et al. 2023). In December 2020 dedicated field efforts were resumed as pandemic-related travel restrictions weakened, and were temporally interspersed with these rapid response efforts.
Research vessels used over the years have varied considerably. Primary research vessels have included outboard-powered Boston Whalers (5.8–8.2 m), although outboard powered rigid-hulled inflatables (primarily 7.3 m) are the preferred research platform, given the combination of speed, ability to comfortably carry sufficient personnel and gear, and safety if sea conditions deteriorate unexpectedly. A custom-made bow pulpit has been on or added to most primary research vessels used since 2004, providing an elevated platform for photography, biopsy sampling, and tagging (see below). On occasion, a larger live-aboard inboard-powered vessel was chartered for offshore (2006, 2008) or inter-island efforts (2003).
Funding and field research tools available
Funding for field efforts since February 2000 has included both funding for single field efforts (typically 1-year contracts or grants) and, starting in 2009, multi-year funding (2- or 3-year grants) that have allowed for multiple field projects. Funding in early years was primarily for single-species studies. In spring 2000, a small grant was received from the Hawaiian Islands Humpback Whale National Marine Sanctuary for a study of humpback whale diving (Baird et al. 2000), although during this project research was also undertaken on common bottlenose dolphins (hereafter bottlenose dolphins), as well as false killer whales, and pantropical spotted dolphins. The availability of photographs of bottlenose dolphins obtained during the humpback whale study led to funding to study bottlenose dolphins, first to collect additional photos for a between-year mark-recapture analysis (Baird et al. 2001b), and later to examine inter-island movements and population structure (Baird et al. 2009). Later, collection of photos of false killer whales encountered during field work funded to work with humpback whales, bottlenose dolphins, and other species, eventually led to funding to analyse the false killer whale photographic dataset (Baird et al. 2005) and then later funding to study them directly. Similarly, demonstrating the ability to collect samples or tag poorly-known species (e.g. Blainville’s (Mesoplodon densirostris) and Cuvier’s (Ziphius cavirostris) beaked whales in 2002; see Baird et al. 2006) prior to having any dedicated funds for that purpose then led to funding to directly study those same species (e.g. Baird et al. 2008a; Schorr et al. 2009). The number of field days per year was largely driven by available funding support, ranging from 98 days in 1999 to 17 days in 2007 (median = 55.5 field days per year).
Research tools available to the field team increased over time and with available funding. Most of the field research tools used involved in-house equipment for ongoing work (e.g. digital cameras, crossbow and biopsy gear). For the first 8 years of the effort, research tools were re-useable and relatively inexpensive. Photo-identification using single-lens reflex cameras (film cameras from 1999 through 2002 and digital thereafter) began in 1999 and has remained one of the primary field methods. In 1999 and continuing through 2008, suction-cup attached time-depth recorder (TDR)/VHF radio tags were used; tags and tracking equipment were purchased through grants provided to the lead author prior to 1999, but tags were recoverable and rarely lost. These tags were relatively inexpensive (a few thousand USD) and included a Wildlife Computers (Redmond, WA, USA) Mk6 or Mk9 TDR that recorded depth once per second, and the Mk6 TDR also included swim velocity. Biopsy sampling was added as a research tool in 2000 (operating at first under research permits issued to the Southwest Fisheries Science Center). Initially samples from bowriding individuals were collected with a pole spear, but we transitioned to collecting all samples using a crossbow (primarily Barnett RX-150) and Ceta-dart biopsy arrows and tips (8 mm external diameter), to allow for obtaining identification photos at the same time as sampling. Biopsy sampling has continued to be used as a primary research tool since. Efforts were made to photograph individuals that were biopsied, to be able to match samples to individuals that were later catalogued, although in early years when collecting some samples with a pole spear, or using film cameras, or when only a single photographer was on board (primarily prior to 2004), suitable quality photos were not always obtained.
In 2006 and continuing to date, remotely-deployed satellite tags were added as a research tool. Tags were initially deployed with a crossbow but we quickly switched to using a Dan-Inject pneumatic projector, due to increased accuracy. Tags used were Wildlife Computers SPOT5 and SPOT6 location-only tags or SPLASH10 location and depth recording tags, with all in the LIMPET (Low Impact Minimally Percutaneous External-electronics Transmitter) configuration. These tags anchor to the dorsal fin or just below the dorsal fin with two surgical-grade titanium darts, and the tag electronics are all external to the animal (Andrews et al. 2019). The implementation of such satellite tagging in Hawaiian odontocete research accelerated the rate of information gain on individual movements and habitat use; small boat survey efforts are mostly limited to protected leeward waters, and the satellite tags allowed us to observe animal movements outside of our surveyed range. In 2018, consumer level aerial drones were added as a research tool, first the personal drones of one of our volunteers (and later paid employees), and then (in 2020) one or more drones purchased specifically for field operations. Drones used have included DJI Mavic 2 Pro, and Mavic 3 Cine (in 2022), and have been particularly important in studying cryptic or difficult-to-approach species (e.g. Baird et al. 2022). Environmental DNA (eDNA) sampling was first used as a collaborative tool in 2017 and then added as an in-house tool in 2022.
Analytical tools have similarly included both in-house tools and those provided through collaborative efforts, the latter involving graduate students or other collaborators undertaking laboratory analysis of biopsy or eDNA samples or acoustic analyses (e.g. Van Cise et al. 2018; Apprill et al. 2020; Kratofil et al. 2020).
Personnel and day-to-day field operations
Waters around the main Hawaiian Islands are strongly influenced by predominantly easterly or north-easterly trade winds that typically increase throughout the day. Thus, very early morning hours are calmest, and the workable study area (i.e. areas with sea conditions of Beaufort 3 or less, see below) shrinks throughout the day. Depending on the size and height of the island (and thus the expected size of the lee), the study area may become unworkable (i.e. >Beaufort 3 conditions) from mid (Kauaʻi) to late (Oʻahu, Lānaʻi) morning, to early afternoon (Hawaiʻi). Thus, field operations typically began at or slightly before dawn, and the duration of daily survey efforts were dependent on actual wind conditions. Given the expected low density of most species in the oligotrophic waters surrounding the main Hawaiian Islands, instead of following pre-determined parallel or zig-zag survey tracklines typical for line-transect surveys, field operations were generally undertaken in a way to maximise encounter rates with a diversity of species, while generally remaining in areas where small-boat operations could be effectively undertaken, and with efforts made to minimise spatial biases. Several strategies were used to minimise spatial biases. Within a particular directed field effort, efforts were made to minimise overlap of survey tracklines (retained on the GPS throughout a field effort). When possible, the direction of survey effort (e.g. north or south of the harbour) was alternated, and the depth range surveyed when travelling away from the harbour versus when travelling back to the harbour was alternated (e.g. when heading south on one day the vessel might remain within the 500–800 m depth range and when heading back north it might remain within the 1800–2200 m depth range, whereas on the next day, it would transit south in relatively deep water and north in relatively shallow water). On days when the weather forecasts suggested the trade winds would fail or reverse direction, efforts were made to survey in areas that were not typically workable, thus maximising the spatial extent of survey efforts. With some exceptions, this has resulted in field research primarily being undertaken on the west and south-west sides of the islands, but around some islands during some field projects (particularly Kauaʻi and Niʻihau) surveying around all sides of the islands.
Field work was undertaken with three to seven individuals (driver, photographer(s), data recorder, observers, and volunteers). Volunteers have included graduate and undergraduate students, captains, naturalists and crew from tour operations (primarily dolphin and whale watching tours), other biologists, educators, local fishermen, and individuals involved in marine or terrestrial conservation or management organisations. Volunteers have often transitioned into long-term crew and have provided important bridges to local communities and contributed to encouraging citizen science contributions (see below).
During each field day, effort locations were logged on a GPS at either 10-min intervals (1999) or 5-min intervals (all other years). Beaufort sea state was noted at the start of the day and as it changed throughout the day. The research vessel typically transited at 15–25 km h−1, with observers scanning 360 degrees around the vessel, as the goal was to maximise encounter rates. With the exception of humpback whales in nearshore waters during the main months of humpback season (February–March), all cetacean species observed were approached for species identification, group size estimation (minimum, best, maximum), recording of locations, behaviour (see Supplementary Table S1), and direction of travel (at the start and end of the encounter), the number of neonates (individuals < half the length of the mother with fetal folds visible), and group envelope (the maximum horizontal spread of the group in two dimensions). With the exception of false killer whales (see Baird et al. 2008b), groups of a single species were defined based on an 800 m chain rule, with any individuals within 800 m of any other individuals considered part of the same group. When more than one species was present, whether individuals of the two species were intermingled (i.e. mixed) or were adjacent but separate (i.e. not mixed) was recorded. Reactions to approaches (e.g. avoidance) was noted, including the number of individuals reacting and the estimated distance that individuals reacted. For rare and/or difficult-to-identify species, photographs were taken for species and individual identification. For more commonly-encountered species, photographs were taken for individual identification depending on the particular goals of each field effort. Sighting cue was recorded as one of: splash/blow/fin, birds, radio call, fishing vessel (see Baird and Webster 2020), radio or satellite tag (for a subset of previously tagged individuals that were relocated with information from the tag), or acoustic detection (for sightings that occurred in response to direction from researchers monitoring the hydrophone range at the Pacific Missile Range Facility, located between Kauaʻi and Niʻihau – see Jarvis et al. 2019). Other environmental information (e.g. sea birds, bait schools, the number of game fish, tour vessels, fishing vessels) were also recorded.
Calculations of sighting rates by species in relation to depth (i.e. sightings per 100 h of effort within particular depth bins, updating the analyses presented by Baird et al. (2013b) were restricted to those cued either by birds or by splash/blow/fin.
Photo-identification catalogues and association analyses
Photo-identification catalogues were established in 1999 for bottlenose dolphins, false killer whales, and spinner dolphins, based on photos obtained during directed research operations. Catalogues were later established for killer whales, short-finned pilot whales (Globicephala macrorhynchus), Risso’s dolphins (Grampus griseus), pygmy killer whales, rough-toothed dolphins (Steno bredanensis), pantropical spotted dolphins (Stenella attenuata), melon-headed whales (Peponocephala electra), Blainville’s beaked whales, Cuvier’s beaked whales, and dwarf sperm whales (Kogia sima), as well as sei (Balaenoptera borealis) and fin (B. physalus) whales. Photos of other species (e.g. sperm whales (Physeter macrocephalus), humpback whales, whale sharks (Rhincodon typus)) were contributed to regional catalogues run by other researchers. In addition to photos obtained during efforts beginning in 1999, photos were also contributed to CRC catalogues by a researcher working off Hawai‘i Island since the mid 1980s (see McSweeney et al. 2007, 2009), thus the earliest photos in many catalogues are from prior to 1990. Catalogues were also supplemented starting in the early 2000s with photographs from other researchers taken opportunistically while working off Maui with humpback whales, but as digital SLR cameras became more available in the mid 2000s, we began receiving photos taken by captains, naturalists, and crew onboard commercial dolphin and whale watching vessels, as well as other researchers working among the islands, filling important spatial and temporal gaps in catalogues. Citizen science contributions to catalogues were encouraged through local contacts, public presentations, and more recently through social media.
Details on photo-identification methodology have been previously published (e.g. Baird et al. 2009; Mahaffy et al. 2015) so are only briefly summarised here. Individuals are sorted within each encounter and the best photo of an individual within each encounter is assigned a photo quality (PQ) rating: (1) poor; (2) fair; (3) good; and (4) excellent. The distinctiveness (D) of each individual was rated as: (1) not distinctive; (2) slightly distinctive; (3) distinctive; and (4) very distinctive (Fig. S1). Various levels of restrictions in photo quality and distinctiveness are applied to analyses depending on the purpose. For abundance estimation analyses were restricted to D ≥ 3 and PQ ≥ 3 (e.g. Bradford et al. 2018; Van Cise et al. 2021). For the example presented here, with pygmy killer whales, we restricted analyses to individuals that had PQ ≥ 2 and D ≥ 2 at some point in their encounter history, following the approach with other rarely-encountered species (Baird et al. 2022; Mahaffy et al. 2023). Information on long-term re-sightings of pygmy killer whales uses the unrestricted photo-identification dataset (i.e. starting in 1986; see McSweeney et al. 2009), although for social network and inter-island movement analyses, we restricted analyses to photos obtained starting in 1999, when photos were available from more than one island area. Photos available through 2021 were included in analyses. For the purposes of comparing sighting rates and CRC effort throughout the islands, four strata were considered: Kauaʻi and Niʻihau; Oʻahu; Maui Nui (including sightings off Molokaʻi, Lānaʻi, and Maui); and Hawaiʻi Island. There were no CRC encounters with pygmy killer whales >45 km from shore, but for pygmy killer whale photo-identification results including sightings from other researchers, an ‘offshore’ strata (>45 km from shore) was included.
Association analyses were undertaken using SOCPROG 2.9 (Whitehead 2009) and in R ver. 4.2.2 (R Core Team 2022), using a half-weight index (Cairns and Schwager 1987). Individuals were considered associated if they were sighted in the same group. To determine the number and membership of social clusters (see Mahaffy et al. 2023) we used modularity optimisation (Girvan and Newman 2002; Newman and Girvan 2004), which maximises within-cluster rates of association and minimises those between clusters. For the R-based analyses, we used the Louvain clustering algorithm within the ‘igraph package’ (ver. 1.3.5), which takes an agglomerative approach to modularity optimisation, and has performed well during previous analyses of odontocete datasets (Csardi and Nepusz 2006; Blondel et al. 2008; Mahaffy et al. 2023). As modularity (Q) is artificially inflated in sparsely sampled networks, cluster analyses were restricted to the main component (i.e. the largest component) of the social network, restricted to individuals seen two or more times with PQ ≥ 2 and D ≥ 2 at some point in their sighting history. Social network diagrams were created in Netdraw 2.176. For the purposes of describing the distribution of mitochondrial haplotypes and assessing inter-island movements, the main component of the social network was considered in two halves, with those individuals first documented off Oʻahu part of the Oʻahu main component (OAMC), and those first documented off Hawaiʻi island part of the Hawaiʻi Island main component (HIMC).
Tag programming, data processing, and analyses
Tags were typically programmed to transmit from 10 to 12 h per day, corresponding to periods with good satellite coverage. SPLASH10 tags also transmitted behaviour logs, which included information on the start time, depth, and duration of dives greater than a pre-defined depth (in the case of pygmy killer whales, 30 m), as well as the duration of “surface” periods (i.e. periods where the tagged individual did not dive below the pre-defined dive depth). Data from two tags deployed on pygmy killer whales in 2008 and 2009 have been previously published (Baird et al. 2011a), although location data were least-squared processed by Argos. Since then, we have re-processed data from those two tags and obtained additional tag data that were Kalman-processed, providing an increased sample size and better characterisation of location accuracy (Lopez et al. 2015). Tag data protocols were recently summarised by Kratofil et al. (2023) and readers are referred to that publication for details. Briefly, tag data were processed through the Distance-Angle-Rate filter of the Douglas-Argos filter (Douglas et al. 2012) to remove erroneous locations based on unrealistic travel speed and turning angles. Processed locations were then fit to a continuous-time correlated random walk model (‘crawl’ package; Johnson et al. 2008; Johnson and London 2018) in R to produce predicted locations at 1-h time intervals. Resultant locations were re-routed around land using ‘pathroutr’ (London 2020). Depth and distance from shore of final locations were then determined and compared for day and night-time periods based on solar angles. Seafloor depth was extracted from the 50-m Main Hawaiian Islands Multibeam Bathymetry Grid1 using the ‘stars’ package (Pebesma and Bivand 2023), and distance from shore was calculated using the ‘sf’ package (Pebesma 2018).
Genetic analyses of pygmy killer whales
In addition to biopsy samples collected during CRC research efforts (n = 20), skin samples were available from samples collected during Southwest Fisheries Science Center (SWFSC, n = 3) and Pacific Islands Fisheries Science Center (PIFSC, n = 1) cruises, sloughed skin from a suction-cup attached tag (n = 1), and from stranded animals (n = 8) collected through the Pacific Islands Marine Mammal Stranding Response Network. Skin samples were stored in the NMFS Marine Mammal and Sea Turtle Research Collection (MMASTR) housed at the SWFSC. Samples were either stored in a −80°C freezer with no preservative, or fixed in a salt-saturated 20% DMSO solution or ethanol and archived in a −20°C freezer. Samples were collected between 2002 and 2019.
Genomic DNA was extracted using a sodium chloride precipitation protocol (Miller et al. 1988), Qiagen DNeasy Blood and Tissue Kit (#69506, Qiagen, Germantown, MD, USA) or a phenol-chloroform protocol (Sambrook et al. 1989). The 5′ end of the hypervariable mitochondrial DNA (mtDNA) control region was amplified and sequenced in two parts. The PCR cycling profile started at 90°C for 2.5 min, followed by 35 cycles of 94°C for 45 s, between 48°C and 60°C for 1 min (depending on the sample), and 72°C for 1.5 min. The final extension was 72°C for 5 min. The first fragment was amplified and sequenced in both directions using primers H16498 (5′-CCTGAAGTAAGAACCAGATG-3′, Rosel et al. 1994, and L15829 (5′-CCTCCCTAAGACTCAAGG-3′, developed at SWFSC). Fragment two was amplified and sequenced in both directions using primers H497 (5′-AAGGCTAGGACCAAACCT- 3′) and L16218 (5′-TGGCCGCTCCATTAGATCACGAGC- 3′) (both developed at the SWFSC). Sequencing was completed according to the recommended protocols for Big Dye Terminator sequencing on the Applied Biosystems Inc. (ABI, Foster City, CA, USA) model 377, 3100 and 3730 sequencers. The resulting combined sequence was assembled using Sequencher (ver. 4.1 and 4.8; Gene Codes, Ann Arbor, MI, USA) or Geneious (ver. 6.1.5, 7, 0, 8.0.1, and Prime; Biomatters Ltd, Auckland, New Zealand) software. The resulting sequences were 960 base pairs long, but were trimmed to 671 base pairs for comparison to sequences generated for a global study (Hancock-Hanser, unpublished). Sequences were aligned with a MAFFT alignment in the Geneious software package. Haplotypes representing single samples and those with a single nucleotide change were reviewed for accuracy.
We used a real time PCR assay (Stratagene) on the zinc finger (ZFX and ZFY) genes (Morin et al. 2005) to genetically determine the sex of biopsied individuals. In the case of pygmy killer whales, sex of adult males was also determined for some individuals based on the presence of a post-anal keel, visible in underwater photos (McSweeney et al. 2009).
Results
Sightings and effort
CRC field efforts were undertaken on a total of 1389 days over a 24-year period, with effort off different island areas spanning from 6 to 21 years (Table 1). Differences in effort among island areas reflected a combination of funding support and the area best suited to accomplish primary funding goals. More than 50% of our total field days were off Hawaiʻi Island, with effort each year from 2002 through 2022. Field efforts were concentrated off Hawaiʻi Island as it has the largest lee and greatest access to deep (>2000 m) waters, thus is the best location for finding and working with species that are primarily found in deep water. The island with the least amount of effort was Oʻahu, both in terms of number of years (2002–2017) and number of field days (83). While there were fewer survey days off Kauaʻi and Niʻihau than off Maui Nui, surveys were undertaken in more years (Table 1), with most timed to occur prior to Navy exercises off the Pacific Missile Range Facility.
| Island area A | # years surveyed | # days effort | # km effort | Years first/last surveyed | # pygmy killer whale sightings | # pygmy killer whale sightings in sighting rate calculations | Sightings per 1000-km effort | |
|---|---|---|---|---|---|---|---|---|
| Kauaʻi/Niʻihau | 14 | 229 | 24 224 | 2003–2022 | 3 | 2 | 0.12 | |
| Oʻahu | 6 | 83 | 9626 | 2002–2017 | 8 | 6 | 0.77 | |
| Maui Nui B | 10 | 269 | 26 410 C | 1999–2020 | 2 | 1 | 0.26 | |
| Hawaiʻi | 21 | 808 | 97 438 | 2002–2022 | 50 | 32 | 0.43 | |
| Total | 24 | 1389 | 157 698 | 1999–2022 | 63 |
Sighting rates (per 1000-km of effort) are only calculated for effort between 500 m and 2500 m for each area, to account for variability in areas surveyed.
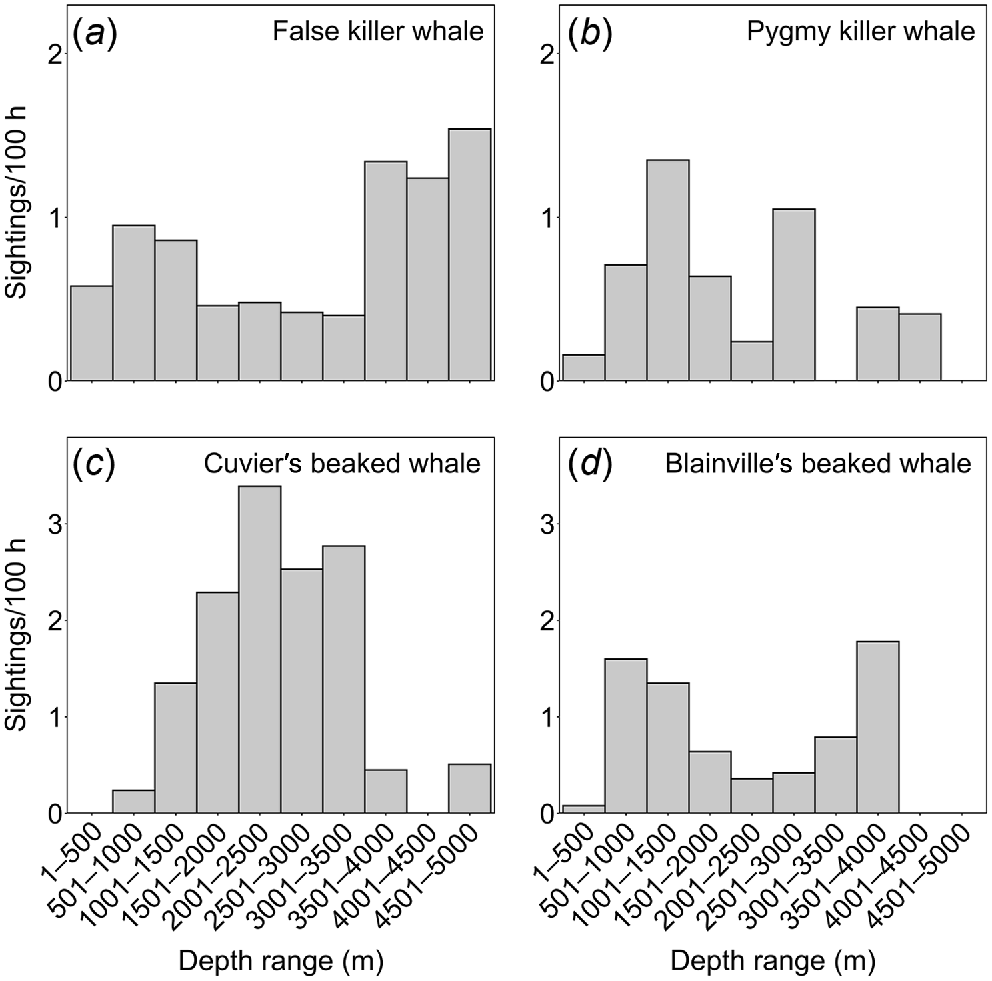
Overall, we had 3666 encounters with 18 identified species of odontocetes between 1999 and 2022. For just the subset of sightings cued either by birds or by a “splash, blow, or fin”, there were 3157 sightings of 17 species. Sighting rates of this subset by depth showed that some species were found at higher rates in very deep water (e.g. Fraser’s dolphins (Lagenodelphis hosei), sperm whales, striped dolphins (Stenella coeruleoalba); Fig. 1), some were found in mid-water depths (e.g. Cuvier’s beaked whales), and some were found over a wide range of depths (e.g. Blainville’s beaked whales, false killer whales, pygmy killer whales, Fig. 2), some with multiple peaks in sighting rates in relation to depth.
Survey effort (a) and sighting rates in relation to depth (sightings per 100-h effort) for three deep-water species: (b) Fraser’s dolphins; (c) sperm whales; and (d) striped dolphins), suggesting they are all from open-ocean populations. The number of sightings of each species used in analyses is in Table 2 (# sightings subset).
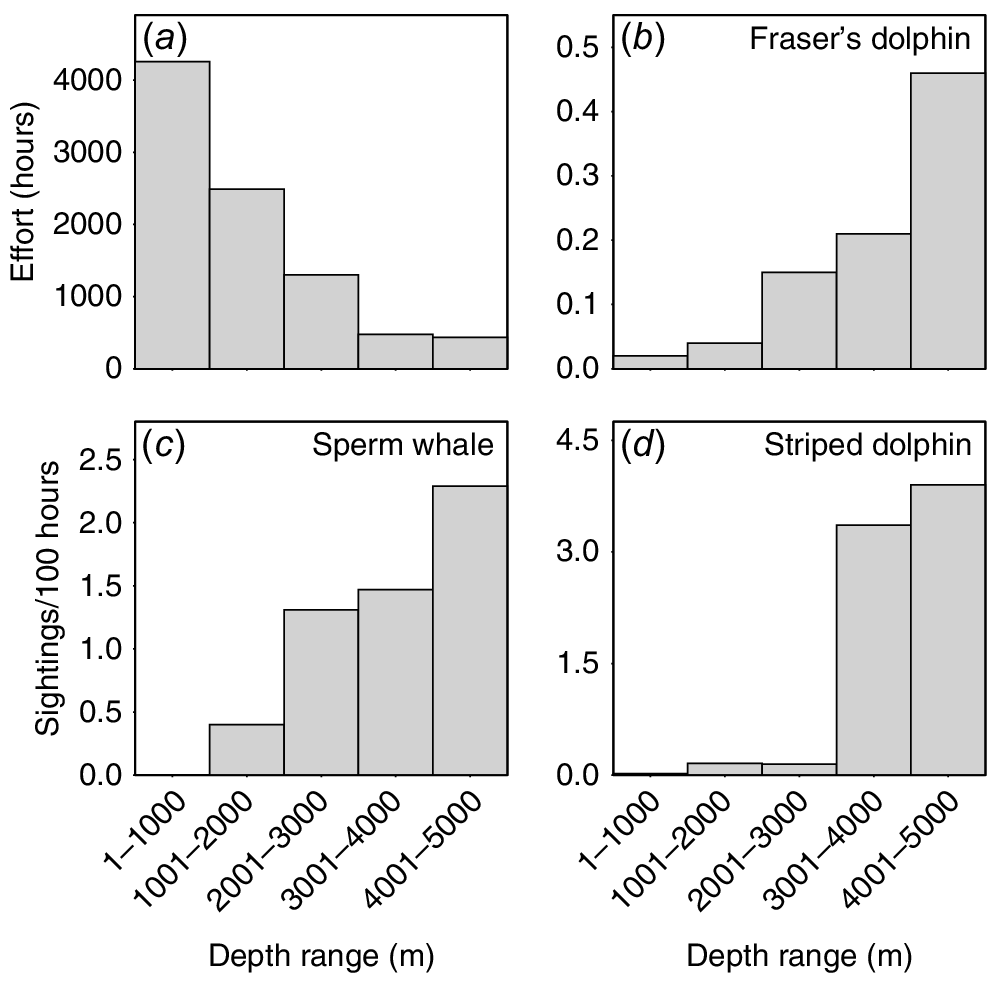
Sighting rates in relation to depth (sightings per 100-h effort) for four mid-water species. Bimodal distributions reflect detections of both island-associated and open-ocean populations for (a) false killer whales, (d) Blainville’s beaked whales, and likely (b) pygmy killer whales, while the unimodal distribution for (c) Cuvier’s beaked whales appears to reflect a single island-associated population. The number of sightings of each species used in analyses is in Table 2 (# sightings subset).
Pygmy killer whales
We encountered pygmy killer whales on 63 occasions from 1999 to 2021, representing just 1.68% of sightings (Table 2) after excluding encounters in response to radio calls, etc. Encounter duration ranged from 3 min (when a group was lost quickly) to 4 h and 43 min (median = 43 min). Estimated group sizes ranged from 2 to 40 individuals (median = 12, mean = 12.6, s.d. = 8.1). When groups were small (i.e. <10), they were typically spread over a small area (median group envelope of 20 × 80 m, n = 22). Larger groups were typically more widely spaced (median group envelope of 125 × 350 m, n = 34). Behaviour at the start of the encounter was recorded for 62 of 63 encounters, with the most frequently recorded behaviour being milling (28 encounters), followed by slow travel (21 encounters), travel (six encounters), logging and resting (four encounters), foraging (two encounters), and social behaviour with pilot whales (one encounter). It is important to note however that behavioural categories were not always mutually exclusive (e.g. behaviour categorised as milling may include social behaviour or resting). Avoidance of the research vessel was noted in 60% of encounters. Avoidance distance was estimated for 36 encounters, and ranged from 12 to 100 m (median = 30 m). Avoidance reactions typically involved slowly turning away from the vessel or diving as the vessel approached, not a rapid avoidance response as is typically seen with Fraser’s and striped dolphins. Although the presence or absence of bowriding behaviour was only systematically recorded starting in 2015, it was documented in 37.5% of the encounters (six of 16) since 2015. Associations with other species were documented in 10 encounters, although they were only considered as mixed groups in six encounters. These mixed species groups included short-finned pilot whales (four encounters), rough-toothed dolphins (one encounter), and humpback whales (one encounter). Neonate pygmy killer whales were only documented on four occasions, all between September and December. Pygmy killer whales were encountered in depths ranging from 119 m to 4419 m (median = 1269 m). When sighting rates are corrected for effort (Fig. 2), there is a peak in density along the island slope (500–1500 m depth) and in deeper water (2500–3000 m depth), with relatively high rates in depths from 3500 to 4500 m. Although they were encountered off all islands (Table 3, Fig. 3), sighting rates were more than six times higher off Oʻahu than off Kauaʻi/Niʻihau, and more than three times higher off Hawaiʻi Island than off Kauaʻi/Niʻihau (Table 1).
| Species | # sightings | % of sightings | # sightings subset | % subset | # LIMPET tags with location data | # LIMPET tags with dive data | # biopsy samples | |
|---|---|---|---|---|---|---|---|---|
| Short-finned pilot whale | 860 | 24.46 | 758 | 24.01 | 153 | 51 | 297 | |
| Pantropical spotted dolphin | 681 | 18.85 | 627 | 19.86 | 8 | 1 | 297 | |
| Rough-toothed dolphin | 519 | 14.16 | 440 | 13.94 | 23 | 13 | 188 | |
| Common bottlenose dolphin | 438 | 11.95 | 376 | 11.91 | 29 | 15 | 211 | |
| Spinner dolphin | 377 | 10.28 | 277 | 8.77 | 0 | 0 | 113 | |
| False killer whale | 124 | 3.38 | 72 | 2.28 | 85 | 9 | 218 | |
| Melon-headed whale | 110 | 3.00 | 88 | 2.79 | 33 | 13 | 181 | |
| Dwarf sperm whale | 99 | 2.70 | 97 | 3.07 | 0 | 0 | 0 | |
| Cuvier’s beaked whale | 97 | 2.65 | 97 | 3.07 | 15 | 4 | 7 | |
| Blainville’s beaked whale | 75 | 2.05 | 66 | 2.09 | 22 | 4 | 28 | |
| Pygmy killer whale | 63 | 1.72 | 53 | 1.68 | 6 | 1 | 20 | |
| Sperm whale | 52 | 1.42 | 44 | 1.39 | 12 | 4 | 17 | |
| Striped dolphin | 44 | 1.20 | 41 | 1.30 | 0 | 0 | 0 | |
| Unidentified odontocete | 37 | 1.01 | 35 | 1.11 | 0 | 0 | 0 | |
| Unidentified dolphin | 24 | 0.65 | 24 | 0.76 | 0 | 0 | 0 | |
| Risso’s dolphin | 18 | 0.49 | 17 | 0.54 | 1 | 0 | 0 | |
| Kogia sp. | 15 | 0.41 | 15 | 0.48 | 0 | 0 | 0 | |
| Unidentified beaked whale | 11 | 0.30 | 10 | 0.32 | 0 | 0 | 0 | |
| Pygmy sperm whale | 8 | 0.22 | 8 | 0.25 | 0 | 0 | 0 | |
| Fraser’s dolphin | 7 | 0.19 | 7 | 0.22 | 0 | 0 | 2 | |
| Killer whale | 6 | 0.16 | 5 | 0.16 | 4 | 0 | 2 | |
| Longman’s beaked whale | 1 | 0.03 | 0 | 0 | 0 | 0 | 0 | |
| Total | 3666 | 3157 |
The subset of sightings includes those with either birds or “splash/blow/fin” as the cue.
| Island area | # encounters (no restrictions) | # identifications | # individuals | # individuals seen > 1 day within-area | # individuals seen > one area | |
|---|---|---|---|---|---|---|
| Offshore | 4 | 32 | 32 | 0 | 0 | |
| Kaua‘i/Ni‘ihau | 3 | 32 | 32 | 0 | 0 | |
| O‘ahu | 112 | 805 | 131 | 64 | 25 | |
| Maui Nui | 17 | 75 | 55 | 15 | 18 | |
| Hawai‘i | 112 | 806 | 221 | 87 | 17 | |
| All Areas | 248 | 1750 | 443 A | – |
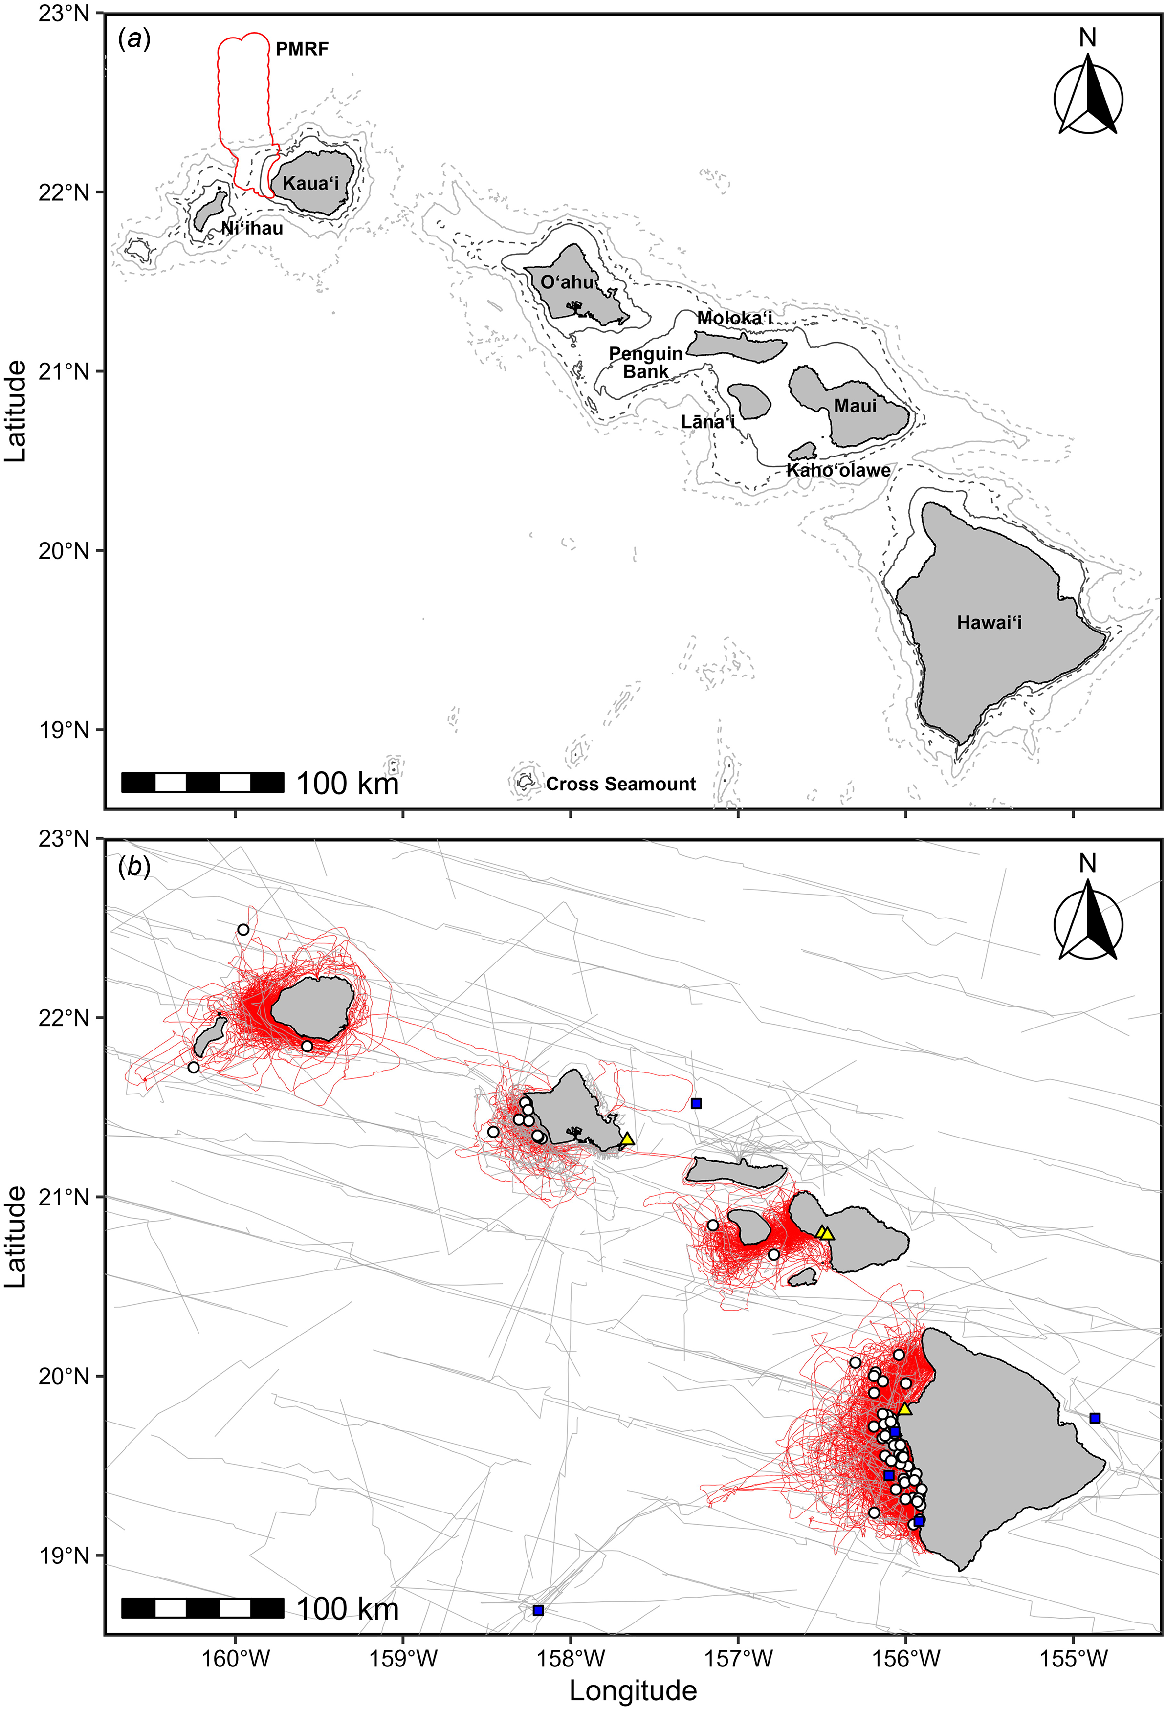
Hawai‘i study area (a) showing bathymetry (500 m, 1000 m, 2000 m, 3000 m) and place names mentioned in text. The Pacific Missile Range Facility (PMRF) boundary is marked in red. (b) Pygmy killer whale sightings (CRC, white circles; PIFSC/SWFSC, blue squares) and strandings (yellow triangles) overlaid on survey effort (CRC, red lines; PIFSC, grey lines). Three genetic samples were available from the sighting on Cross Seamount, from all of the strandings, and from encounters off O‘ahu and Hawai‘i Island. See text for abbreviations.
Photographs of pygmy killer whales meeting photo quality and distinctiveness criteria were available from CRC (59 encounters, 652 identifications), citizen science contributors (168 encounters, 959 identifications), and other researchers (22 encounters, 139 identifications). From these, there were 1750 identifications representing 443 individual pygmy killer whales that were considered at least slightly distinctive. Almost all of the identifications (1612, 92.4%) were from the main component of the social network, and the majority of individuals (318, 71.8%) linked by association in the main component of the social network (Fig. 4), which included individuals sighted off Oʻahu, Lānaʻi, north of Molokaʻi, and Hawaiʻi Island.
Social network of pygmy killer whales photo-identified in Hawaiian waters, restricted to individuals with at least fair quality photos that were at least slightly distinctive at some point in their encounter history. Black circles around points indicate individuals documented off more than one island area, with the colour indicating the island or area first documented or seen most often: pink, Hawai‘i; white, O‘ahu; black, Lāna‘i, Maui, or Moloka‘i; light blue, Kaua‘i or Ni‘ihau; green, offshore. Mitochondrial haplotypes are labelled (FA##), while tagged individuals are indicated by triangles with tag # indicated (FaTag###). The two isolated points in the upper left with haplotype information are from lone strandings (Table 4).
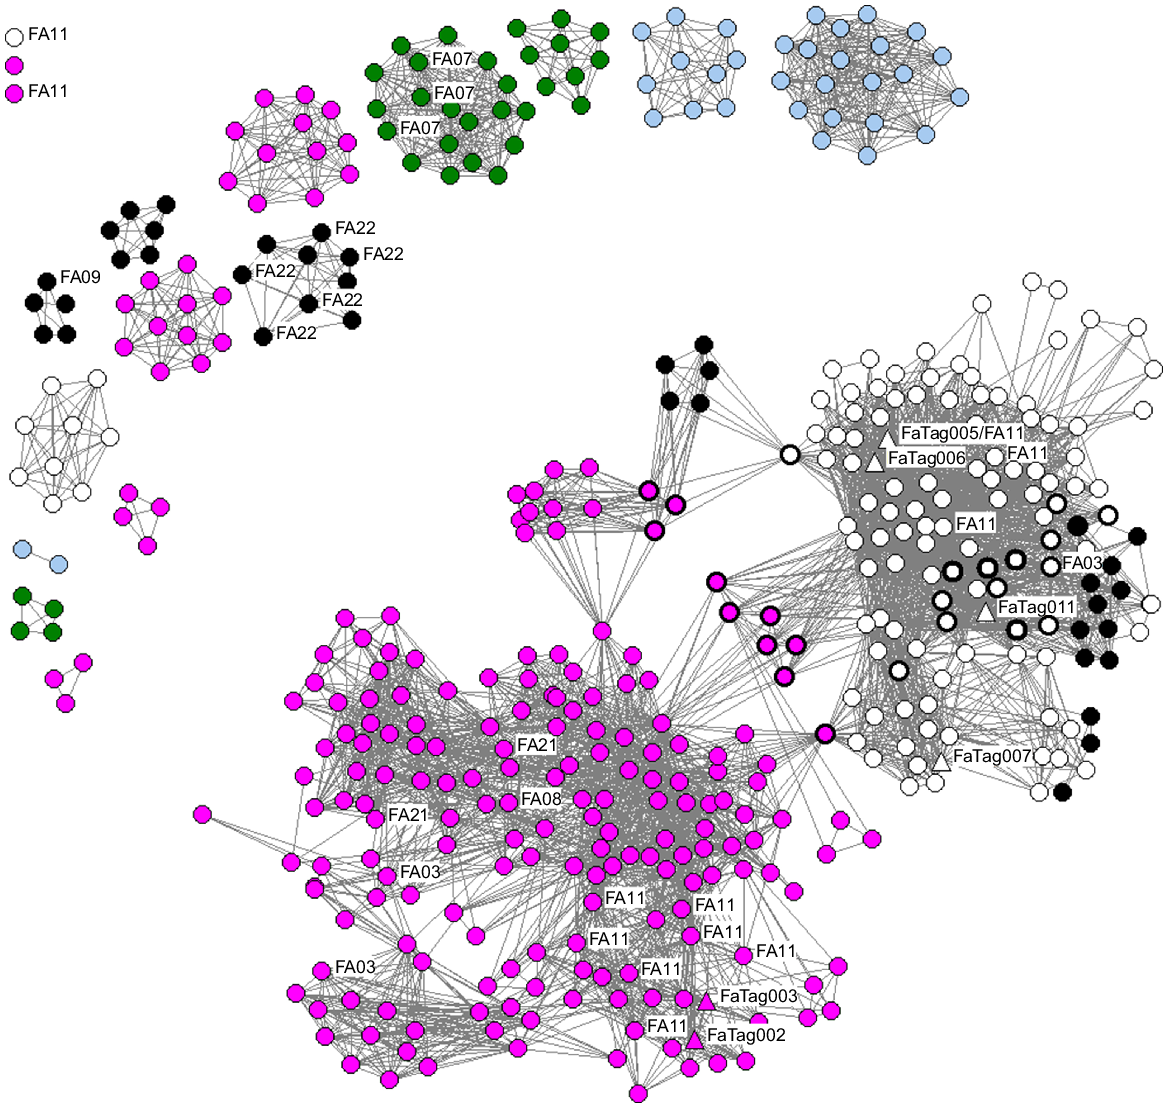
The Louvain algorithm identified eight social clusters within the main component of the social network, consisting of five to 34 individuals (median = 20, modularity = 0.64, Fig. S2). Re-sightings of individuals were not evenly distributed among the 318 individuals in the main component – only 161 (50.6%) were seen on more than 1 day. Of those 161, the mean number of days and years documented was 10.8 days (s.d. = 13.8 days) and 5.2 years (s.d. = 4.4 years). The maximum number of days an individual was documented was 60, with sightings in 14 different years. Cluster 1 (from Hawai‘i Island) and Cluster 2 (from O‘ahu) had the highest re-sighting rates. The 22 individuals from Cluster 1 were seen on from 3 to 49 days (median = 29 days) in from 1 to 20 years (median = 12.5 years), over spans ranging from <1 to 31.8 years (median = 13.8 years). The 33 individuals from Cluster 2 were seen on from 2 to 60 days (median = 20 days) in from 1 to 15 years (median = 6.0 years), over spans ranging from 0.7 to 13.8 years (median = 7.2 years). It should be noted that photos are only available from O‘ahu from July 2007 to September 2021; thus, the maximum that Cluster 2 individuals could have been seen, in theory, was 14.1 years.
The 125 individuals not connected to the main component of the social network were found in 16 isolated components ranging in size from 1 to 20 individuals (Fig. 4) and were represented by 138 identifications. Two of the isolated components were represented by just a single individual each (Fig. 4). One of these was a stranded individual from Oʻahu that had not been previously documented, and the other was from a sighting off the east side of Hawai‘i Island where only a single individual was photographed. Re-sightings of individuals were only documented in three of the isolated components, and were all of individuals seen in shallow waters off Ma‘alaea Bay, Maui, with some individuals from each of these groups involved in strandings (see below). These were the only individuals photographed off Maui (20 individuals total involved in separate stranding events in May 2009, August 2019, and September 20192).
All of the individuals documented offshore or off Kauaʻi or Niʻihau were in isolated components (i.e. they did not link to the main component of the social network). By contrast, of the 132 documented off Oʻahu, 123 (93.2%) linked by association to the main component of the social network; only a single encounter (with nine identified individuals) did not link to the main component (Fig. 4). Off Hawaiʻi Island, 187 of the 218 individuals (85.8%) were linked to the main component of the social network, with five encounters (with from 1 to 12 individuals photo-identified) not linked by association. All 26 individuals documented at sea off Lānaʻi, from three different encounters, were linked to the main component of the social network.
Genetic samples were available from 24 biopsies of free-ranging individuals, sloughed skin from one suction-cup attached tag3, and samples from eight stranded individuals, including the May 2009 Maui stranding (n = 1 sample), the August 2019 Maui stranding (n = 5 samples), and single strandings from Oʻahu (in 2006) and Hawaiʻi Island (2015). Photos to confirm the identity of sampled individuals were available for 29 of the 33 samples, with all representing different individuals (Table 4). Eight haplotypes were documented among these 33 samples. These haplotypes were spread across the median joining network for samples throughout the Pacific (not shown), and are also shared by animals from Guam and California (unpubl. data).
| ID | Social network position | Cluster | Haplotype | Sex | Island or area | Comments | |
|---|---|---|---|---|---|---|---|
| HIFa251 | Isolated | IC#1 | FA11 | F | O‘ahu | July 2006 lone stranding | |
| HIFa413 | Isolated | IC#2 | FA09 | M | Maui | May 2009 stranding | |
| HIFa780 | Isolated | IC#3 | FA11 | F | Hawai‘i | May 2015 lone stranding | |
| HIFa730 | Isolated | IC#4 | FA22 | F | Maui | August 2019 stranding | |
| HIFa731 | Isolated | IC#4 | FA22 | F | Maui | August 2019 stranding | |
| HIFa736 | Isolated | IC#4 | FA22 | M | Maui | August 2019 stranding | |
| HIFa737 | Isolated | IC#4 | FA22 | F | Maui | August 2019 stranding | |
| HIFa740 | Isolated | IC#4 | FA22 | M | Maui | August 2019 stranding | |
| HIFa497 | Isolated | IC#5 | FA07 | U | Cross Seamount | Seen once | |
| HIFa500 | Isolated | IC#5 | FA07 | F | Cross Seamount | Seen once | |
| HIFa501 | Isolated | IC#5 | FA07 | F | Cross Seamount | Seen once | |
| HIFa002 | HIMC | 1 | FA11 | M | Hawai‘i | Seen 33 times in 17 years | |
| HIFa003 | HIMC | 1 | FA11 | F | Hawai‘i | Seen 29 times in 14 years | |
| HIFa005 | HIMC | 1 | FA11 | F | Hawai‘i | Seen 49 times in 19 years | |
| HIFa006 | HIMC | 1 | FA11 | F | Hawai‘i | Seen 47 times in 19 years | |
| HIFa010 | HIMC | 1 | FA11 | F | Hawai‘i | Seen 43 times in 19 years | |
| HIFa109 | HIMC | 1 | FA11 | M | Hawai‘i | Seen 35 times in 18 years | |
| HIFa249 | HIMC | 1 | FA11 | M | Hawai‘i | Seen 19 times in 10 years | |
| HIFa527 | HIMC | 6 | FA03 | M | Hawai‘i | Seen three times in 3 years | |
| HIFa233 | HIMC | 7 | FA21 | M | Hawai‘i | Seen five times in 5 years | |
| HIFa421 | HIMC | 7 | FA08 | M | Hawai‘i | Seen four times in 4 years | |
| HIFa147 | HIMC | 7 | FA21 | F | Hawai‘i | Seen eight times in 7 years | |
| HIFa048 | HIMC | ND | FA21 | F | Hawai‘i | Seen two times in 2 years | |
| HIFa272 | HIMC | ND | FA03 | M | Hawai‘i | Seen once | |
| HIFa242 | HIMC | ND | FA02 | M | Hawai‘i | Seen once | |
| HIFa368 | OAMC | 2 | FA11 | F | O‘ahu | Seen 11 times in 6 years | |
| HIFa370 | OAMC | 2 | FA11 | F | O‘ahu | Seen 11 times in 6 years | |
| HIFa419 | OAMC | 2 | FA11 | F | O‘ahu | Seen 47 times in 13 years | |
| HIFa666 | OAMC | 3 | FA03 | M | O‘ahu, Lāna‘i | Seen six times in 3 years |
All individuals were considered adults or subadults except for HIFa736, HIFa740, and HIFa780, which were considered calves or juveniles.
OAMC, O‘ahu main component; HIMC, Hawai‘i Island main component; IC, isolated component; ND, cluster assignment not determined due to insufficient sample size.
Twenty one of the 24 free ranging individuals sampled were from the main component of the social network, with five different haplotypes represented. The most common haplotype in the Hawaiian Islands (FA11) was found in 12 individuals with photos, and in one biopsy sample that could not be attributed to a photographed individual. Seven of the photographed individuals were associated in a single social cluster (Cluster 1) documented off Hawaiʻi Island (Fig. S2), with re-sightings for those seven individuals spanning from 10 to 19 years, with all of their sightings off Hawai‘i Island. These included both females (n = 4) and males (n = 3). Three additional individuals with haplotype FA11 (all females), seen only off O‘ahu and over spans from 6 to 13 years, were documented in a single social cluster (Cluster 2). The remaining photographed individuals with haplotype FA11 were from single strandings off Oʻahu in 2006 and off Hawaiʻi Island in 2015 (Table 4). The 2006 Oʻahu individual was very distinctive, but our first photos of free ranging individuals from Oʻahu did not become available until 2007, so we were not able to match this individual to any known individual. The 2015 Hawaiʻi Island individual was considered not distinctive and thus, we were not able to match it to any known individual in the catalogue. The second most common haplotype documented (FA22) was found in five individuals all involved in the August 2019 mass stranding on Maui. In the main component of the social network, two haplotypes were each documented in three different individuals (FA03 and FA21). Two of the FA21 haplotypes were found in the same cluster, while the third, and all three individuals with haplotype FA03, were either from different social clusters (Fig. S2) or cluster membership could not be determined due to insufficient sample size (Table 4). Three samples were available from the group sampled at Cross Seamount, far to the south-west of Hawai‘i Island (Fig. 3), and those individuals shared a single haplotype (FA07) not found in any other individuals. The three remaining haplotypes (FA02, FA08, FA09) were each found in single individuals. One of these was found in the same cluster (Cluster 7) as an individual with haplotype FA21. However, those individuals were seen less often (seen from four to eight times; Table 4) than individuals sampled from Cluster 1 or Cluster 2 (seen from 11 to 49 times; Table 4), and associations within the same cluster may be an artefact of small sample size.
Movements among island areas, documented through photographs from encounters, were relatively limited (Table 5). Twenty six of the 318 individuals (8.2%) were documented in two island areas, and an additional four individuals (1.3%) were documented in all three island areas (i.e. Oʻahu, Maui Nui, Hawaiʻi Island). For those seen on more than just two or three occasions, movements from one island to another did not appear to be permanent (Table 4). For example, of the 19 individuals documented moving among islands that were originally sighted off O‘ahu, 13 were sighted back off O‘ahu after their initial movement to another island (Table 4). The 13 individuals were part of two different social clusters (Cluster 2 and 3). Three of the six individuals not documented back off Oʻahu were only seen on two or three occasions each. The group documented north of Molokaʻi included individuals previously seen both off Hawaiʻi Island (n = 3) and Oʻahu (n = 1). Sex of individuals moving among islands was confirmed for nine (all males) and suspected for three (females).
| ID | Sex | Cluster | Island order of movements | # islands | # sightings | Span of years | |
|---|---|---|---|---|---|---|---|
| HIFa434 | F? | 8 | H-Mo | 2 | 2 | 5.9 | |
| HIFa440 | 8 | H-Mo | 2 | 2 | 5.9 | ||
| HIFa444 | 8 | H-Mo | 2 | 2 | 5.9 | ||
| HIFa549 | 8 | O-Mo | 2 | 2 | 4 | ||
| HIFa065 | M | 5 | H-O | 2 | 3 | 13.3 | |
| HIFa597 | M | 5 | H-O | 2 | 2 | 3.9 | |
| HIFa599 | M | 5 | H-O | 2 | 2 | 3.9 | |
| HIFa600 | 5 | H-O | 2 | 2 | 3.9 | ||
| HIFa601 | 5 | H-O | 2 | 2 | 3.9 | ||
| HIFa602 | M | 5 | H-O | 2 | 2 | 3.9 | |
| HIFa353 | M | 2 | O-H-O | 2 | 28 | 13.8 | |
| HIFa371 | M | 2 | O-H-O | 2 | 30 | 13.0 | |
| HIFa587 | M | 2 | O-H | 2 | 13 | 7.2 | |
| HIFa670 | M | 2 | O-H-O | 2 | 19 | 4.6 | |
| HIFa056 | 3 | L-O | 2 | 3 | 22.3 | ||
| HIFa346 | 3 | O-H | 2 | 3 | 5.1 | ||
| HIFa349 | 3 | O-H-O-L-O | 3 | 10 | 10.9 | ||
| HIFa350 | 3 | O-H-O-L-O | 3 | 10 | 11.9 | ||
| HIFa351 | 3 | O-H-O-L-O-L-O | 3 | 9 | 10.9 | ||
| HIFa367 | 3 | H-O | 2 | 2 | 2.5 | ||
| HIFa374 | 3 | O-H-O-L-O | 3 | 7 | 9.7 | ||
| HIFa451 | 3 | O-L-O | 2 | 4 | 8.8 | ||
| HIFa453 | 3 | O-L | 2 | 4 | 7.4 | ||
| HIFa589 | 3 | O-L | 2 | 3 | 4.5 | ||
| HIFa657 | F? | 3 | O-L-O | 2 | 8 | 2.8 | |
| HIFa658 | F? | 3 | O-L-O | 2 | 7 | 2.7 | |
| HIFa660 | 3 | O-L-O | 2 | 7 | 1.7 | ||
| HIFa663 | 3 | O-L-O | 2 | 13 | 5 | ||
| HIFa666 | M | 3 | O-L | 2 | 6 | 1.6 | |
| HIFa659 | ND | O-L-O | 2 | 7 | 2.7 |
Sex is indicated when known; ?, suspected.
H, Hawai‘i Island; Mo, Moloka‘i; O, O‘ahu; L, Lāna‘i; ND, cluster assignment not determined due to insufficient sample size.
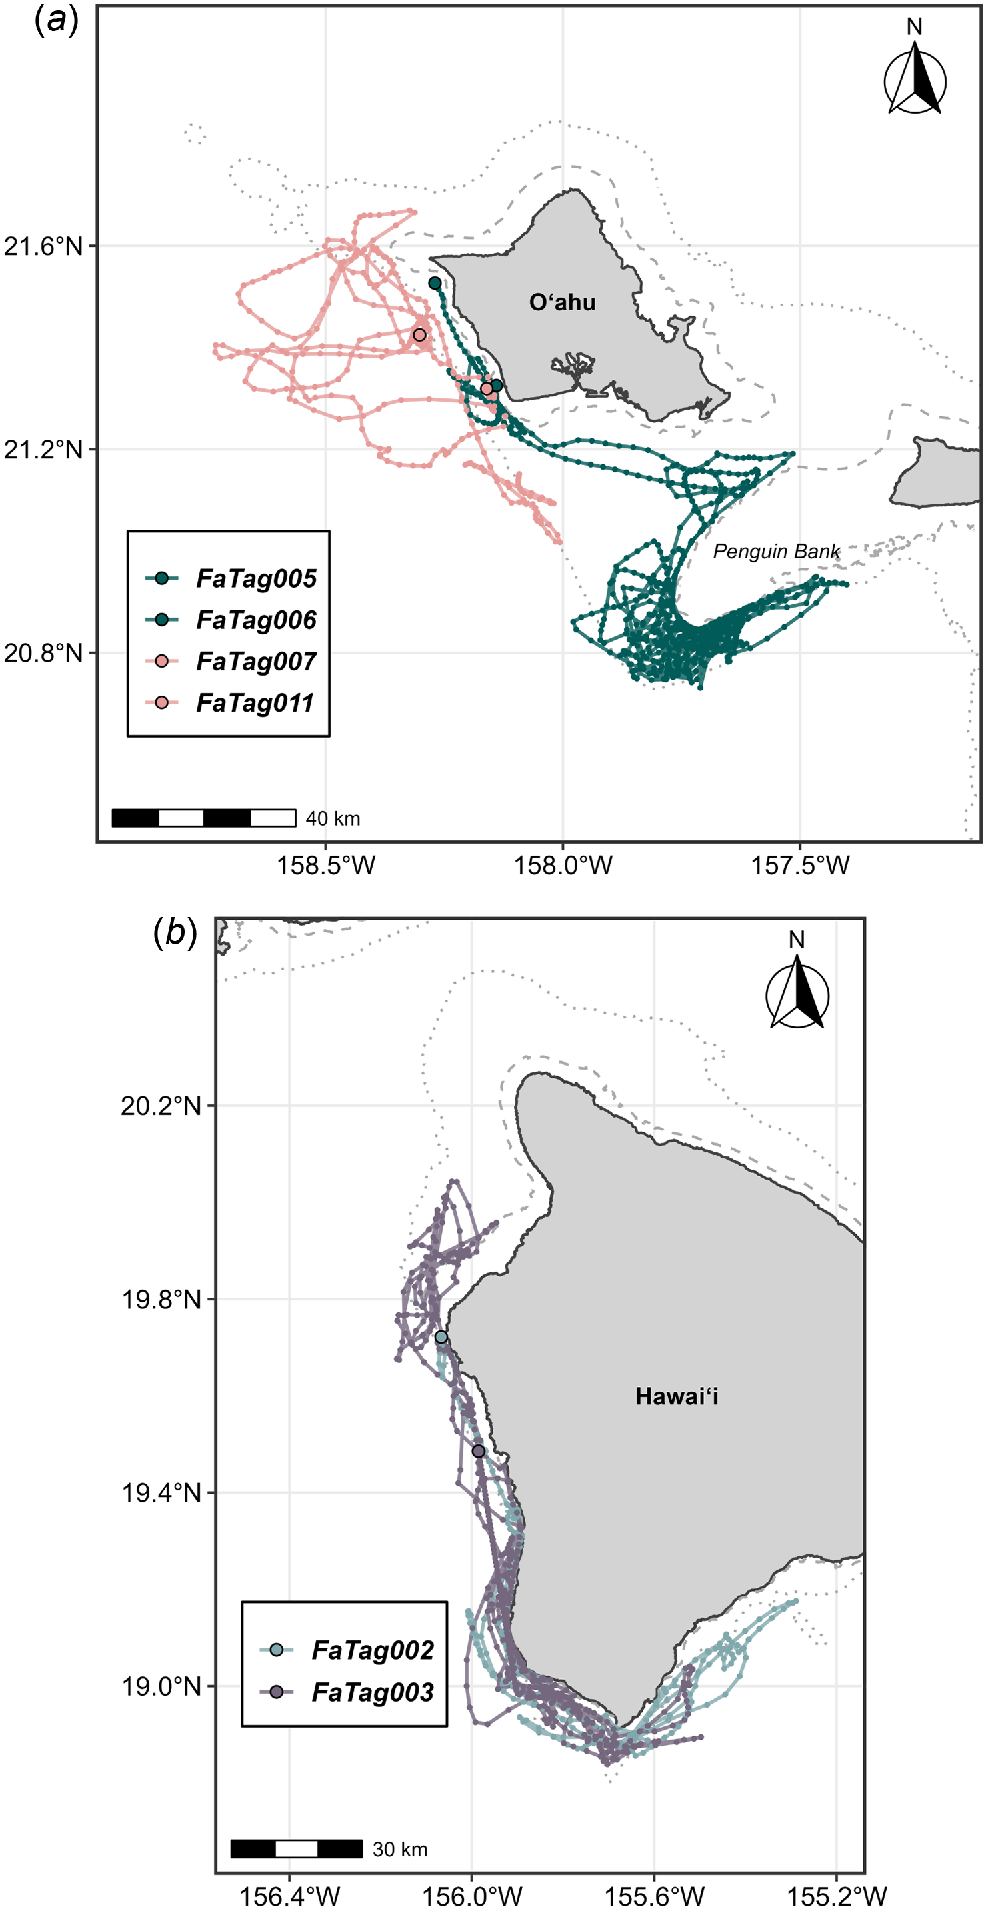
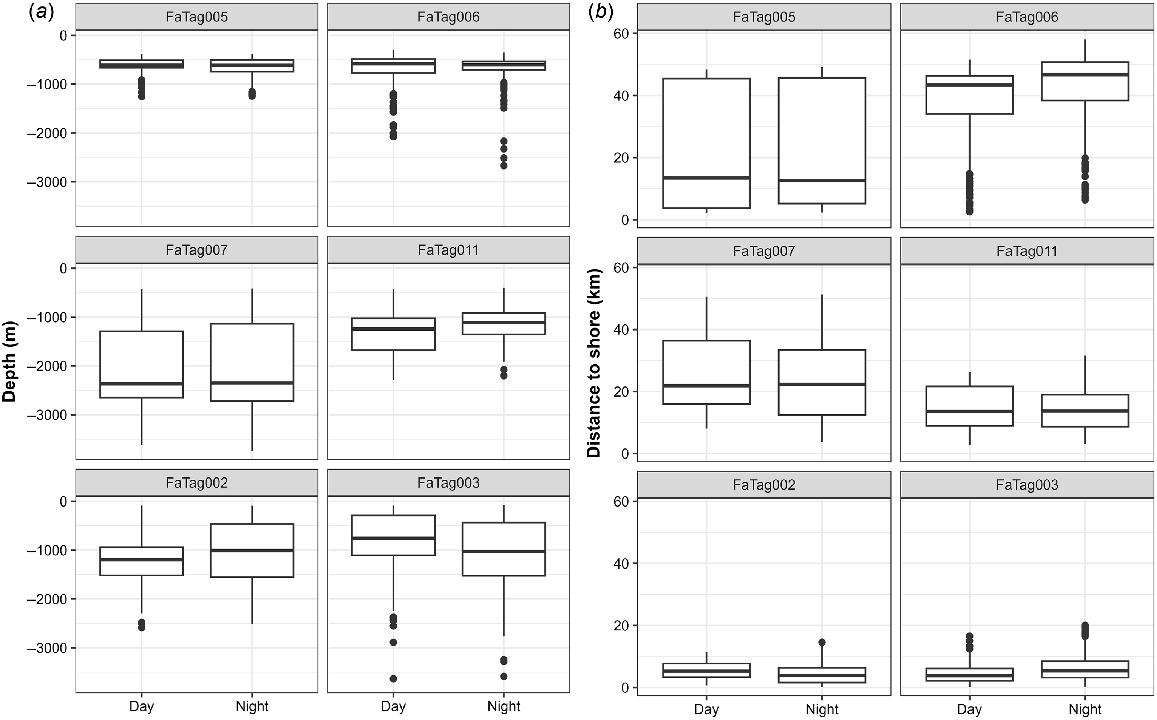
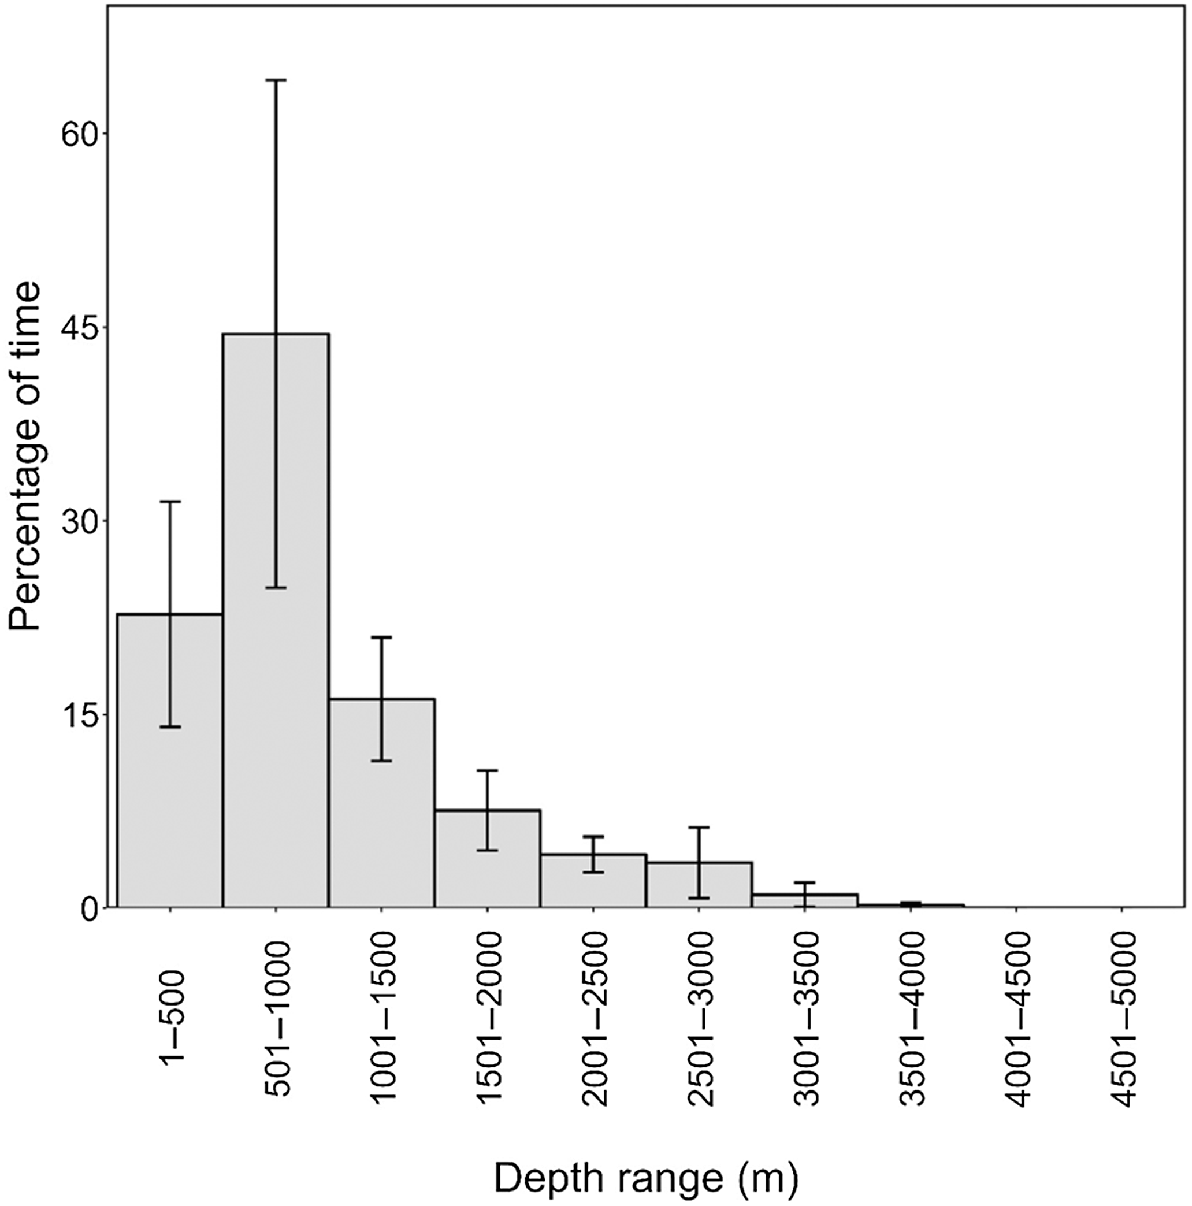
Eleven satellite tags were deployed, but tag location data were obtained from only six individuals over spans ranging from 2.04 to 25.47 days (Table 6, Fig. 5). The remaining five tags were all known or suspected to have been removed by conspecifics within 50 min of tagging. In four of the five cases, the tags were firmly attached with both darts on deployment. However, tagged individuals were seen in close association with non-tagged individuals shortly after tagging and were photographed with the tags no longer attached after 5, 10, 30, and 48 min post-tagging, suggesting they were likely removed by conspecifics. In the fifth case, only one of the two tag darts was in the fin upon deployment, but the group with the tagged individual was not relocated immediately after tagging. There were no uplinks of the transmitter to the Argos satellite system after tagging, leading us to believe the tag had also been removed. All tagged individuals were part of the main component of the social network. Of those with location data, two were tagged off Hawaiʻi Island (both from Cluster 1 but tagged in two different years), and four were tagged off Oʻahu (from two different social clusters). Three of the Oʻahu tag deployments overlapped temporally (Table 6). Satellite tag data support the limited inter-island movements that were observed in sightings/encounter data, with only two tagged individuals (O‘ahu) moving to Penguin Bank, closer to Moloka‘i (Fig. 5). There was considerable variability in tagged whale habitat use with respect to seafloor depth and distance from shore (Fig. 6), but in all cases tagged individuals remained associated with the island slopes (Figs 5 and 6). Although FaTag005 and FaTag006 (both from Cluster 2 and tagged off Oʻahu in October 2010) used similar depths, their distribution of distance from shore varied considerably (Fig. 6), as FaTag006 spent much of their time along the edge of Penguin Bank (Fig. 5) while the FaTag005 tag stopped transmitting shortly after the two moved to Penguin Bank. The Oʻahu individual tagged from Cluster 3 (FaTag007) moved farther offshore compared to FaTag005 and FaTag006 (Fig. 5). No consistent patterns in depth or distance from shore between day and night were apparent among individuals (Fig. 6). Overall, tagged individuals spent almost half their time over bottom depths between 500 and 1000 m (Fig. 7). One of the tag deployments (FaTag011) was a SPLASH10 tag, although this tag only transmitted for 2.04 days, and only 2.58 h of behaviour data were obtained, in two blocks of time both during night-time periods. In total 15 dives were recorded, ranging from 33 to 283 m in depth (median = 152 m), and from 2.7 to 8.37 min in duration (median = 5.43 min). Surface periods (i.e. time <30 m in depth) between dives were relatively short (median = 4.20 min, range = 0.33–9.56 min), suggesting that the individual was actively foraging during these periods.
| Tag ID | Individual ID | Sex (if known) | Cluster | Date tagged | # days location data | Island | Sighting history | |
|---|---|---|---|---|---|---|---|---|
| FaTag002 | HIFa398 | Male | 1 | 12/6/2008 | 10.33 | Hawaiʻi | Seen 41 times over 15 years | |
| FaTag003 | HIFa279 | – | 1 | 4/19/2009 | 22.21 | Hawaiʻi | Seen 10 times over 4 years | |
| FaTag005 | HIFa368 | Female | 2 | 10/13/2010 | 11.81 | Oʻahu | Seen 11 times over 5 years | |
| FaTag006 | HIFa371 | Male | 2 | 10/18/2010 | 25.47 | Oʻahu | Seen 30 times over 13 years | |
| FaTag007 | HIFa459 | – | 3 | 10/24/2010 | 7.16 | Oʻahu | Seen twice over 2 years | |
| FaTag011 | HIFa656 | – | ND | 10/10/2016 | 2.04 | Oʻahu | Seen once |
All individuals were in the main component of the social network.
ND, cluster assignment not determined due to insufficient sample size.
Movements of satellite-tagged pygmy killer whales off (a) O‘ahu and (b) Hawai‘i Island. The 200 m (dashed) and 1000 m (dotted) depth contours are shown. See Table 6 for details on tag deployments.
Discussion
Our approach of prioritising time with rarely-encountered species has resulted in an increase in knowledge on how these species use both Hawaiian waters and, in some cases, has implications for understanding the species globally. Fraser’s dolphins, sperm whales, and striped dolphins are examples of the former. All are rarely documented in Hawaiian waters, yet our basic analyses of sighting rates in relation to depth (Fig. 1), even with relatively small sample sizes, suggest that there are no island-associated populations of these species in Hawaiian waters, unlike many other species of odontocetes (Baird 2016). We present an example of the latter as well, by combining results from multiple data types (sighting and effort data, photo-identification, genetic analysis of biopsy samples, and satellite tagging) to examine island residency and population structure for pygmy killer whales. Although pygmy killer whales are widely distributed throughout the tropics, directed studies of this species are rare, and much of what has been reported elsewhere have been stranded animals (e.g. Brownell et al. 2009; Clua et al. 2014) or single sightings (e.g. Legrand and Monticelli 2020). Pygmy killer whales were first documented in Hawaiian waters in 1963, with sightings off both O‘ahu and Hawai‘i Island (Pryor et al. 1965). McSweeney et al. (2009) reported results from the first multi-year study of this species, demonstrating that pygmy killer whales off the island of Hawai‘i exhibited evidence of long-term site fidelity. In that study, 40 different individuals had been documented on two or more occasions, with resighted individuals seen a maximum of 21 times and in up to 12 different years. At the time of that study, only a few photos were available from encounters elsewhere among the islands, and no matches of individuals among islands were found. We have continued and expanded on that work, and since 2007 there have been many encounters off O‘ahu, primarily from citizen science sources, which have revealed long-term site fidelity off that island as well. Citizen science encounters often are shorter in duration and not all individuals within groups are photo-identified. Yet of the individuals photo-identified from the very first encounter off Oʻahu (in 2007), the five with fair or better quality photos were seen over periods from 5.1 to 13.8 years, with the most recent sighting of one of the five in 2021. Evidence of multi-year site fidelity for this species has also come from Guam, with sightings of one group over a 3-year period (Hill et al. 2020).
With the larger combined sample size, we have documented movements of pygmy killer whales between O‘ahu, Moloka‘i, Lāna‘i, and Hawai‘i Island, and weak linkages (in the social network) between the areas, but individuals were primarily re-sighted off the island where they were first documented. This suggests that there are largely separate resident, island-associated communities centred off O‘ahu and Hawai‘i Island. It is interesting to note that all of the individuals documented moving among islands for which we were able to confirm sex were males (Table 4). However, identifying adult males based on the presence of a post-anal keel (McSweeney et al. 2009) is easier than confirming an individual is an adult female, and there were some suspected females also documented moving among islands. Despite a considerable amount of effort off Kaua‘i and Ni‘ihau over the years, pygmy killer whale encounters there are rare, and encounter rates (in similar depth ranges) are only about 16% of the encounter rates off nearby O‘ahu (Table 1). Although only 32 individuals have been photo-identified off Kaua‘i or Ni‘ihau, none matched to the main component of the social network. Combined with the low encounter rates, this suggests there is no resident island-associated population of pygmy killer whales off Kaua‘i or Ni‘ihau.
As reported by others (e.g. Pryor et al. 1965), pygmy killer whales observed in this study typically spent their time milling, resting or engaged in slow travel. Behaviour categorised as foraging was only documented in two of 63 encounters (3.2%). Only a very short sample of dive data was obtained (15 dives) from the one SPLASH10 tag, but dives were occurring at night. These results are consistent with limited behavioural information from two rehabilitated and released individuals satellite-tagged in the Gulf of Mexico. Pulis et al. (2018) noted that the vast majority of their dives below 30 m occurred at night. We have never documented actual prey chases or consumption, nor had it been seen in 61 opportunistic encounters by McSweeney et al. (2009) off Hawai‘i Island. Thus, foraging and feeding likely primarily occurs at night, and for what little that does occur during the day, prey do not seem to be brought up to the surface where they can be documented. Obtaining behaviour data from tags to examine night time foraging will be difficult however, given how often individuals appear to avoid vessels, and the tendency for this species to remove tags from conspecifics. We have documented conspecific tag removal in two other species of odontocetes, at least one case with a LIMPET tag on a short-finned pilot whale, and another where a suction-cup attached time-depth recorder deployed on a false killer whale was removed by a companion by grabbing onto the antenna and pulling (R.W. Baird, unpub. data). Given our sample size of tag deployments on some other species (Table 2), the rate of conspecific tag removal for this species is the highest documented for any of the 12 species of odontocetes satellite tagged in our work.
Several pygmy killer whale mass strandings, or near-mass stranding events (i.e. with individuals milling for extended periods in much shallower water than the species is typically documented), have been documented in Hawai‘i, all in the same general area off the south-west shore of Maui. Two of these were in 1981 and 1988 (see Jenner et al. 1989; Mazzuca et al. 1999), and three (one near-mass stranding event in 2009 and the two events in 2019, see Currie et al. 2021) are the events that we have photos and samples from. Two of the single-stranded pygmy killer whales had haplotype FA11, the most common haplotype in the resident groups off both Oʻahu and Hawaiʻi Island, suggesting that these stranded individuals may have been from the resident, island-associated population. The other stranded individuals, one that stranded out of a larger group that was milling in shallow water off Maui in May 2009, and five samples from a group that mass stranded in August 2019, had haplotypes that were not shared with any individuals within the main component of the social network. While the number of genetic samples from the main component is relatively small (20 individuals), and haplotypic diversity is high (five documented haplotypes), combined with the lack of photographic re-sightings of any of the individuals involved in these mass strandings elsewhere, this suggests that these stranded and associated individuals may not be part of the resident, island-associated populations. Indeed, there are a number of species in Hawaiian waters that have both island-associated and offshore or oceanic populations, including false killer whales, melon-headed whales, Blainville’s beaked whales, and bottlenose dolphins, among others (Baird et al. 2009, 2011b; Aschettino et al. 2012; Anderson et al. 2020).
In terms of lessons learned, one of the most important is that even an extremely infrequently-encountered species can still be resident to an area. Without the evidence from photographic re-sightings, it would be easy to dismiss the occasional sighting of this species as an incursion into nearshore waters from an open-ocean population. With many studies of cetaceans at oceanic islands focusing on those species found closest to shore, such resident populations of infrequently-encountered but slightly farther offshore species may be overlooked. We suggest that those studying nearshore species, whether at oceanic islands or in continental areas where deeper water comes closer to shore, use opportunities to collect information on rarely-encountered species when they arise, as such investments of time may have long-term benefits. Of particular importance is the collection of photographs and subsequent development of photo-identification catalogues, such that inference on residency, movements, and group structure can be drawn from individual re-sightings. The deployment of satellite tags can greatly aid understanding of movements of rarely-encountered species as demonstrated in our study, especially where survey efforts are often spatially restricted by weather conditions. However, satellite tagging operations require specialised expertise and greater funding support. Photographic methods are a more feasible and cost-effective means for documenting movements and habitat use, and are critical in the interpretation of satellite tag (and genetic) data, if such work is done later. Another lesson is that multiple research approaches are highly valuable, and collaboration and sharing of information is critical (e.g. Baird et al. 2013a; Abecassis et al. 2015; Harnish et al. 2019, 2023). Photographs used in this study have come from more than 50 different organisations and individuals; without these contributions the ability to assess and describe site fidelity and movements of this species would be limited. When movements among areas are rare, as in the case of pygmy killer whales, even a single sighting with photographs may be of value in documenting such movements.
A long-term approach is also necessary for obtaining information that is useful in conservation and management contexts. Our satellite tag and sighting data were recently used to designate two Biologically Important Areas (BIAs) for pygmy killer whales, one for the O‘ahu-Maui Nui population and another for the Hawai‘i Island population, in addition to BIAs delineated for several other rarely-encountered species that have been studied with the same approach (Kratofil et al. 2023). Additionally, although there are only photos available from three encounters off Kauaʻi and Niʻihau, interpretation of the photo-identification results in the context of re-sighting rates from other islands is important from the perspective of understanding the potential for this species to react to high-intensity mid-frequency active sonar. The US Navy’s Pacific Missile Range Facility, located between Kauaʻi and Niʻihau, is the location of regular Navy training and testing activities involving mid-frequency active sonar (see e.g. Jacobson et al. 2022). Whether and how pygmy killer whales react to mid-frequency active sonar or the presence of Navy vessels is unknown. This species did exhibit avoidance reactions to our research vessel (at relatively short distances) in more than half of our encounters, suggesting that they may be easily disturbed. Brownell et al. (2009) have suggested that pygmy killer whale mass stranding events around Taiwan may be related to exposure to anthropogenic sound. Their rarity around Kauaʻi and Niʻihau, relative to the amount of survey effort off those islands, may be related to the regular Navy testing and training activities that occur there. Since pygmy killer whales are rarely encountered around Kauaʻi and Niʻihau, they are likely to be naïve animals that may be more susceptible to disturbance or mass strandings. Although no pygmy killer whale strandings have been documented on Kaua‘i or Ni‘ihau, the likelihood of stranded animals being detected in Hawai‘i is low (Faerber and Baird 2010).
Photos obtained both through directed research efforts and from citizen scientists have also been used to assess evidence for fishery interactions, based on mouthline and dorsal fin injuries that are consistent with fishery interactions. These efforts have found a large proportion of individuals exhibiting evidence of prior fishery interactions, as well as vessel strikes, and gunshot wounds (Vanderzee et al. 2019). Only a single stock of pygmy killer whales is currently recognised within the US Exclusive Economic Zone surrounding the Hawaiian archipelago (Carretta et al. 2021). However, our results, both of long-term re-sightings and site fidelity of individuals in the main component of the social network, and of isolated social network components that do not share mitochondrial haplotypes with the main component, suggest that there are both island-associated and offshore populations in Hawaiian waters.
Data availability
Cascadia Research Collective sightings and effort data are available at https://seamap.env.duke.edu/dataset/467. Pygmy killer whale satellite tag data have been uploaded to the Animal Telemetry Network Data Assembly Center upon acceptance. Genetic sequences will be uploaded to GenBank.
Declaration of funding
No funding was specifically received to study pygmy killer whales, but multi-species funding was received from NOAA Fisheries (Southwest Fisheries Science Center, Pacific Islands Fisheries Science Center), U.S. Navy (Office of Naval Research, Pacific Fleet, N45, Living Marine Resources), and the U.S. Marine Mammal Commission. Additional funding during which research on pygmy killer whales was conducted was received from the State of Hawai‘i (through Section 6 grants from NOAA Fisheries) and the NOAA Bycatch Reduction Engineering Research Program. Funding for satellite tags deployed on pygmy killer whales was provided by Dolphin Quest and the U.S. Navy’s Living Marine Resources Program. Funding for stranding response was provided by the NOAA Fisheries John H. Prescott Marine Mammal Rescue Assistance Grant Program.
Acknowledgements
Tagging was undertaken under NMFS Scientific Research Permit No. 731-1774 and 15330. Biopsy sampling was undertaken under NMFS Scientific Research Permit No. 774-1437, 774-1714, and 14097. Stranded animal sampling was conducted under NMFS Scientific Research Permit No. 18786. We thank Greg Schorr and Daniel Webster for deploying tags and for interpretation of tag attachments. We thank the Cetacean Research Program of the Pacific Islands Fisheries Science Center for providing a biopsy sample included in the genetic analyses as well as sighting and effort data from large-vessel surveys. A large number of individuals helped in the field, but we particularly thank Jessica Aschettino, Colin Cornforth, Jordan Lerma, Dan McSweeney, Greg Schorr, Daniel Webster, and Kimberly Wood. We thank the following individuals and organisations for providing photos used in these analyses: Erin Adams, Russ Andrews, Jim Ault, Chuck Babbitt, James Begeman, Andrew Bergstrom, Kalea Bruce, Captain Zodiac (Colin Cornforth, Stacia Goecke, Shannon Harrison), Seth Conae, Sofia Dahl, Nicole Davis, Mark Deakos, Dolphin Excursions Hawaiʻi (Jenna Morris, Alexa Vitek, Veronica Franklin, Cam Grant), Tom Elliot, Landen Fletcher, Alicia Franco, Dennis Fukushima, Cory Fults, Beth Goodwin, Allison Gordon, Brittany Guenther, Cynthia Hankins, Hawai‘i Nautical (Brenna Gaddis), HDR Inc. (Mark Cotter, Craig Hawkinson), April Irvin, Kimberly Jeffries, Mark Johnson, Ali Lacuzzo, Jason Lafferty, Ryan Leinbach, Ed Lyman, Jeff Milisen, Dan McSweeney, Jeff Molder, Ocean Joy Cruises (Jim Ault, Manibuka Teaeki, Ash Wilhelm), Pacific Islands Fisheries Science Center, Pacific Whale Foundation (Stephanie Stack, Jens Currie), Doug Perrine, David Schofield, Malori Scrivner, Melissa Shontofski, Julie Steelman, Dai Mar Tamarack, The Dolphin Institute (Adam Pack, Aliza Milette-Winfree), Eldon Tipping, Julian Tyne, Deron Verbeck, Jim Ward, Kimberly Wood, Kelly Wright, Eden Zang, and Ann Zoidis. Thanks to Ākeamakamae Kiyuna for the Hawaiian language translation of the abstract. We thank Annie Douglas, Karen Martien, and two anonymous reviewers for reviews of the manuscript.
References
Abecassis M, Polovina J, Baird RW, Copeland A, Drazen JC, Domokos R, Oleson E, Jia Y, Schorr GS, Webster DL, Andrews RD (2015) Characterizing a foraging hotspot for short-finned pilot whales and Blainville’s beaked whales located off the west side of Hawai‘i Island by using tagging and oceanographic data. PLoS ONE 10, e0142628.
| Crossref | Google Scholar |
Anderson D, Baird RW, Bradford AL, Oleson EM (2020) Is it all about the haul? Pelagic false killer whale interactions with longline fisheries in the central North Pacific. Fisheries Research 230, 105665.
| Crossref | Google Scholar |
Andrews RD, Baird RW, Calambokidis J, Goertz CEC, Gulland FMD, Heide-Jørgensen MP, Hooker SK, Johnson M, Mate B, Mitani Y, Nowacek DP, Owen K, Quakenbush LT, Raverty S, Robbins J, Schorr GS, Shpak OV, Townsend FI, Jr, Uhart M, Wells RS, Zerbini AN (2019) Best practice guidelines for cetacean tagging. Journal of Cetacean Research and Management 20, 27-66.
| Crossref | Google Scholar |
Apprill A, Miller CA, Van Cise AM, U’Ren JM, Leslie MS, Weber L, Baird RW, Robbins J, Landry S, Bogomolni A, Waring G (2020) Marine mammal skin microbiotas are influenced by host phylogeny. Royal Society Open Science 7, 192046.
| Crossref | Google Scholar |
Aschettino JM, Baird RW, McSweeney DJ, Webster DL, Schorr GS, Huggins JL, Martien KK, Mahaffy SD, West KL (2012) Population structure of melon-headed whales (Peponocephala electra) in the Hawaiian Archipelago: evidence of multiple populations based on photo identification. Marine Mammal Science 28, 666-689.
| Crossref | Google Scholar |
Baird RW (2016) ‘The lives of Hawai‘i’s dolphins and whales: natural history and conservation.’ (University of Hawai‘i Press) doi:10.1515/9780824865931
Baird RW (2019) Behavior and ecology of not-so-social odontocetes: Cuvier’s and Blainville’s beaked whales. In ‘Ethology and behavioral ecology of odontocetes’. (Ed. B Würsig) pp. 305–329. (Springer) doi:10.1007/978-3-030-16663-2_14
Baird RW, Webster DL (2020) Using dolphins to catch tuna: assessment of associations between pantropical spotted dolphins and yellowfin tuna hook and line fisheries in Hawai‘i. Fisheries Research 230, 105652.
| Crossref | Google Scholar |
Baird RW, Ligon AD, Hooker SH (2000) Sub-surface and night-time behavior of humpback whales off Maui, Hawaii: a preliminary report. Report prepared under Contract #40ABNC050729 from the Hawaiian Islands Humpback Whale National Marine Sanctuary, Kihei, HI, to the Hawaii Wildlife Fund, Paia, HI. (Hawai‘i Wildlife Fund) Available at https://cascadiaresearch.org/files/sancrept.pdf
Baird RW, Ligon AD, Hooker SK, Gorgone AM (2001a) Subsurface and nighttime behaviour of pantropical spotted dolphins in Hawai‘i. Canadian Journal of Zoology 79, 988-996.
| Crossref | Google Scholar |
Baird RW, Gorgone AM, Ligon AD, Hooker SK (2001b) Mark-recapture abundance estimate of bottlenose dolphins (Tursiops truncatus) around Maui and Lana‘i, Hawai‘i, during the winter of 2000/2001. Report prepared under contract #40JGNF0-00262 to the Southwest Fisheries Science Center, National Marine Fisheries Service, La Jolla, CA. (Southwest Fisheries Science Center). Available at https://cascadiaresearch.org/files/HItursiops.pdf
Baird RW, Gorgone AM, Webster DL, McSweeney DJ, Durban JW, Ligon AD, Salden DR, Deakos MH (2005) False killer whales around the main Hawaiian islands: an assessment of inter-island movements and population size using individual photo-identification. Report prepared under Order No. JJ133F04SE0120 from the Pacific Islands Fisheries Science Center, National Marine Fisheries Service. (Pacific Islands Fisheries Science Center). Available at https://cascadiaresearch.org/files/Baird-et-al-2005-Hawaii-Pseudorca.pdf
Baird RW, Webster DL, McSweeney DJ, Ligon AD, Schorr GS, Barlow J (2006) Diving behaviour of Cuvier’s (Ziphius cavirostris) and Blainville’s (Mesoplodon densirostris) beaked whales in Hawai‘i. Canadian Journal of Zoology 84, 1120-1128.
| Crossref | Google Scholar |
Baird RW, Webster DL, Schorr GS, McSweeney DJ, Barlow J (2008a) Diel variation in beaked whale diving behavior. Marine Mammal Science 24, 630-642.
| Crossref | Google Scholar |
Baird RW, Gorgone AM, McSweeney DJ, Webster DL, Salden DR, Deakos MH, Ligon AD, Schorr GS, Barlow J, Mahaffy SD (2008b) False killer whales (Pseudorca crassidens) around the main Hawaiian Islands: long-term site fidelity, inter-island movements, and association patterns. Marine Mammal Science 24, 591-612.
| Crossref | Google Scholar |
Baird RW, Gorgone AM, McSweeney DJ, Ligon AD, Deakos MH, Webster DL, Schorr GS, Martien KK, Salden DR, Mahaffy SD (2009) Population structure of island-associated dolphins: evidence from photo-identification of common bottlenose dolphins (Tursiops truncatus) in the main Hawaiian Islands. Marine Mammal Science 25, 251-274.
| Crossref | Google Scholar |
Baird RW, Schorr GS, Webster DL, McSweeney DJ, Hanson MB, Andrews RD (2011a) Movements of two satellite-tagged pygmy killer whales (Feresa attenuata) off the island of Hawai‘i. Marine Mammal Science 27, E332-E337.
| Crossref | Google Scholar |
Baird RW, Schorr GS, Webster DL, Mahaffy SD, McSweeney DJ, Hanson MB, Andrews RD (2011b) Open-ocean movements of a satellite-tagged Blainville’s beaked whale (Mesoplodon densirostris): evidence for an offshore population in Hawai‘i? Aquatic Mammals 37, 506-511.
| Crossref | Google Scholar |
Baird RW, Webster DL, Aschettino JM, Schorr GS, McSweeney DJ (2013a) Odontocete cetaceans around the main Hawaiian Islands: habitat use and relative abundance from small-boat sighting surveys. Aquatic Mammals 39, 253-269.
| Crossref | Google Scholar |
Baird RW, Oleson EM, Barlow J, Ligon AD, Gorgone AM, Mahaffy SD (2013b) Evidence of an island-associated population of false killer whales (Pseudorca crassidens) in the Northwestern Hawaiian Islands. Pacific Science 67, 513-521.
| Crossref | Google Scholar |
Baird RW, Mahaffy SD, Lerma JK (2022) Site fidelity, spatial use, and behavior of dwarf sperm whales in Hawaiian waters: using small-boat surveys, photo-identification, and unmanned aerial systems to study a difficult-to-study species. Marine Mammal Science 38, 326-348.
| Crossref | Google Scholar |
Baird RW, Cornforth CJ, Mahaffy SD, Lerma JK, Harnish AE, Kratofil MA (2023) Field studies and analyses from 2020 through 2022 to support the cooperative conservation and long-term management of main Hawaiian Islands insular false killer whales. Report to the State of Hawai‘i Board of Land and Natural Resources under Contract No. 68819. (Cascadia Research Collective). Available at https://cascadiaresearch.org/files/Baird_etal_2023_Section6.pdf
Bazúa-Durán C, Au WWL (2002) The whistles of Hawaiian spinner dolphins. The Journal of the Acoustical Society of America 112, 3064-3072.
| Crossref | Google Scholar |
Blondel VD, Guillaume J-L, Lambiotte R, Lefebvre E (2008) Fast unfolding of communities in large networks. Journal of Statistical Mechanics: Theory and Experiment 2008, P10008.
| Crossref | Google Scholar |
Bradford AL, Baird RW, Mahaffy SD, Gorgone AM, McSweeney DJ, Cullins T, Webster DL, Zerbini AN (2018) Abundance estimates for management of endangered false killer whales in the main Hawaiian Islands. Endangered Species Research 36, 297-313.
| Crossref | Google Scholar |
Braulik G (2018) Feresa attenuata. The IUCN Red List of Threatened Species 2018: e.T8551A50354433. Available at https://doi.org/10.2305/iucn.uk.2018-2.rlts.t8551a50354433.en
Cairns SJ, Schwager SJ (1987) A comparison of association indices. Animal Behaviour 35, 1454-1469.
| Crossref | Google Scholar |
Clua EE, Manire CA, Garrigue C (2014) Biological data of pygmy killer whale (Feresa attenuata) from a mass stranding in New Caledonia (South Pacific) associated with Hurricane Jim in 2006. Aquatic Mammals 40, 162-172.
| Crossref | Google Scholar |
Courbis S, Baird RW, Cipriano F, Duffield D (2014) Multiple populations of pantropical spotted dolphins in Hawaiian waters. Journal of Heredity 105, 627-641.
| Crossref | Google Scholar |
Csardi G, Nepusz T (2006) The igraph software package for complex network research. InterJournal, Complex Systems 1695, 1-9.
| Google Scholar |
Currie JJ, van Aswegen M, Stack SH, West KL, Vivier F, Bejder L (2021) Rapid weight loss in free ranging pygmy killer whales (Feresa attenuata) and the implications for anthropogenic disturbance of odontocetes. Scientific Reports 11, 8181.
| Crossref | Google Scholar |
Douglas DC, Weinzierl R, Davidson SC, Kays R, Wikelski M, Bohrer G (2012) Moderating Argos location errors in animal tracking data. Methods in Ecology and Evolution 3, 999-1007.
| Crossref | Google Scholar |
Faerber MM, Baird RW (2010) Does a lack of observed beaked whale strandings in military exercise areas mean no impacts have occurred? A comparison of stranding and detection probabilities in the Canary and main Hawaiian Islands. Marine Mammal Science 26, 602-613.
| Crossref | Google Scholar |
Girvan M, Newman MEJ (2002) Community structure in social and biological networks. Proceedings of the National Academy of Sciences USA 99, 7821-7826.
| Crossref | Google Scholar |
Harnish AE, Ault J, Babbitt C, Gulland FMD, Johnson PC, Shaughnessy NL, Wood KA, Baird RW (2019) Survival of a common bottlenose dolphin (Tursiops truncatus) calf with a presumptive gunshot wound to the head. Aquatic Mammals 45, 543-548.
| Crossref | Google Scholar |
Harnish AE, Baird RW, Corsi E, Gorgone AM, Perrine D, Franco A, Hankins C, Sepeta E (2023) Long-term associations of common bottlenose dolphins with a fish farm in Hawai‘i and impacts on other protected species. Marine Mammal Science 39, 794-810.
| Crossref | Google Scholar |
Hill MC, Oleson EM, Bradford AL, Martien KK, Steel D, Baker CS (2020) Assessing cetacean populations in the Mariana Archipelago: a summary of data and analyses arising from Pacific Islands Fisheries Science Center surveys from 2010 to 2019. NOAA Technical Memorandum NMFS-PIFSC-108. National Oceanic and Atmospheric Administration. doi:10.25923/wrye-6h14
Jacobson EK, Henderson EE, Miller DL, Oedekoven CS, Moretti DJ, Thomas L (2022) Quantifying the response of Blainville’s beaked whales to U.S. naval sonar exercises in Hawaii. Marine Mammal Science 38, 1549-1565.
| Crossref | Google Scholar |
Jarvis SM, Henderson EE, Brookens TJ, Webster DL (2019) Acoustic observation of the reaction of rough-toothed dolphin (Steno bredanensis) to vocalizations, most likely from killer whales (Orcinus orca), off Kaua‘i. Marine Mammal Science 35, 1092-1098.
| Crossref | Google Scholar |
Jenner C, Jenner MN, Forestell PH (1989) Repeated behavioral observations of six photo-identified adult pygmy killer whales during one month prior to stranding by three members of the group. In ‘Abstracts of the 8th Biennial Conference on the Biology of Marine Mammals’. (Society for Marine Mammalogy: Pacific Grove, California)
Johnson DS, London JM (2018) Crawl: An r package for fitting continuous-time correlated random walk models to animal movement data. Zenodo
| Crossref | Google Scholar |
Johnson DS, London JM, Lea M-A, Durban JW (2008) Continuous-time correlated random walk model for animal telemetry data. Ecology 89, 1208-1215.
| Crossref | Google Scholar |
Kratofil MA, Ylitalo GM, Mahaffy SD, West KL, Baird RW (2020) Life history and social structure as drivers of persistent organic pollutant levels and stable isotopes in Hawaiian false killer whales (Pseudorca crassidens). Science of the Total Environment 733, 138880.
| Crossref | Google Scholar |
Kratofil MA, Harnish AE, Mahaffy SD, Henderson EE, Bradford AL, Martin SW, Lagerquist BA, Palacios DM, Oleson EM, Baird RW (2023) Biologically important areas II for cetaceans within U.S. and adjacent waters—Hawai‘i region. Frontiers in Marine Sciences 10, 1053581.
| Crossref | Google Scholar |
Legrand V, Monticelli D (2020) Rare sighting of pygmy killer whales Feresa attenuata off São Nicolau Island, Cabo Verde. Zoologia Caboverdiana 8, 66-68.
| Google Scholar |
London JM (2020) Pathroutr: an R package for (re-)routing paths around barriers (version v0.1.1-beta). Zenodo. Available at https://doi.org/10.5281/zenodo.4321827
Lopez R, Malardé J-P, Danés P, Gaspar P (2015) Improving Argos doppler location using multiple-model smoothing. Animal Biotelemetry 3, 32.
| Crossref | Google Scholar |
Mahaffy SD, Baird RW, McSweeney DJ, Webster DL, Schorr GS (2015) High site fidelity, strong associations, and long-term bonds: short-finned pilot whales off the island of Hawai‘i. Marine Mammal Science 31, 1427-1451.
| Crossref | Google Scholar |
Mahaffy SD, Baird RW, Harnish AE, Cullins T, Stack SH, Currie JJ, Bradford AL, Salden DR, Martien KK (2023) Identifying social clusters of endangered main Hawaiian Islands false killer whales. Endangered Species Research 51, 249-268.
| Crossref | Google Scholar |
Mazzuca L, Atkinson S, Keating B, Nitta E (1999) Cetacean mass strandings in the Hawaiian archipelago, 1957–1998. Aquatic Mammals 25, 105-114.
| Google Scholar |
McSweeney DJ, Baird RW, Mahaffy SD (2007) Site fidelity, associations, and movements of Cuvier’s (Ziphius cavirostris) and Blainville’s (Mesoplodon densirostris) beaked whales off the island of Hawai‘i. Marine Mammal Science 23, 666-687.
| Crossref | Google Scholar |
McSweeney DJ, Baird RW, Mahaffy SD, Webster DL, Schorr GS (2009) Site fidelity and association patterns of a rare species: pygmy killer whales (Feresa attenuata) in the main Hawaiian Islands. Marine Mammal Science 25, 557-572.
| Crossref | Google Scholar |
Miller SA, Dykes DD, Polesky HF (1988) A simple salting out procedure for extracting DNA from human nucleated cells. Nucleic Acids Research 16, 1215.
| Crossref | Google Scholar |
Morin PA, Nestler A, Rubio-Cisneros NT, Robertson KM, Mesnick SL (2005) Interfamilial characterization of a region of the ZFX and ZFY genes facilitates sex determination in cetaceans and other mammals. Molecular Ecology 14, 3275-3286.
| Crossref | Google Scholar |
Newman MEJ, Girvan M (2004) Finding and evaluating community structure in networks. Physical Review E 69, 026113.
| Crossref | Google Scholar |
Pebesma E (2018) Simple features for R: standardized support for spatial vector data. The R Journal 10, 439-446.
| Crossref | Google Scholar |
Pebesma E, Bivand R (2023) ʻSpatial data science: with applications in R.’ (Chapman and Hall/CRC: London). doi:10.1201/9780429459016. Available at https://r-spatial.org/book/
Pryor T, Pryor K, Norris KS (1965) Observations on a pygmy killer whale (Feresa attenuata Gray) from Hawaii. Journal of Mammalogy 46, 450-461.
| Crossref | Google Scholar |
Pulis EE, Wells RS, Schorr GS, Douglas DC, Samuelson MM, Solangi M (2018) Movements and dive patterns of pygmy killer whales (Feresa attenuata) released in the Gulf of Mexico following rehabilitation. Aquatic Mammals 43, 555-567.
| Crossref | Google Scholar |
Rosel PE, Dizon AE, Heyning JE (1994) Genetic analysis of sympatric morphotypes of common dolphins (genus Delphinus). Marine Biology 119, 159-167.
| Crossref | Google Scholar |
Schorr GS, Baird RW, Hanson MB, Webster DL, McSweeney DJ, Andrews RD (2009) Movements of satellite-tagged Blainville’s beaked whales off the island of Hawai‘i. Endangered Species Research 10, 203-213.
| Crossref | Google Scholar |
Stack SH, Olson GL, Neamtu V, Machernis AF, Baird RW, Currie JJ (2020) Identifying spinner dolphin Stenella longirostris longirostris movement and behavioral patterns to inform conservation strategies in Maui Nui, Hawai‘i. Marine Ecology Progress Series 644, 187-197.
| Crossref | Google Scholar |
Tyack P (1981) Interactions between singing Hawaiian humpback whales and conspecifics nearby. Behavioral Ecology and Sociobiology 8, 105-116.
| Crossref | Google Scholar |
Van Cise AM, Mahaffy SD, Baird RW, Mooney TA, Barlow J (2018) Song of my people: dialect differences among sympatric social groups of short-finned pilot whales in Hawai‘i. Behavioral Ecology and Sociobiology 72, 193.
| Crossref | Google Scholar |
Van Cise AM, Baird RW, Harnish AE, Currie JJ, Stack SH, Cullins T, Gorgone AM (2021) Mark-recapture estimates suggest declines in abundance of common bottlenose dolphin stocks in the main Hawaiian Islands. Endangered Species Research 45, 37-53.
| Crossref | Google Scholar |
Vanderzee A, Mahaffy SD, Verbeck DS, Johnson PC, Cullins T, Baird RW (2019) Keep an eye on me: using underwater photos and video from citizen science to evaluate prevalence of injury in pygmy killer whales in Hawai‘i. In ‘Poster presented at the World Marine Mammal Conference, December 2019, Barcelona, Spain. Available at cascadiaresearch.org/files/Vanderzee_etal2019WMMC.pdf (Society for Marine Mammalogy)
Whitehead H (2009) SOCPROG programs: analyzing animal social structures. Behavioral Ecology and Sociobiology 63, 765-778.
| Google Scholar |
Footnotes
6 Some details on the August and September 2019 stranding events have been presented in Currie et al. (2021).