

Age and growth of the silky shark Carcharhinus falciformis (Muller & Henle, 1839) in the Ecuadorian Pacific
Christopher Mera A * , Diego Mejía B , Smith Vera-Mera A , Steven Tamayo-Vega A , Felipe Galván-Magaña B , Michael Veléz-Soledispa A and Jesús Briones-Mendoza A
A
B
Abstract
Carcharhinus falciformis (silky shark) ranks third in elasmobranch landings in the Ecuadorian Pacific. However, there is limited and outdated information about its life history, making it challenging to propose management strategies.
To determine the age and growth parameters of C. falciformis in the southern Ecuadorian Pacific.
At the artisanal port ‘Playita Mía’, vertebral samples were collected from 290 specimens (161 females and 129 males) and sectioned sagittally to estimate age. A Bayesian and frequentist multimodel approach (von Bertalanffy, Gompertz, and Logistic) was used for length-at-age analysis.
Sizes ranged from 79.2 cm to 238 cm total length (TL), with age groups estimated between 0 and 19 years. The Bayesian von Bertalanffy growth model provided the best fit according to the leave-one-out information criterion (LOOIC). The estimates were: (1) for combined sexes, L∞ = 271.54 cm TL, k = 0.09 years−1, and L0 = 72.21 cm TL; (2) for females, L∞ = 271.83 cm TL, k = 0.09 years−1, and L0 = 71.61 cm TL; and (3) for males, L∞ = 273.60 cm TL, k = 0.08 years−1, and L0 = 72.99 cm TL.
This study demonstrates that C. falciformis is a slow-growing species, making it susceptible to overfishing.
The findings provide valuable information for future population and demographic analyses of this species.
Keywords: age and growth, Bayesian method, Carcharhinus falciformis, Ecuador, elasmobranch, fisheries, frequentist method, multimodel growth.
Introduction
Age and growth studies are essential for fisheries management (Goldman et al. 2012). The parameters estimated from these studies (e.g. asymptotic length, growth rate, and birth size) support population models used in management, such as virtual population analysis, ecological risk assessments, yield per recruit, and demographic models (Au and Smith 1997; Liu et al. 2006; Grant et al. 2020). This information helps develop strategies that ensure sustainable resource use while protecting future populations (Cortés et al. 2012). However, age and growth parameters can vary by region for some shark species (Driggers et al. 2004; Smart et al. 2015). Therefore, region-specific data are vital for effective management and conservation (Cailliet et al. 2005; Grant et al. 2018). This is especially important for species with life history traits such as slow growth, late sexual maturity, and low reproductive output, which make them highly vulnerable to fishing pressure, such as sharks (Cortés 2000).
The silky shark, Carcharhinus falciformis (Müller & Henle 1839), is a semi-pelagic species of the family Carcharhinidae, commonly found in tropical and subtropical regions of the Pacific, Indian, and Atlantic Oceans (Garrick 1982; Compagno 1984). It inhabits depths from the surface to at least 500 m, with a greater presence near the edges of continental and insular shelves, as well as over deep-water reefs and in the open sea (Compagno et al. 2005; Bonfil 2008). This species exhibits low reproductive potential, characterised by placental viviparity with litters in the range of 2–14 pups (Bonfil et al. 1993; Alejo-Plata et al. 2016), late sexual maturity (Grant et al. 2018), and a gestation period of up to 12 months (Branstetter 1987; Bonfil et al. 1993; Cadena-Cárdenas 2001). C. falciformis is classified as Vulnerable (VU) by the International Union for Conservation of Nature (IUCN) (Rigby et al. 2021) and is listed in Appendix II of the Convention on International Trade in Endangered Species of Wild Fauna and Flora (CITES 2022).
In Ecuador, C. falciformis is incidentally caught by industrial and artisanal longline or gillnet fleets, comprising 15% of total shark catches during the period 2003–2006 (Martínez-Ortíz et al. 2007), 8.29% in 2012 (Coello and Herrera 2018), and 10.7% in 2019 (Briones-Mendoza et al. 2022). Among sharks commonly landed in Ecuadorian waters, C. falciformis consistently ranks third (Briones-Mendoza et al. 2022). Research on C. falciformis in Ecuador has primarily focused on its feeding habits (Galván-Magaña et al. 2013; Estupiñán-Montaño et al. 2018; Páez-Rosas et al. 2018), reproductive aspects (Martínez-Ortíz et al. 2011; Briones-Mendoza et al. 2022), size composition of the catch (Martínez-Ortíz et al. 2007; Carr et al. 2013; Coello and Herrera 2018; Cerutti-Pereyra et al. 2020; Briones-Mendoza et al. 2022), genetic identification (Manzanillas Castro and Acosta-López 2022), post-release survival (Schaefer et al. 2019), and bioaccumulation (Maurice et al. 2021). However, little is known about its life history in Ecuador (Mejía et al. 2023). Therefore, it is important to gather information on these aspects to inform conservation and management efforts.
Globally, studies on the age and growth of C. falciformis have been conducted (Branstetter 1987; Bonfil et al. 1993; Oshitani et al. 2003; Joung et al. 2008; Sánchez-de Ita et al. 2011; Hall et al. 2012; Grant et al. 2018; Santander-Neto et al. 2021); however, in Ecuador, research on this species is limited to a Bachelor’s thesis from over a decade ago (Gilces-Anchundia 2013), which employs a single frequentist growth model. This approach is insufficient, as sharks are dynamic resources whose life history parameters can change over time due to fishing pressure (Stevens et al. 2000). For instance, a reduction in body size, often observed in exploited populations, can influence growth rates and age at maturity (Carlson and Baremore 2003). This biological variability underscores the need for continuous updates (de Santana et al. 2020). Furthermore, age and growth studies face challenges related to biased sampling due to the selectivity of fishing gear, making it difficult to obtain the minimum and maximum sizes required to define the extremes of growth curves (Smart and Grammer 2021). Such biases can lead to the under-estimation or over-estimation of parameters (Harry et al. 2022). Additionally, several studies recommend adopting a multimodel approach, rather than assuming that the von Bertalanffy model always provides the best fit (Katsanevakis 2006; Katsanevakis and Maravelias 2008; Smart et al. 2016). In this context, Bayesian multimodel approaches are key, as they allow for the inclusion of prior information from the literature, unlike frequentist approaches, which only consider data obtained from samples and work well when there is a broad size range. However, when the size range is limited, frequentist models may not be the most suitable (Smart and Grammer 2021). Therefore, in this study, we employed both frequentist and Bayesian approaches to determine which method yields the most biologically realistic estimates. This dual approach aims to improve parameter estimation and provide a more robust basis for management decisions.
Given the importance of life history parameters in fisheries management (Francis 2016), this research aimed to estimate the age and growth parameters of C. falciformis in Ecuadorian waters using a frequentist and Bayesian multimodel approach based on sectioned vertebral centra. This information is essential for future demographic analyses and stock assessment models.
Materials and methods
Sampling
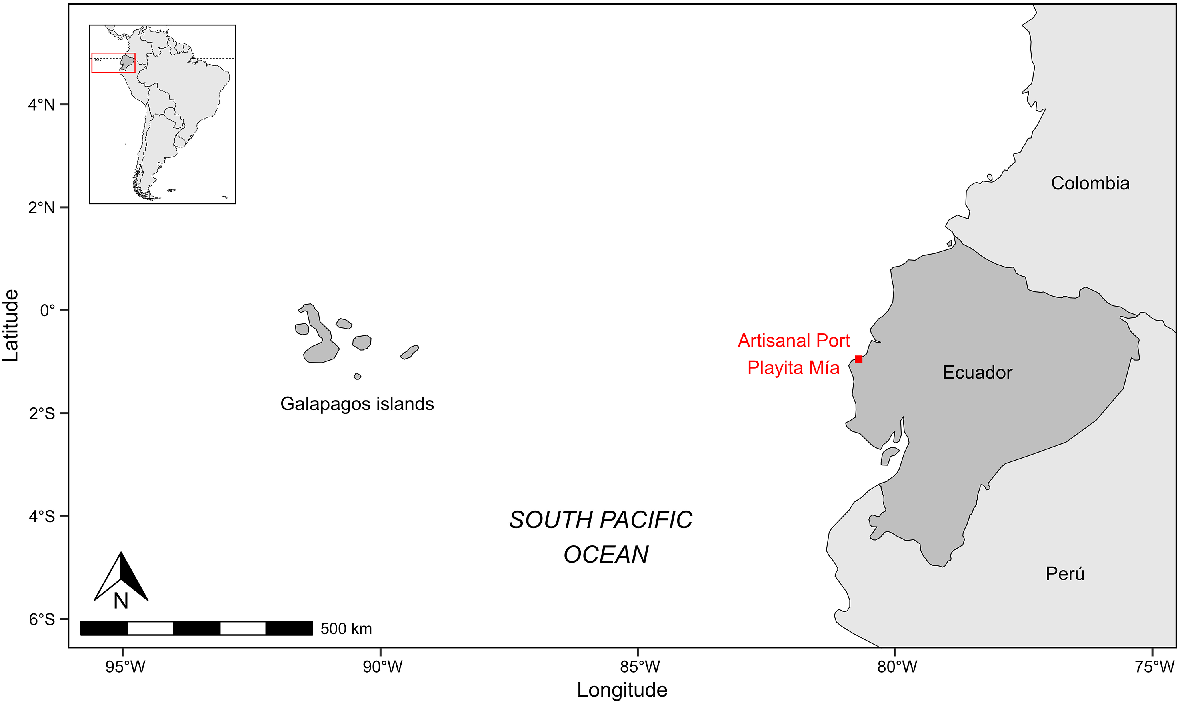
Field surveys were conducted at the ‘Playita Mía’ landing site in Manta, Ecuador, from September 2021 to September 2022 (Fig. 1). Fisheries in this area operate using fibreglass vessels equipped with longlines and gillnets. The primary target species are teleost fishes from the Scombridae, Istiophoridae, and Coryphaenidae families, while elasmobranchs frequently occur as incidental catch year-round.
Upon landing, biometric data were collected from 542 sharks (see Supplementary Table S1). Of these, some had already been processed for commercial use, preventing vertebral sampling, so vertebrae were obtained from only 290 individuals. Sex was determined based on the presence (males) or absence (females) of claspers. Measurements, including total length (TL), fork length (FL), pre-caudal length (PCL), and interdorsal length (IDL) were recorded using a centimetre-graded measuring tape. As some sharks were landed eviscerated or without caudal fins or heads, morphometric relationships were established to enable comparisons across studies. Simple linear regressions were used to assess the relationships between TL and other length measurements (PCL, FL, and IDL), with coefficient of determination values and F-tests applied to evaluate statistical significance, as has been done in other shark studies (e.g. De Wysiecki and Braccini 2017; Mejía and Briones-Mendoza 2024).
Sample processing and cutting
The vertebrae were extracted from the cervical region of each shark and subsequently frozen. The processing of the vertebral centra following the methods described by Cailliet and Goldman (2004). For preservation, samples were stored frozen for several months before cleaning. To clean, vertebrae were immersed in hot water and treated with a 5% sodium hypochlorite (NaClO) solution for several minutes to soften excess tissue and facilitate removal.
For subsequent readings, the vertebral centra were longitudinally sectioned to 0.3 mm using a low-speed IsoMet saw with a double diamond disc, then stained with silver nitrate (AgNO₃) to enhance growth band pair visibility. The sections were mounted on slides and observed under transmitted light for improved visualisation.
Age estimation
Independently, two readers conducted readings of the sectioned vertebral centra from photographs, without prior knowledge of the shark’s total length or sex. Using transmitted light and a stereomicroscope with an integrated camera, they analysed band pairs (one opaque and one translucent) along the corpus calcareum. Following the widely accepted methodology for age estimation in elasmobranchs (Cailliet and Goldman 2004), each band pair was assumed to represent 1 year of individual growth. This assumption is based on previous studies that have verified, through indirect methods, the annual band pair deposition in C. falciformis (Joung et al. 2008; Hall et al. 2012). It was assumed that the birth mark was the first translucent band accompanied by a change in the angle of the corpus calcareum. Therefore, this first translucent band, along with the adjacent opaque band, was interpreted as representing age 0. A band pair was considered complete if it extended from the corpus calcareum on the left side of the section, traversed through the intermedialia, and continued back through the corpus calcareum on the right side. Agreement between both readers estimated the age; in cases of disagreement, consensus was reached through discussion. If no consensus was reached, the sample was discarded (D’Alberto et al. 2017).
To assess precision and bias, the percentage of agreement between readers (PA) (Goldman 2005), average percentage error (APE) (Beamish and Fournier 1981), and the coefficient of variation (CV) (Chang 1982) were utilised (Table 1). Systematic bias in the counts between readers was statistically evaluated using Bowker’s symmetry test. The bias plot from Campana et al. (1995), along with the analyses of precision and bias, were calculated using the FSA package (Ogle 2018). All analyses in this study were conducted within the R programming language ver. 2024.12.0.467 (R Core Team 2020).
| Indexes | Equations | Reference | |
|---|---|---|---|
| Percentage of agreement between readers | Goldman (2005) | ||
| Average percentage error | Beamish and Fournier (1981) | ||
| Coefficient of variation | Chang (1982) |
R, number of times the age of the shark was calculated; Xj, average age calculated for the j-th shark; Xij, i-th age calculated for the j-th shark.
Age verification
The formation of band pairs was verified using two widely recognised methods in shark age and growth studies: (1) the marginal increment ratio (MIR); and (2) centrum edge analysis (CEA). Band pair measurements; i.e. the radius of the vertebra and each of its band pairs was measured from the centre of the vertebrae to the centre of each band pair. Measurements were performed using ImageJ 1.54 g software (Schneider et al. 2012) under transmitted light with a stereomicroscope Pallipartners (1080p, 12 MP) equipped with an integrated camera. Adobe Photoshop ver. 21.0.2 was then used to adjust brightness and contrast, optimising band pair clarity. Since the vertebral samples were collected over a 12-month period, MIR was employed to indirectly verify ageing protocols (Natanson et al. 1995):
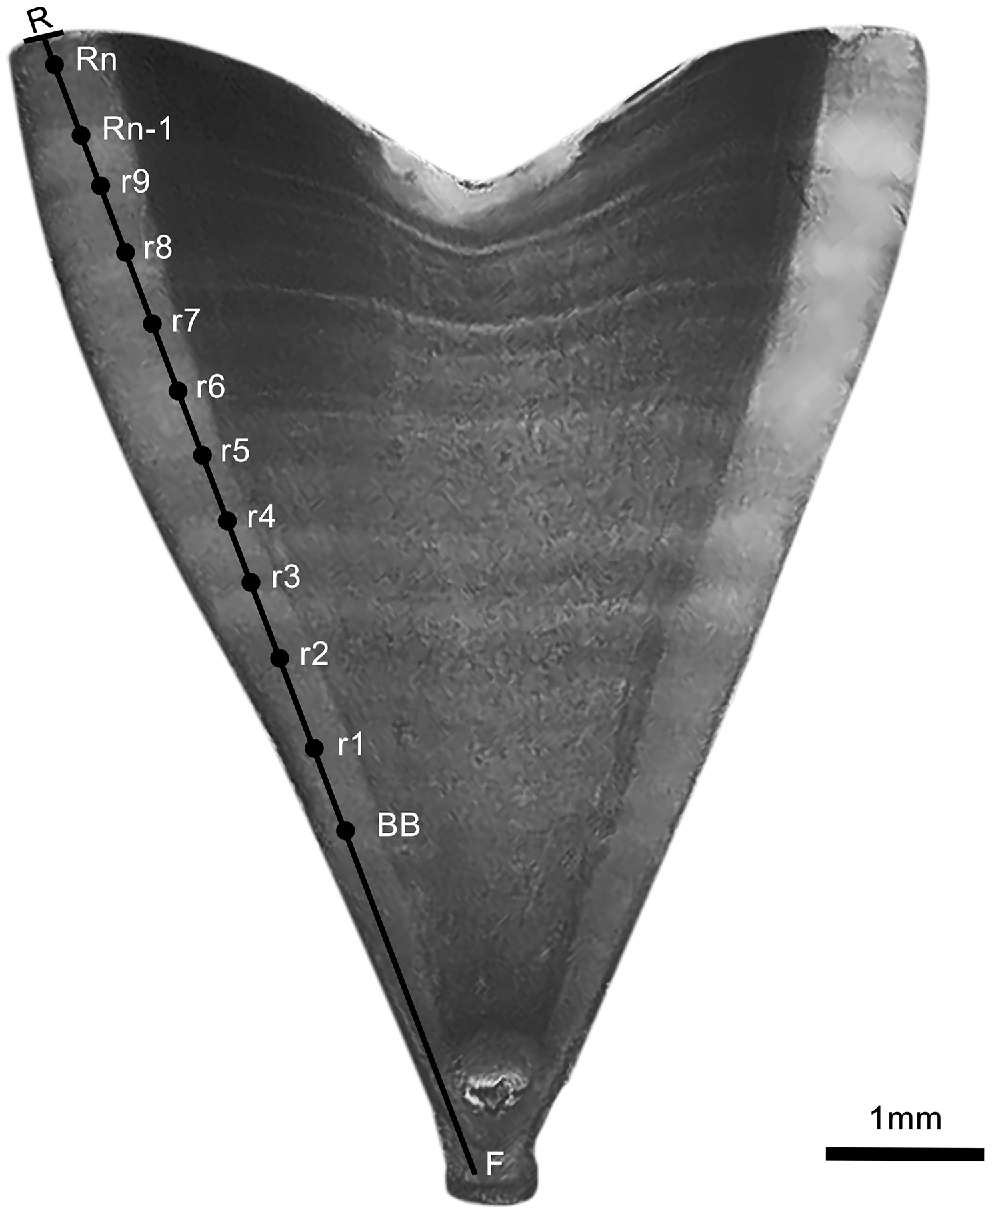
where Vr is the vertebral radius, Rn the last complete band, and Rn−1 is the band next to last complete band (Fig. 2).
Photograph of a sectioned vertebral centrum with a thickness of 0.3 mm, corresponding to a male Carcharhinus falciformis captured in the Ecuadorian South Pacific measuring 181.4 cm TL, with an estimated age of 11 years. The photo was taken prior to staining. F, focus; BB, birth band; r, annual bands; Rn-1, penultimate band; Rn, last band; R, ribbon radius.
Additionally, CEA was used to complement MIR in verifying the formation of growth band pairs (Cailliet and Goldman 2004). This analysis enables the classification of vertebral centra edges as either opaque or translucent, based on the month of the year. Furthermore, the statistical method developed by Okamura and Semba (2009) was applied to validate the periodicity of the band pair formation using three models: (1) acyclic (N); (2) annual (A); (3) and biennial (B). The model that best fit the data was selected based on the lowest value of the Akaike Information Criterion (AIC) (Burnham and Anderson 2002).
Growth models
Two analytical approaches were employed to determine which method yields the most biologically plausible estimates: (1) the frequentist; and (2) Bayesian approaches. To avoid assuming an a priori model that may be inappropriate, three growth models were applied in both approaches: (1) the von Bertalanffy Growth Function (VBGF; von Bertalanffy 1938); (2) the Logistic model (Log; Ricker 1979); and (3) the Gompertz model (Gom; Gompertz 1825) (Table 2). Model selection for the frequentist approach was based on minimising the AIC, whereas for the Bayesian approach, the Leave-One-Out Information Criterion (LOOIC) was employed, with higher weights indicating a better model fit. All models utilised L0 (length-at-birth) instead of t0 (age when length is zero), as the latter does not have a consistent definition across different growth models, whereas L0 universally refers to the length at birth (Smart et al. 2016; Smart 2019). Moreover, the biological significance of L0 is more meaningful in this context than t0.
| Growth models | Equations | Reference | |
|---|---|---|---|
| von Bertalanffy | von Bertalanffy (1938) | ||
| Logistic | Ricker (1979) | ||
| Gompertz | Gompertz (1825) |
Lt, length at age t; L0, length at age 0; L∞, asymptotic length; k and g, respective growth coefficients of each model.
Frequentist models generally perform well when a broad size range is available (Smart and Grammer 2021). However, when the size range is narrow or biased, this can lead to under-estimation or over-estimation of age and growth parameters (Harry et al. 2022). Therefore, in this study, we tested this by applying both frequentist and Bayesian approaches. For the frequentist approach, models were fitted using nonlinear least squares via the AquaticLifeHistory package, employing the function ‘Estimate_Growth’ (Smart et al. 2016; Smart 2019).
The Bayesian approach is particularly suitable for situations where large specimens are scarce, likely due to fishing gear selectivity, as it effectively handles missing data and incorporates prior biological knowledge. Both small and large sharks are critical to accurately characterising the extremes of the growth curve; omitting these sizes may lead to inaccuracies in growth parameter estimation, potentially causing over- or under-estimation (Smart and Grammer 2021). The Bayesian framework effectively handles missing data and incorporates informative priors from biological knowledge (prior distributions), improving parameter estimates and reducing uncertainty in growth models. This is particularly beneficial when length-at-age data (likelihood distributions) are limited, especially for extreme sizes of captured individuals (Smart and Grammer 2021). Using the ‘Estimate_MCMC_Growth’ function in the BayesGrowth package (Smart 2020), the Bayesian analysis incorporated prior information for four key parameters: (1) L0 (length-at-birth); (2) L∞ (asymptotic length); (3) k/g (growth coefficients); and (4) σ (residual s.e.). This was achieved via the Markov Chain Monte Carlo (MCMC) method, where length-at-birth and asymptotic length were modelled using normal distributions with defined means (μ) and s.e. (σ):
Accordingly, the average minimum and maximum lengths reported in the scientific literature for the Pacific were used as prior values for L0 and L∞, respectively (Oshitani et al. 2003: Lmin = 81 cm LT, Lmax = 292 cm TL; Joung et al. 2008: Lmin = 75.5 cm TL, Lmax = 256 cm TL; Martínez-Ortíz et al. 2011: Lmin = 62 cm TL, Lmax = 309 cm TL; Sánchez-de Ita et al. 2011: Lmin = 76.5 cm TL, Lmax = 260 cm TL; Grant et al. 2018: Lmin = 71 cm TL, Lmax = 271.3 cm TL; Briones-Mendoza et al. 2022: Lmin = 66 cm TL, Lmax = 272 cm TL). Therefore, the prior values for L0 and L∞ were defined as:
For the growth coefficient and residual s.e., uniform distributions were specified:
These priors were non-informative, incorporating only minimum thresholds to ensure realistic parameter ranges (Smart and Grammer 2021). This approach is justified within a multi-model framework, where growth coefficients are not directly comparable, and the majority of C. falciformis studies have employed the VBGF. Therefore, using a non-informative prior ensures that all three candidate models can be specified with identical prior distributions (Emmons et al. 2021). In contrast, L0 and L∞ are comparable across models, warranting the use of informative priors derived from the literature (Smart and Grammer 2021). Thus, k/g were defined as:
The MCMC simulation was conducted with four chains, each running 10,000 iterations with a burn-in of 5000 simulations. Convergence was assessed via the Gelman–Rubin diagnostic, and diagnostic plots for Bayesian growth parameter estimates were generated using the Bayesplot package (Gabry and Mahr 2024; see Supplementary materials).
To test for significant sex-based differences in growth model estimates, the likelihood ratio test (Kimura 1980) was applied in the frequentist framework, whereas the Bayesian approach used posterior distribution overlap assessment between males and females via the overlapping package (Pastore 2018).
Results
Sample collection
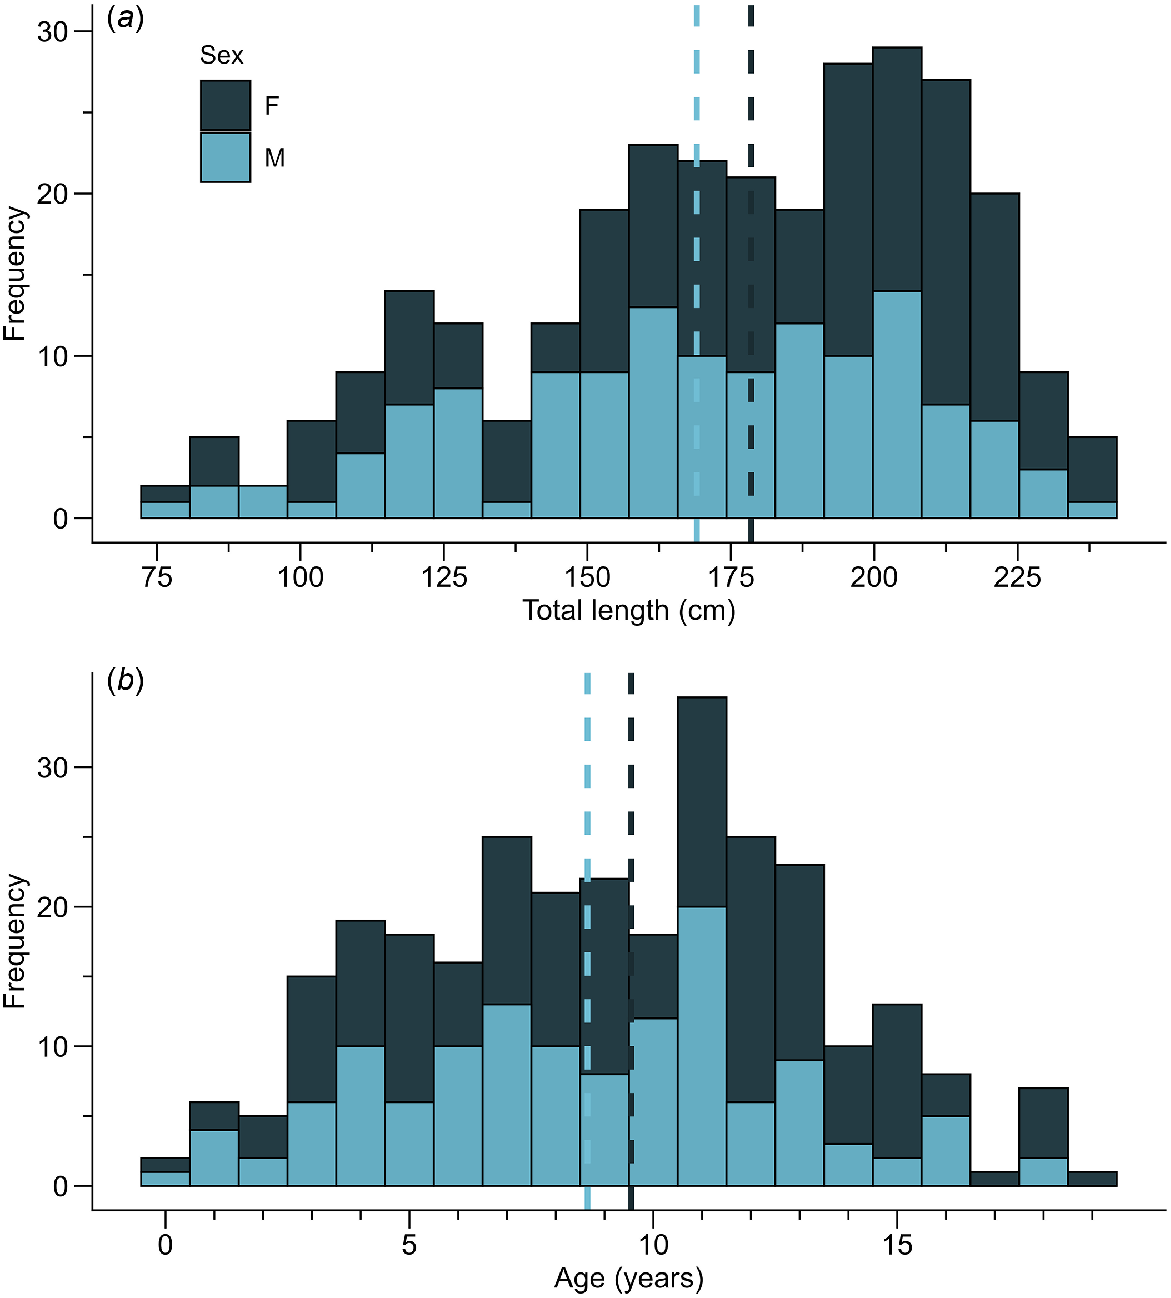
Vertebral samples were collected from 290 individuals of C. falciformis, of which 161 were females (55.52%) and 129 were males (44.48%). Females exhibited lengths ranging from 79.2 cm to 238 cm TL (mean ± s.d.: 178.6 ± 38.17), while males ranged from 80.2 cm to 234.6 cm TL (169.1 ± 36.06). Estimated ages ranged from 0 to 19 years (9.55 ± 4.26) for females and 0 to 18 years (8.65 ± 3.93) for male sharks (Fig. 3). The most common age group in females was 12 years, accounting for 11.8%, while in males, it was the 11-year group, comprising 15.5%. The data met the assumption of homoscedasticity (Bartlett’s test χ2 = 0.45538, d.f. = 1, P = 0.4998; χ2 = 0.93745, d.f. = 1, P = 0.3329 for length and age, respectively); however, they did not meet the assumption of normality (Lilliefors test D = 0.088621, P = 9.709 × 10⁻⁶; D = 0.096942, P = 6.308 × 10⁻⁷ for length and age, respectively). Therefore, the Mann–Whitney U test was used, this indicated significant differences in size distribution (W = 12172, P = 0.0118) but not in ages (W = 11726, P = 0.0582) for both sexes.
Morphometric relationships
Of the 542 specimens measured, all linear regression models showed a strong correlation and a significant fit (R2 > 0.97, P < 0.05) between the different length metrics (TL, FL, PCL, and IDL) for combined sexes, males, and females (Table 3). This allowed the estimation of TL for individuals that arrived mutilated at port (without a head, caudal fin, or both) (Fig. S1), which was subsequently used in age and growth models.
| Sex | n | Y = α + β × X | ||||||||
|---|---|---|---|---|---|---|---|---|---|---|
| Y | X | α | ±s.e. | β | ±s.e. | R2 | P-value | |||
| Combined | 345 | TL | FL | 2.086132 | 1.08 | 1.215449 | 0.01 | 0.99 | <0.05 | |
| 340 | TL | PCL | 4.290620 | 0.84 | 1.321126 | 0.01 | 0.99 | <0.05 | ||
| 343 | TL | IDL | 7.77078 | 1.60 | 3.98752 | 0.04 | 0.97 | <0.05 | ||
| Females | 187 | TL | FL | 0.896283 | 1.13 | 1.228048 | 0.01 | 0.99 | <0.05 | |
| 183 | TL | PCL | 2.512172 | 1.02 | 1.338388 | 0.01 | 0.99 | <0.05 | ||
| 185 | TL | IDL | 4.40334 | 2.01 | 4.09899 | 0.05 | 0.98 | <0.05 | ||
| Males | 158 | TL | FL | 6.68882 | 1.34 | 1.29797 | 0.01 | 0.99 | <0.05 | |
| 157 | TL | PCL | 6.68882 | 1.34 | 1.29797 | 0.01 | 0.99 | <0.05 | ||
| 158 | TL | IDL | 12.05828 | 2.41 | 3.84728 | 0.06 | 0.97 | <0.05 | ||
n, number of specimens; X and Y, variables; α and β, parameters of the relationship; R2, coefficient of determination.
Precision and bias
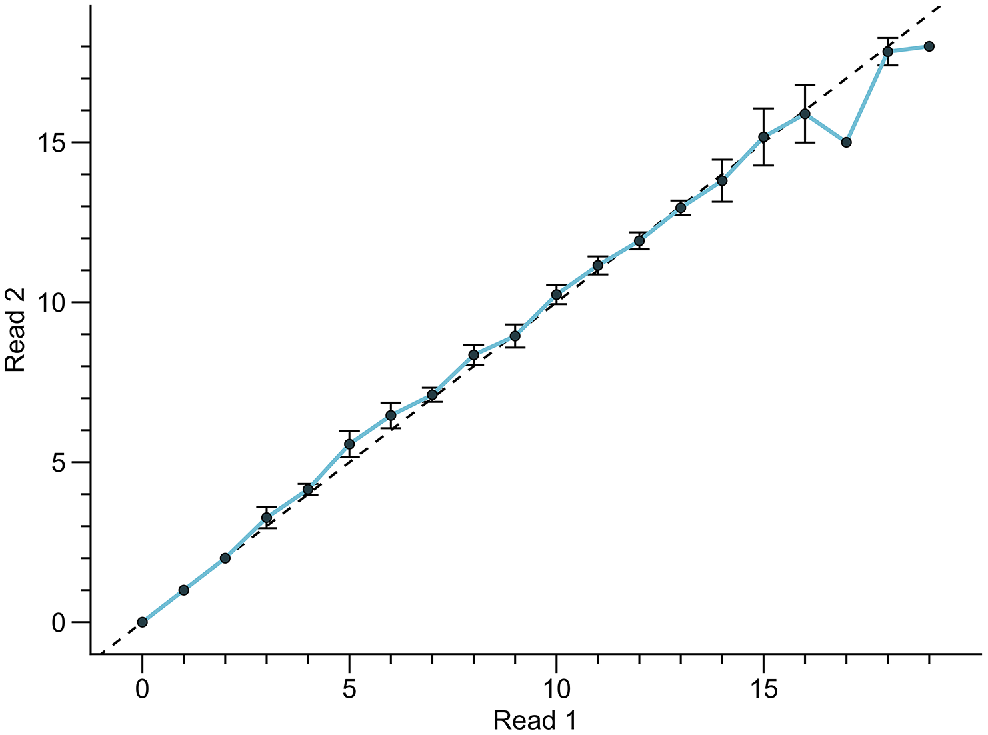
The analysis of precision and bias yielded the following results: CV = 3.33, APE = 2.35, PA = 64.8. There were no significant variations in the bias plot regarding the readings of both readers (Fig. 4), except for age groups >16 years. Despite this, the results of the Bowker symmetry test showed that there was no systematic bias between the readings of the first and second reader (χ2 = 33.66, d.f. = 29, P = 0.29).
Age verification
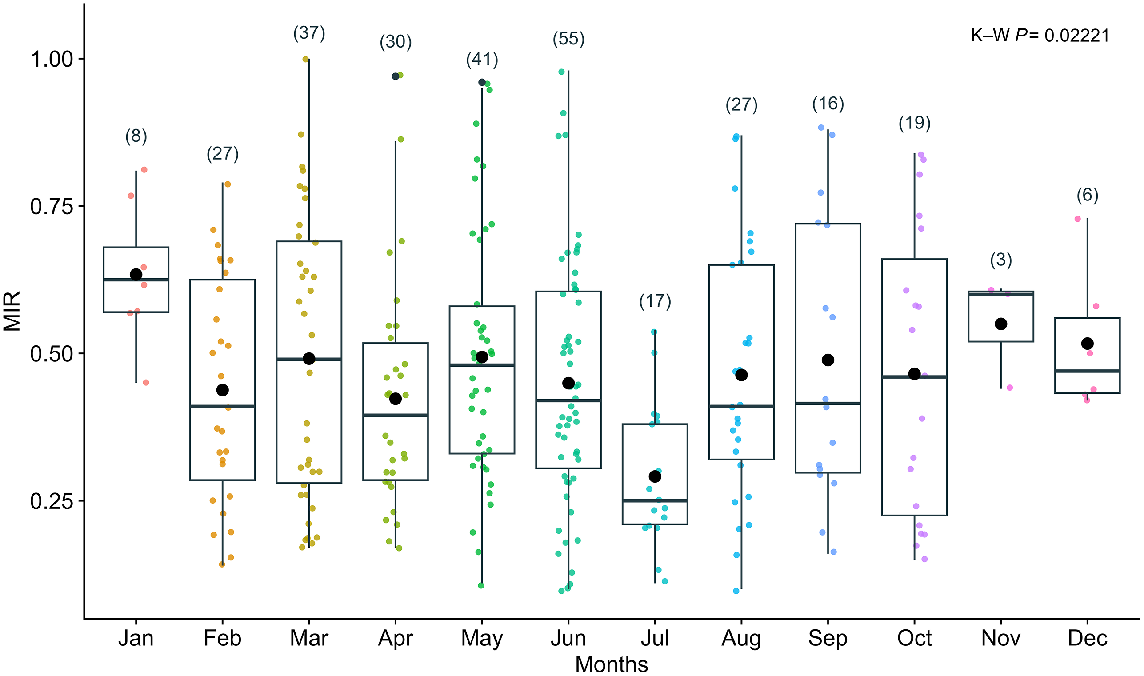
Regarding the marginal increment analysis, the Kruskal–Wallis (K–W) test detected significant differences among the different months (χ2 = 23.2, d.f. = 11, P = 0.02). July had the lowest MIR values, while January had the highest MIR values (Fig. 5). The MIR results possibly suggest that one growth band pair forms per year, between June and July. Opaque edges predominated in January, while translucent edges were more common between July and August (Fig. 6).
Marginal increment ratio (MIR) plot for combined sexes of Carcharhinus falciformis, based on sampling months and the number of samples measured in each month. All age groups with age estimations ≥1 year were included (n = 286). K–W refers to the Kruskal–Wallis statistical test.
Progression of opaque and translucent edges during the sampled months, along with the average sea surface temperature (SST) (n = 286). The numbers reflect the quantity of opaque and translucent bands observed during the different months.

The statistical method of Okamura and Semba (2009), which verifies edge deposition, provided contrasting results to the MIR analysis. It demonstrated that the band pairs of C. falciformis in this study exhibited an acyclic pattern, as indicated by the Akaike Information Criterion (AIC) values (Model N: 398.2564). In comparison, the annual deposition scenario (Model A: 399.088) and biennial deposition (Model B: 401.8413) received less support. However, the AIC difference between Models N and A was less than 2, suggesting that both models were competitive. Nevertheless, following the principle of parsimony, Model N was preferred as the more parsimonious explanation.
Age and growth parameters
In the frequentist analysis, the model that best fit the data was the Logistic model for combined sexes, yielding the following parameters: asymptotic length (L∞) = 230.52 cm TL; growth coefficient (g) = 0.22 year−1; and length-at-birth (L0) = 79.97 cm TL. For females, the parameters were L∞ = 229.17 cm TL, g = 0.23 year−1, and L0 = 77.24 cm TL. For males, the parameters were L∞ was 229.19 cm TL, g = 0.20 year−1, and L0 = 82.07 cm TL (Table 4; Fig. 7). There were no significant differences in the estimated growth parameters between sexes for the von Bertalanffy model (Likelihood ratio test: χ2 = 5.417, P = 0.144), the Logistic model (χ2 = 5.519, P = 0.137), and the Gompertz model (χ2 = 5.517, P = 0.138).
| Sex | Models | Model performance | Growth parameters | |||||||||
|---|---|---|---|---|---|---|---|---|---|---|---|---|
| AIC | AIC_diff | W | L ∞ (cm TL) | s.e. | k/g (year−1) | s.e. | L0 (cm TL) | s.e. | RSE | |||
| Combined | Log | 2405.77 | 0.00 | 0.62 | 230.52 | 4.86 | 0.21 | 0.02 | 79.97 | 3.35 | 15.18 | |
| Gom | 2406.97 | 1.21 | 0.34 | 240.15 | 6.62 | 0.15 | 0.01 | 75.38 | 3.90 | 15.21 | ||
| VB | 2410.90 | 5.13 | 0.05 | 261.08 | 11.28 | 0.09 | 0.01 | 69.76 | 4.88 | 15.31 | ||
| Females | Log | 1331.64 | 0.00 | 0.51 | 229.17 | 5.38 | 0.23 | 0.02 | 77.24 | 4.59 | 14.89 | |
| Gom | 1332.27 | 0.62 | 0.38 | 237.13 | 7.14 | 0.17 | 0.02 | 71.57 | 5.43 | 14.91 | ||
| VB | 1334.75 | 3.11 | 0.11 | 254.01 | 11.52 | 0.11 | 0.02 | 64.16 | 7.08 | 15.03 | ||
| Males | Log | 1076.89 | 0.00 | 0.48 | 229.19 | 8.77 | 0.20 | 0.02 | 82.07 | 4.96 | 15.40 | |
| Gom | 1077.48 | 0.59 | 0.36 | 240.32 | 12.20 | 0.15 | 0.02 | 78.44 | 5.67 | 15.44 | ||
| VB | 1079.03 | 2.14 | 0.16 | 265.06 | 21.88 | 0.09 | 0.02 | 74.25 | 6.83 | 15.53 | ||
VBGF, von Bertalanffy model; Gom, Gompertz; Log, logistic; AIC, Akaike Information Criterion; AIC, difference between AIC values; W, Akaike Information Criterion weight; L∞, asymptotic length; k, von Bertalanffy growth coefficient; g, Gompertz and logistic growth coefficients; L0, length at birth; RSE, residual standard error. Values in bold indicate the model that best fit the observed values according to AIC.
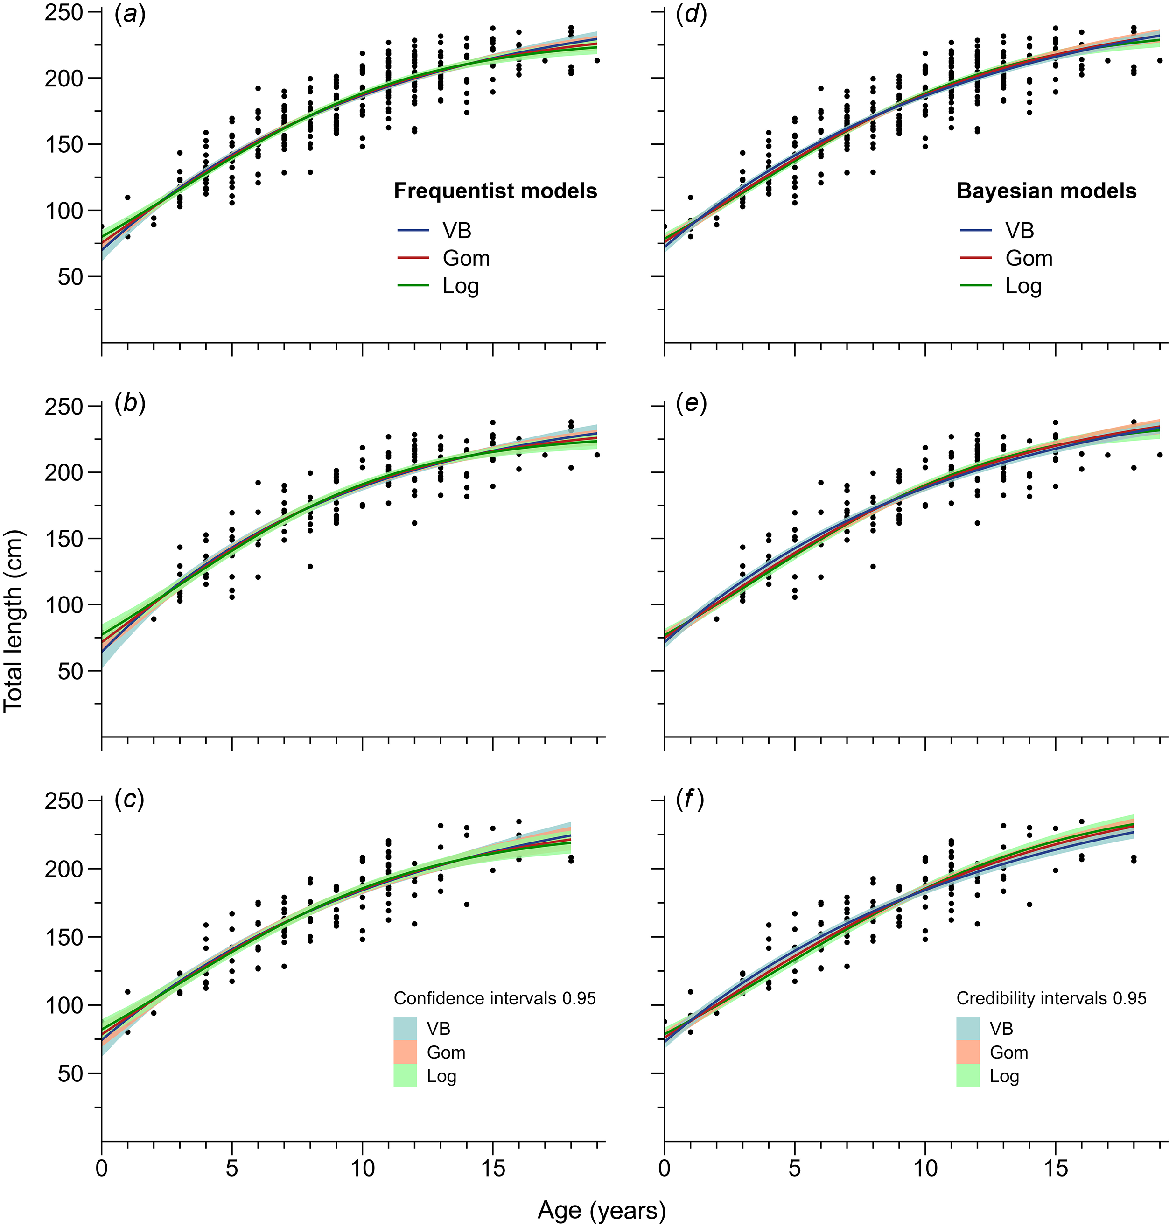
Growth curves for (a) combined sexes, (b) females, and (c) males using frequentist methods, and (d) combined sexes, (e) females, and (f) males using Bayesian methods for Carcharhinus falciformis. Points represent observed age-by-size values (n = 290), and the range of curves reflects 95% confidence and credibility intervals for frequentist and Bayesian analyses, respectively. The best-fitting models were the von Bertalanffy model for the Bayesian framework and the Logistic model for the frequentist approach.
For the Bayesian approach, the Gelman–Rubin test statistics indicated convergence in the growth parameters of the VBGF model for combined sexes (L∞ = 1.001404, k = 1.001250, L0 = 1.000054, σ = 1.000083; Figs S2 and S3), females (L∞ = 1.0001456, k = 1.0002739, L0 = 1.0002721, σ = 0.9999791, Figs S4, S5), and males (L∞ = 1.0001694, k = 1.0001526, L0 = 1.0001463, σ = 0.9998547; Figs S6 and S7). The model that provided the best estimations was the VBGF for combined sexes (L∞ = 271.54 cm TL, k = 0.09 year−1, L0 = 72.21 cm TL), females (L∞ = 271.83 cm TL, k = 0.09 year−1, L0 = 71.61 cm TL), and males (L∞ = 273.60 cm TL, k = 0.08 year−1, L0 = 72.99 cm TL) (Table 5; Fig. 7), according to LOOIC. The age and growth data extracted from the VBGF model showed an overlap between sexes of 78.52%, 57.51%, and 89.87% for the parameters L0, k, and L∞, respectively (Fig. S20). Therefore, the growth estimates obtained from the models were interpreted for combined sexes.
| Sex | Models | Model performance | Growth parameters | ||||||||||||||
|---|---|---|---|---|---|---|---|---|---|---|---|---|---|---|---|---|---|
| LOOIC | s.e. | W | L ∞ (cm TL) | s.e. | s.d. | k/g (year−1) | s.e. | s.d. | L0 (cm TL) | s.e. | s.d. | σ | s.e. | s.d. | |||
| Combined | VB | 2408.82 | 23.11 | 0.44 | 271.54 | 0.07 | 6.69 | 0.09 | 0.00 | 0.01 | 72.21 | 0.02 | 2.32 | 15.37 | 0.01 | 0.63 | |
| Gom | 2409.46 | 23.74 | 0.32 | 252.74 | 0.07 | 5.95 | 0.14 | 0.00 | 0.01 | 76.06 | 0.02 | 2.27 | 15.38 | 0.01 | 0.64 | ||
| Log | 2410.04 | 24.20 | 0.24 | 238.75 | 0.06 | 4.90 | 0.20 | 0.00 | 0.01 | 78.54 | 0.03 | 2.22 | 15.38 | 0.01 | 0.66 | ||
| Females | VB | 1333.39 | 18.69 | 0.69 | 271.83 | 0.08 | 7.01 | 0.09 | 0.00 | 0.01 | 71.61 | 0.02 | 2.53 | 15.15 | 0.01 | 0.86 | |
| Gom | 1335.73 | 18.92 | 0.22 | 255.58 | 0.08 | 6.71 | 0.14 | 0.00 | 0.01 | 74.81 | 0.03 | 2.50 | 15.26 | 0.01 | 0.87 | ||
| Log | 1337.42 | 19.20 | 0.09 | 241.67 | 0.07 | 5.80 | 0.21 | 0.00 | 0.01 | 76.87 | 0.03 | 2.46 | 15.32 | 0.01 | 0.91 | ||
| Males | VB | 1075.75 | 14.09 | 0.92 | 273.60 | 0.08 | 7.60 | 0.08 | 0.00 | 0.01 | 72.99 | 0.02 | 2.55 | 15.63 | 0.01 | 1.00 | |
| Gom | 1080.64 | 14.81 | 0.08 | 262.88 | 0.09 | 7.75 | 0.13 | 0.00 | 0.01 | 76.16 | 0.02 | 2.42 | 15.90 | 0.01 | 1.02 | ||
| Log | 1087.04 | 15.29 | 0.00 | 252.86 | 0.09 | 7.81 | 0.18 | 0.00 | 0.01 | 78.67 | 0.03 | 2.43 | 16.28 | 0.01 | 1.09 | ||
VB, von Bertalanffy model, Gom, Gompertz; Log, Logistic; LOOIC, Leave-One-Out Information Criterion; W, Leave-One-Out Information Criterion weight. L∞, asymptotic length; k, von Bertalanffy growth coefficient; g, Gompertz and Logistic growth coefficients; L0, length at birth; σ, sigma. Values in bold indicate the model that best fit the observed values according to LOOIC.
Discussion
This study assessed the age and growth of C. falciformis in the southern Ecuadorian Pacific using two approaches: (1) frequentist; and (2) Bayesian. Additionally, a multimodel approach was applied to evaluate the data fit against growth models commonly used for elasmobranchs (Smart et al. 2016). The estimates obtained here for growth parameters could be valuable for future population models and demographic analyses in the region, thereby informing various fisheries management scenarios.
Morphometric relationships
Shark landings in Ecuador are very common throughout the year, with most of these sharks being eviscerated when they arrive at artisanal ports. This activity complicates the collection of morphometric measurements due to the absence of their extremities, resulting in a lack of information regarding their lengths, which are crucial for fisheries management (De Wysiecki and Braccini 2017; Mejía and Briones-Mendoza 2024). Considering these issues, our study established new coefficients to estimate TL from partial length measurements of C. falciformis. The choice of equation for future studies will largely depend on the condition in which the shark arrives at port. For instance, if a shark is missing only its caudal fin, the TL-PCL relationship may be the most appropriate. Conversely, if the specimen arrives without its head and fins, the TL-IDL relationship might be more suitable. Therefore, these equations facilitate the reconstruction of TL for mutilated specimens, thereby improving the accuracy of studies that rely on such biological data.
Precision and bias
The counts conducted by both readers on the vertebrae of C. falciformis resulted in a coefficient of variation of 3.32 and an average percent error of 2.35. These values fall within the acceptable error range proposed by Campana (2001) (7.6 and 5.5, respectively), indicating a reliable level of precision in our age estimations. The obtained indices were lower than those reported by Grant et al. (2018) (CV = 10.8, APE = 7.6) and Santander-Neto et al. (2021) (APE = 5.61), who also used vertebral centra sectioned with a thickness of 0.3–0.4 mm. These differences may be associated with the difficulty of estimating ages in larger sharks. The samples presented in this study consisted primarily of small and young individuals compared to the study by Grant et al. (2018) who provided much higher age estimates and demonstrated systematic bias (Bowker, P < 0.05). This likely reflects the impact of larger individuals in this species, as they exhibit more band pairs deposited in their vertebral centra, which can lead to increased uncertainty in age determination (Goldman et al. 2012; Harry 2018).
Age verification
Various methodological procedures exist for verifying and validating age in elasmobranchs, including captive growth studies, oxytetracycline (OTC) mark–recapture analysis, and carbon bomb techniques (Cailliet and Goldman 2004). In this study, we opted for MIR method, which has been employed to determine the periodicity of band pairs in sharks’ vertebrae (Goldman 2005), owing to its minimal sampling needs and cost-effectiveness (Campana 2001).
The lowest MIR median was observed during July, subsequently increasing until January. This pattern aligns with findings by Hall et al. (2012) and Santander-Neto et al. (2021) for C. falciformis, who reported that band pair deposition occurred in June and July, respectively. In contrast, Joung et al. (2008) and Sánchez-de Ita et al. (2011) reported low values of this index during the early months of the year. Such variations in trends are often associated with seasonal cycles, where opaque bands are deposited during warmer periods, while translucent bands are deposited in winter (Cailliet et al. 2006).
The deposition of band pairs appeared to correlate with temperature variables, with translucent bands likely forming in July, coinciding with the dry season in the Ecuadorian Pacific, during which sea surface temperatures are relatively low (Chinacalle-Martínez et al. 2021). However, the method proposed by Okamura and Semba (2009) demonstrated that CEA in this study did not exhibit any annual or biennial patterns, likely due to the low number of samples collected during certain months or the difficulty in measuring and determining edge types in semi-adult and adult individuals. Due to the inconclusiveness of our results, we considered assumptions from other studies indicating that band pair deposition in C. falciformis likely occurs annually.
It has been reported that species within the Lamnidae and Sphyrnidae families may exhibit biennial deposition of growth band pairs during certain life cycle stages (e.g. Isurus oxyrinchus, David Wells et al. 2013; Sphyrna lewini, Anislado-Tolentino and Robinson-Mendoza 2001). In the case of C. falciformis shark, band pair deposition has been described solely using MIR method, with researchers assuming annual periodicity in its band pairs of C. falciformis (Branstetter 1987; Bonfil et al. 1993; Oshitani et al. 2003; Joung et al. 2008; Sánchez-de Ita et al. 2011).
However, as an indirect method for age verification in elasmobranchs, it is challenging to determine whether the deposition of band pairs remains annual throughout the entire life cycle. An unvalidated age interpretation can pose significant risks to the population dynamics of a species (Ardizzone et al. 2006). Given that age in C. falciformis has not been validated using more robust and direct methods (e.g. oxytetracycline injection, bomb radiocarbon), it is recommended that future studies validate both early and advanced ages of this species to ascertain whether bands pairs maintain a consistent annual deposition pattern across different life stages.
Age and growth parameters
The inferences drawn from the growth multimodels in this study differed between the two approaches considered (frequentist and Bayesian). In the frequentist approach, the model that received the most support based on AIC was the Logistic model across all three scenarios (combined sexes, females, and males) (Table 4). However, it resulted in under-estimated growth estimates for certain parameters, such as the L∞ of this species, which was notably shorter than reported maximum lengths in the Pacific (>150 cm TL; Oshitani et al. 2003; Martínez-Ortíz et al. 2011; Sánchez-de Ita et al. 2011; Grant et al. 2018; Briones-Mendoza et al. 2022) and deviated from findings reported in other age-growth studies from different regions (Table 6). For example, Grant et al. (2018) found a greater L∞ (268 cm TL, frequentist Logistic model) in the western-central Pacific compared to this study (230.52 cm TL, frequentist Logistic model). The estimated values were likely influenced by sampling bias towards larger individuals (>238 cm TL), compared to other reports that included larger sizes in their samples (Table 6). Indeed, it has been previously shown that growth models are very sensitive to the absence of young and adult individuals, as these data points are crucial for defining the growth curve’s extremes (Haddon 2011; Smart and Grammer 2021).
| Region | n | Max. observed age (years) | Max. observed TL (cm) | Approach | Model | Sex | Growth parameters | Reference | ||||
|---|---|---|---|---|---|---|---|---|---|---|---|---|
| L∞ (cm TL) | k/g (year−1) | t0 (year) | L0 (cm TL) | |||||||||
| Atlantic Ocean | ||||||||||||
| Campeche Bank | 83 | 22 | 314 | Frequentist | VBGF | C | 311 | 0.10 | −2.72 | Bonfil et al. (1993) | ||
| Gulf of Mexico | 100 | 14 | 267 | Frequentist | VBGF | C | 291 | 0.15 | −2.2 | Branstetter (1987) | ||
| South-western Atlantic | 106 | 21+ | 272 | Frequentist | VBGF | C | 283.05 | 0.10 | −3.47 | Santander-Neto et al. (2021) | ||
| Pacific Ocean | ||||||||||||
| Central Pacific | 298 | 13 | 292 | Frequentist | VBGF | C | 289.65 | 0.15 | −1.76 | Oshitani et al. (2003) | ||
| North-east Taiwan | 250 | 14 | 256 | Frequentist | VBGF | C | 332 | 0.08 | −2.76 | Joung et al. (2008) | ||
| East Pacific | 145 | 16 | 260 | Frequentist | VBGF | C | 240 | 0.14 | −2.98 | -de Ita et al. (2011) | ||
| Ecuadorian Pacific | 499 | 19 | 249 | Frequentist | VBGF | C | 335 | 0.06 | −2.95 | Gilces-Anchundia (2013) | ||
| Central-west Pacific | 526 | 28 | 271 | Frequentist | LOG | C | 268.3 | 0.14 | 82.7 | Grant et al. (2018) | ||
| Bayesian | LOG | C | 269.1 | 0.14 | 82.32 | Smart and Grammer (2021) A | ||||||
| Ecuadorian Pacific | 290 | 19 | 238 | Bayesian | VBGF | C | 271.48 | 0.09 | 72.19 | Present study | ||
| Indian Ocean | ||||||||||||
| Eastern Indonesia | 168 | 20 | 262.3 | Frequentist | VBGF | C | 299.4 | 0.07 | Hall et al. (2012) | |||
n, number of vertebral samples considered; TL, total length; VBGF, von Bertalanffy growth model; LOG, Logistic model; L∞, asymptotic length; k, growth coefficient of the von Bertalanffy model; g, growth coefficient of the Logistic model; t0, theoretical age at zero length; L0, length at birth; C, combined sexes.
In this context, the von Bertalanffy Bayesian model, which utilises prior information on length-at-birth and maximum observed length of the species for size-at-age analysis (Smart and Grammer 2021), provided more accurate estimates of growth parameters. Therefore, these estimates should be used in future population models. In the present study, the high overlap of growth parameters between sexes indicated no significant differences in growth between males and females, consistent with previous studies on age and growth in C. falciformis (Table 6). Grant et al. (2018) and Santander-Neto et al. (2021) suggest that this pattern may reflect similar growth rates between sexes for this species.
The length-at-birth obtained using the von Bertalanffy Bayesian model (L0 = 71 cm TL) falls within the range reported for this species at birth across various geographical areas: north-east Taiwan (63.5– 75.5 cm TL; Joung et al. 2008), Campeche Bank (76 cm TL; Bonfil et al. 1993), north-western Gulf of Mexico (72 cm TL; Branstetter 1987), south-western Atlantic (76 cm TL; Santander-Neto et al. 2021), central-west Pacific (65–71 cm TL; Grant et al. 2018), and eastern Indonesia (57.1–99.2 cm TL; Hall et al. 2012). This is consistent with the length-at-birth suggested by Oshitani et al. (2003) for the Pacific Ocean regions (65–81 cm TL), indicating that our results reflect realistic estimates aligned with the biology of C. falciformis.
The asymptotic length of the von Bertalanffy Bayesian model (L∞ = 271.14 cm TL) was similar to that estimated by Grant et al. (2018) (L∞ = 268.3 cm TL) and higher than that reported by Sánchez-de Ita et al. (2011) (L∞ = 240 cm TL) in the Pacific Ocean. However, it differed from reports in the Atlantic Ocean, where C. falciformis appear to reach a greater L∞ and grow more rapidly (Table 6). These variations are presumed to be due to latitudinal differences, as has been observed in some elasmobranch species (e.g. Sphyrna tiburo and Dipturus chilensis), where variations in life history parameters were evident at different latitudes (Lombardi-Carlson et al. 2003; Licandeo and Cerna 2007). Cope (2006) indicated that certain shark populations may exhibit greater growth at higher latitudes, as well as larger size, longer lifespan, and slightly delayed sexual maturity compared to their counterparts at mid and adjacent latitudes. However, other factors such as local fishing pressure, fishing gear and methods, methodological differences, diet, and environmental and genetic influences may also contribute to variations in life history traits (Baje et al. 2019; Vinyard et al. 2019; Estupiñán-Montaño et al. 2021). Therefore, further investigation is necessary to understand the actual mechanisms driving C. falciformis to display divergent life history traits across different latitudinal scales.
In Ecuadorian waters, the estimated maximum length (L∞ = 335 cm TL, Gilces-Anchundia 2013) and the observed maximum lengths (TL = 310 cm, Estupiñán-Montaño et al. 2018; TL = 309 cm, Martínez-Ortíz et al. 2007) of C. falciformis were substantially higher than the estimates obtained in this study. However, the biological sampling records from these studies date back over 10 years, and it is possible that large, mature specimens may have experienced historical mortality due to overfishing, owing to the selectivity of fishing gear (Thorson and Simpfendorfer 2009). This could largely explain this phenomenon and why our study evidenced a high frequency of younger ages compared to other age and growth studies reported for this species (Table 6). While gear selectivity cannot be ruled out as a contributing factor, biased sampling may also have influenced the results. However, this study did not allow for detailed documentation of the fishing gear and methods used. Therefore, future research should prioritise collecting this information.
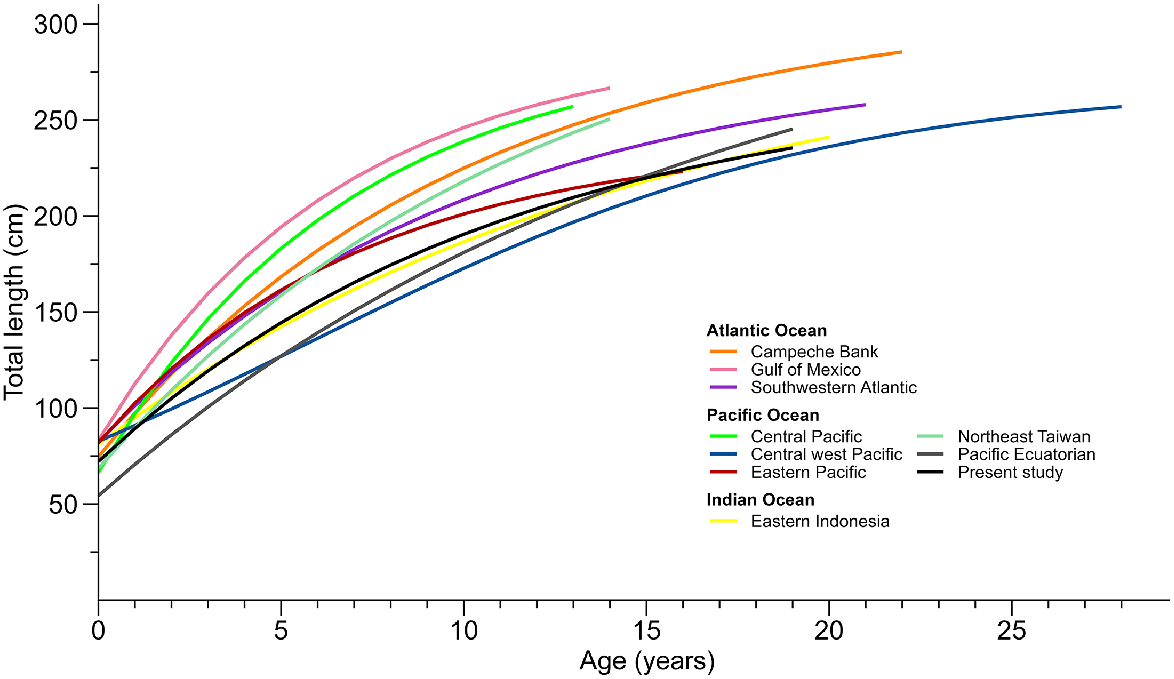
The estimated growth coefficient (k = 0.09 year−1) using the von Bertalanffy Bayesian model was lower than that observed in the Atlantic Ocean (Branstetter 1987; Bonfil et al. 1993; Santander-Neto et al. 2021) but similar to that reported by Hall et al. (2012) in the Indian Ocean (Table 6). Although the k and g parameters cannot be compared across models as they do not represent an empirical growth rate (Smart et al. 2015), the growth curve for the Central Western Pacific (Grant et al. 2018) using the Logistic function appears similar to that obtained in Ecuadorian waters in this study, in contrast to the curves observed in other previous studies of the Pacific Ocean, which differed significantly (Fig. 8). Genetic studies of C. falciformis suggest population genetic differentiation in the Pacific Ocean (Galván-Tirado et al. 2013; Clarke et al. 2015), which could explain these divergences. Another detail that may also explain these variations among studies is the estimation of growth parameters using frequentist methods when the sample is not sufficiently representative and does not cover the entire size range for the species (Table 6). This is one of the significant issues that leads to under-estimations or over-estimations of the asymptotic length, as observed in this study, where the under-estimation of L∞ is likely due to the absence of larger individuals. Differences affecting L∞ also influence k, as there is a negative correlation between the parameters L∞ and k/g (Pardo et al. 2013).
Comparison of the overall growth curves of Carcharhinus falciformis from various studies: Branstetter (1987) in the Gulf of Mexico; Bonfil et al. (1993) in the Campeche Bank, Oshitani et al. (2003) in the central Pacific; Joung et al. (2008) in north-east Taiwan; Sánchez-de Ita et al. (2011) in the east Pacific; Hall et al. (2012) in eastern Indonesia; Gilces-Anchundia (2013) in Pacific Ecuadorian waters, Grant et al. (2018) in the central-west Pacific; and Santander-Neto et al. (2021) in the south-western Atlantic.
These discrepancies could also be due to the different methodologies used in the various studies. For example, Grant et al. (2020), in an intraspecific demographic analysis of C. falciformis, suggest that many of the differences in C. falciformis growth parameters could be due to sampling design and methodological differences. Other factors such as diet and environmental conditions have also been argued (Estupiñán-Montaño et al. 2018). Another reason may be that most age and growth studies on this species, except for Grant et al. (2018) and Santander-Neto et al. (2021), have emphasised the exclusive use of the von Bertalanffy growth model without considering multimodel evidence. It has been shown that not considering multimodel inference can lead to potentially inaccurate estimates, even when VBGM is recognised to provide the best fit (Katsanevakis 2006). However, the notion that a model perfectly aligns with the life history characteristics of a species is not entirely true; Smart et al. (2016) refuted this theory and demonstrated that the selection of a specific growth model is not related to the taxon or reproductive method exhibited. Therefore, it is likely that the variations in growth parameters for this species across different regions are due to both real and methodological differences, as has previously emerged in other shark species (Harry et al. 2011, 2013). Therefore, the discrepancies in these results remind us of the complexity and uncertainty that surrounds studies of age and growth. Thus, it is necessary that future population and demographic studies that use the parameters presented here include the uncertainty that exists around the age and growth parameters.
Implications
C. falciformis is a dominant species in landings across various countries (Indonesia, Sembiring et al. 2015; Mexico, Galván-Magaña et al. 1989). Its high frequency in both incidental and targeted catches has resulted in a decline in its global population status over recent decades (Anderson and Jauharee 2009), raising concerns about its current conservation status. In the Ecuadorian Pacific, this species ranks third among the total sharks landed in artisanal incidental catches (Martínez-Ortíz et al. 2007), consequently leading to a relative abundance decrease of 4.8% (Briones-Mendoza et al. 2022). Like other elasmobranchs, C. falciformis exhibits life history traits (slow growth, late sexual maturity, extended gestation period) that make it vulnerable to fishing pressure. Currently, in Ecuadorian waters and within the Inter-American Tropical Tuna Commission (IATTC) convection area, there are agreements regulating the incidental capture of C. falciformis (ACUERDO NRO. MPCEIP-SRP-2022-0002-A and RESOLUCION C-23-08). However, due to the limited consideration of research on this species, essential information regarding the life history of this shark remains unknown, which could help improve guidelines for better fishery management in this area.
In this context, the growth parameters estimated in this study have important implications for the management and conservation of C. falciformis in Ecuador. These parameters can be used in more complex models to propose various management scenarios. For instance, they can be incorporated into subsequent demographic analyses, which can inform recommendations for optimal catch size limits, both minimum and maximum (Grant et al. 2020). Additionally, this approach allows for the estimation of the intrinsic population growth rate, a key parameter in some surplus production models, which are used to propose catch quotas (Bonfil 2005). Therefore, the parameters estimated here will serve as baseline information for future population studies within the region, ultimately contributing to the establishment of management plans for the species in Ecuador.
Conclusions
In this study, we estimated the age and growth parameters of C. falciformis in the Ecuadorian Pacific. Although the results from MIR and CEA were inconclusive, these findings contribute to establishing a baseline understanding of the species’ life history, providing a foundation for future research. C. falciformis exhibits slow growth and attains a large size, making it particularly vulnerable to overfishing. Furthermore, variations in growth curves were observed when comparing C. falciformis populations from different geographic regions, suggesting that regional management strategies may be necessary for effective conservation. Therefore, the parameters estimated in this study can be applied in future population models and demographic analyses, which will ultimately aid in improving the management and conservation of C. falciformis in Ecuador.
Acknowledgements
The authors thank the fishermen of Playita Mia for allowing them to collect the samples. They also thank the life history group in Manta for their help in the field trips.
References
Alejo-Plata MC, Ahumada-Sempoal MÁ, Gómez-Márquez JL, González-Acosta A (2016) Population structure and reproductive characteristics of the silky shark Carcharhinus falciformis (Müller & Henle, 1839) (Carcharhiniformes: Carcharhinidae) off the coast of Oaxaca, Mexico. Latin American Journal of Aquatic Research 44(3), 513-524.
| Crossref | Google Scholar |
Anislado-Tolentino V, Robinson-Mendoza C (2001) Age and growth for the scalloped hammerhead shark, Sphyrna lewini (griffith and smith, 1834) along the central pacific coast of mexico. Ciencias Marinas 27(4), 501-520.
| Crossref | Google Scholar |
Ardizzone D, Cailliet GM, Natanson LJ, Andrews AH, Kerr LA, Brown TA (2006) Application of bomb radiocarbon chronologies to shortfin mako (Isurus oxyrinchus) age validation. Environmental Biology of Fishes 77(3), 355-366.
| Crossref | Google Scholar |
Au DW, Smith SE (1997) A demographic method with population density compensation for estimating productivity and yield per recruit of the leopard shark (Triakis semifasciata). Canadian Journal of Fisheries and Aquatic Sciences 54(2), 415-420.
| Crossref | Google Scholar |
Baje L, Smart JJ, Grant MI, Chin A, White WT, Simpfendorfer CA (2019) Age, growth and maturity of the Australian blackspot shark (Carcharhinus coatesi) in the Gulf of Papua. Pacific Conservation Biology 25(4), 403-412.
| Crossref | Google Scholar |
Beamish RJ, Fournier DA (1981) A method for comparing the precision of a set of age determinations. Canadian Journal of Fisheries and Aquatic Sciences 38(8), 982-983.
| Crossref | Google Scholar |
Bonfil R, Mena R, Anda D (1993) Biological Parameters of Commercially Exploited Silky Sharks, Carcharhinus falciformis, from the Campeche Bank, Mexico. NOAA Technical Report NMFS 115, 73-86.
| Google Scholar |
Branstetter S (1987) Age, growth and reproductive biology of the silky shark, Carcharhinus falciformis, and the scalloped hammerhead, Sphyrna lewini, from the northwestern Gulf of Mexico. Environmental Biology of Fishes 19, 161-173.
| Crossref | Google Scholar |
Briones-Mendoza J, Mejía D, Carrasco-Puig P (2022) Catch composition, seasonality, and biological aspects of sharks caught in the Ecuadorian Pacific. Diversity 14(8), 599.
| Crossref | Google Scholar |
Burnham KP, Anderson DR (2002) ‘Model selection and multimodel inference: a practical information-theoretic approach.’ 2nd edn (Springer-Verlag: New York) 10.1007/b97636
Cailliet GM, Musick JA, Simpfendorfer CA, Stevens JD (2005) Ecology and life history characteristics of chondrichthyan fish. In ‘Sharks, rays and chimaeras: the status of the chondrichthyan fishes’ (Eds SL Fowler, RD Cavanagh, M Camhi, GH Burgess, SV Fordham, CA Simpfendorfer, JA Musick) pp. 12–18. (IUCN: Gland, Switzerland)
Cailliet GM, Smith WD, Mollet HF, Goldman KJ (2006) Age and growth studies of chondrichthyan fishes: the need for consistency in terminology, verification, validation, and growth function fitting. Environmental Biology of Fishes 77, 211-228.
| Crossref | Google Scholar |
Campana SE (2001) Accuracy, precision and quality control in age determination, including a review of the use and abuse of age validation methods. Journal of Fish Biology 59(2), 197-242.
| Crossref | Google Scholar |
Campana SE, Annand MC, McMillan JI (1995) Graphical and statistical methods for determining the consistency of age determinations. Transactions of the American fisheries Society 124, 131-138.
| Crossref | Google Scholar |
Carlson JK, Baremore IE (2003) Changes in biological parameters of Atlantic sharpnose shark Rhizoprionodon terraenovae in the Gulf of Mexico: evidence for density-dependent growth and maturity? Marine and Freshwater Research 54(3), 227-234.
| Crossref | Google Scholar |
Carr LA, Stier AC, Fietz K, Montero I, Gallagher AJ, Bruno JF (2013) Illegal shark fishing in the Galápagos Marine Reserve. Marine Policy 39, 317-321.
| Crossref | Google Scholar |
Cerutti-Pereyra F, Moity N, Dureuil M, Ramírez-González J, Reyes H, Budd K, Jarrín JM, Salinas-de-León P (2020) Artisanal longline fishing the Galapagos Islands – effects on vulnerable megafauna in a UNESCO World Heritage site. Ocean & Coastal Management 183, 104995.
| Crossref | Google Scholar |
Chang WYB (1982) A statistical method for evaluating the reproducibility of age determination. Canadian Journal of Fisheries and Aquatic Sciences 39(8), 1208-1210.
| Crossref | Google Scholar |
Chinacalle-Martínez N, García-Rada E, López-Macías J, Pinoargote S, Loor G, Zevallos-Rosado J, Cruz P, Pablo D, Andrade B, Robalino-Mejía C, Añazco S, Guerrero J, Intriago A, Veelenturf C, Peñaherrera-Palma C (2021) Oceanic primary production trend patterns along coast of Ecuador. Neotropical Biodiversity 7(1), 379-391.
| Crossref | Google Scholar |
CITES (2022) Appendices I, II and III: Valid from 22 june 2022. Available at https://cites.org/eng/app/appendices.php
Clarke CR, Karl SA, Horn RL, Bernard AM, Lea JS, Hazin FH, Prodöhl PA, Shivji MS (2015) Global mitochondrial DNA phylogeography and population structure of the silky shark, Carcharhinus falciformis. Marine Biology 162(5), 945-955.
| Crossref | Google Scholar |
Coello D, Herrera M (2018) Desembarque de tiburones en las pesquerías artesanales del Ecuador durante el 2012. Revista Científica Ciencias Naturales y Ambientales 12(1), 1-8.
| Google Scholar |
Cope JM (2006) Exploring intraspecific life history patterns in sharks. Fishery Bulletin 104(2), 311-320.
| Google Scholar |
Cortés E (2000) Life history patterns and correlations in sharks. Reviews in Fisheries Science 8(4), 299-344.
| Crossref | Google Scholar |
David Wells RJ, Smith SE, Kohin S, Freund E, Spear N, Ramon DA (2013) Age validation of juvenile shortfin mako (Isurus oxyrinchus) tagged and marked with oxytetracycline off southern California. Fishery Bulletin 111(2), 147-160.
| Crossref | Google Scholar |
de Santana HS, Dei Tos C, Minte-Vera CV (2020) A review on the age and growth studies of freshwater fish in South America. Fisheries Research 222, 105410.
| Crossref | Google Scholar |
De Wysiecki AM, Braccini JM (2017) Shark length–length relationships: Studying morphology allows the detection of bias in routine fisheries sampling. Regional Studies in Marine Science 16, 290-293.
| Crossref | Google Scholar |
Driggers W, Carlson J, Cullum B, Dean J, Oakley D (2004) Age and growth of the blacknose shark, Carcharhinus acronotus, in the western North Atlantic Ocean with comments on regional variation in growth rates. Environmental Biology of Fishes 71, 171-178.
| Crossref | Google Scholar |
D’Alberto BM, Chin A, Smart JJ, Baje L, White WT, Simpfendorfer CA (2017) Age, growth and maturity of oceanic whitetip shark (Carcharhinus longimanus) from Papua New Guinea. Marine and Freshwater Research 68(6), 1118-1129.
| Crossref | Google Scholar |
Emmons SM, D’Alberto BM, Smart JJ, Simpfendorfer CA (2021) Age and growth of tiger shark (Galeocerdo cuvier) from Western Australia. Marine and Freshwater Research 72, 950-963.
| Crossref | Google Scholar |
Estupiñán-Montaño C, Pacheco-Triviño F, Cedeño-Figueroa LG, Galván-Magaña F, Estupiñán-Ortiz JF (2018) Diet of three shark species in the Ecuadorian Pacific, Carcharhinus falciformis, Carcharhinus limbatus and Nasolamia velox. Journal of the Marine Biological Association of the United Kingdom 98(4), 927-935.
| Crossref | Google Scholar |
Estupiñán-Montaño C, Carrera-Fernández M, Galván-Magaña F (2021) Reproductive biology of the scalloped hammerhead (Sphyrna lewini) in the central-eastern Pacific Ocean. Journal of the Marine Biological Association of the United Kingdom 101(2), 465-470.
| Crossref | Google Scholar |
Francis RICC (2016) Growth in age-structured stock assessment models. Fisheries Research 180, 77-86.
| Crossref | Google Scholar |
Gabry J, Mahr T (2024) bayesplot: Plotting for Bayesian Models. R package version 1.11.0. Available at https://mc-stan.org/bayesplot/
Galván-Magaña F, Nienhuis HJ, Klimley AP (1989) Seasonal abundance and feeding habits of sharks of the lower Gulf of California, Mexico. California Fish and Game 75(2), 74-84.
| Google Scholar |
Galván-Magaña F, Polo-Silva C, Hernández-Aguilar SB, Sandoval-Londoño A, Ochoa-Díaz MR, Aguilar-Castro N, Castañeda-Suárez D, Chavez-Costa AC, Baigorrí-Santacruz Á, Torres-Rojas YE, Abitia-Cárdenas LA (2013) Shark predation on cephalopods in the Mexican and Ecuadorian Pacific Ocean. Deep Sea Research Part II: Topical Studies in Oceanography 95, 52-62.
| Crossref | Google Scholar |
Galván-Tirado C, Díaz-Jaimes P, García-de León FJ, Galván-Magaña F, Uribe-Alcocer M (2013) Historical demography and genetic differentiation inferred from the mitochondrial DNA of the silky shark (Carcharhinus falciformis) in the Pacific Ocean. Fisheries Research 147, 36-46.
| Crossref | Google Scholar |
Goldman KJ, Cailliet GM, Natanson LJ, Andrews AH (2012) Assessing the age and growth of chondrichthyan fishes. In ‘Biology of sharks and their relatives’. 2nd edn. (Eds JC Carrier, JA Musick, MR Heithaus) pp. 423–451. 10.1201/b11867-18
Gompertz B (1825) On the nature of the function expressive of the law of human mortality, and on a new mode of determining the value of life contingencies. In a letter to Francis Baily, Esq. FRS &c. By Benjamin Gompertz, Esq. F. R. S. Philosophical transactions of the Royal Society of London 115(1825), 513-583.
| Crossref | Google Scholar |
Grant MI, Smart JJ, White WT, Chin A, Baje L, Simpfendorfer CA (2018) Life history characteristics of the silky shark Carcharhinus falciformis from the central west Pacific. Marine and Freshwater Research 69(4), 562-573.
| Crossref | Google Scholar |
Grant MI, Smart JJ, Rigby CL, White WT, Chin A, Baje L, Simpfendorfer CA (2020) Intraspecific demography of the silky shark (Carcharhinus falciformis): implications for fisheries management. ICES Journal of Marine Science 77(1), 241-255.
| Crossref | Google Scholar |
Hall NG, Bartron C, White WT, Dharmadi, Potter IC (2012) Biology of the silky shark Carcharhinus falciformis (Carcharhinidae) in the eastern Indian Ocean, including an approach to estimating age when timing of parturition is not well defined. Journal of Fish Biology 80(5), 1320-1341.
| Crossref | Google Scholar |
Harry AV (2018) Evidence for systemic age underestimation in shark and ray ageing studies. Fish and Fisheries 19(2), 185-200.
| Crossref | Google Scholar |
Harry AV, Macbeth WG, Gutteridge AN, Simpfendorfer CA (2011) The life histories of endangered hammerhead sharks (Carcharhiniformes, Sphyrnidae) from the east coast of Australia. Journal of Fish Biology 78(7), 2026-2051.
| Crossref | Google Scholar |
Harry AV, Tobin AJ, Simpfendorfer CA (2013) Age, growth and reproductive biology of the spot-tail shark, Carcharhinus sorrah, and the Australian blacktip shark, C. tilstoni, from the Great Barrier Reef World Heritage Area, north-eastern Australia. Marine and Freshwater Research 64(4), 277-293.
| Crossref | Google Scholar |
Joung SJ, Chen CT, Lee HH, Liu KM (2008) Age, growth, and reproduction of silky sharks, Carcharhinus falciformis, in northeastern Taiwan waters. Fisheries Research 90(1–3), 78-85.
| Crossref | Google Scholar |
Katsanevakis S (2006) Modelling fish growth: model selection, multi-model inference and model selection uncertainty. Fisheries Research 81(2–3), 229-235.
| Crossref | Google Scholar |
Katsanevakis S, Maravelias CD (2008) Modelling fish growth: multi-model inference as a better alternative to a priori using von Bertalanffy equation. Fish and Fisheries 9(2), 178-187.
| Crossref | Google Scholar |
Kimura DK (1980) Likelihood methods for the von Bertalanffy growth curve. Fishery Bulletin 77, 765-778.
| Google Scholar |
Licandeo R, Cerna FT (2007) Geographic variation in life-history traits of the endemic kite skate Dipturus chilensis (Batoidea: Rajidae), along its distribution in the fjords and channels of southern Chile. Journal of Fish Biology 71(2), 421-440.
| Crossref | Google Scholar |
Liu KM, Chang YT, Ni IH, Jin CB (2006) Spawning per recruit analysis of the pelagic thresher shark, Alopias pelagicus, in the eastern Taiwan waters. Fisheries Research 82(1–3), 56-64.
| Crossref | Google Scholar |
Lombardi-Carlson LA, Cortés E, Parsons GR, Manire CA (2003) Latitudinal variation in life-history traits of bonnethead sharks, Sphyrna tiburo, (Carcharhiniformes: Sphyrnidae) from the eastern Gulf of Mexico. Marine and Freshwater Research 54(7), 875-883.
| Crossref | Google Scholar |
Manzanillas Castro AB, Acosta-López C (2022) Molecular identification of shark species commercialised in the ‘17 de Diciembre’market, Santo Domingo de los Tsáchilas-Ecuador. Biodiversity 23(3–4), 110-117.
| Crossref | Google Scholar |
Martínez-Ortíz J, Galván-Magaña F, Carrera-Fernández M, Mendoza-Intriago D, Estupiñán-Montaño C, Cedeño-Figueroa L (2007) Abundancia estacional de tiburones desembarcados en Manta-Ecuador. In ‘Tiburones en el Ecuador: Casos de estudio’. (Eds J Martínez-Ortíz, F Galván-Magaña) pp. 9–27. (EPESPO – PMRC: Manta, Ecuador)
Martínez-Ortíz J, García-Domínguez M, Cevallos-García A, Ávila-Zambrano E, Daza-Bermeo C, Zambrano-Zambrano R, Moreira-Merchán M (2011) Estudio de caso: aspectos biológicos pesqueros del tiburón mico o tollo Carcharhinus falciformis (Muller y Henle, 1839) en el Ecuador. PAT-EC Grupo Tiburón, Subsecretaría de Recursos Pesqueros (SRP)-Ministerio de Agricultura, Ganadería, Acuacultura y Pesca (MAGAP), Manta-Manabí.
Maurice L, Croizier GL, Morales G, Carpintero N, Guayasamin JM, Sonke J, Páez-Rosas D, Point D, Bustos W, Ochoa-Herrera V (2021) Concentrations and stable isotopes of mercury in sharks of the Galapagos Marine Reserve: Human health concerns and feeding patterns. Ecotoxicology and Environmental Safety 215, 112122.
| Crossref | Google Scholar |
Mejía D, Briones-Mendoza J (2024) Estimating the Total and Precaudal Lengths of the Main Shark Species from Interdorsal Measurements in the Eastern-Central Pacific Ocean. Thalassas: An International Journal of Marine Sciences 40, 885-889.
| Crossref | Google Scholar |
Mejía D, Briones-Mendoza J, Mendoza-Nieto K, Toala-Franco D (2023) A bibliometric analysis of elasmobranch research in Ecuador. Regional Studies in Marine Science 62, 102980.
| Crossref | Google Scholar |
Natanson L, Casey JG, Kohler NE (1995) Age and growth estimates for the dusky shark, Carcharhinus obscurus, in the western North Atlantic Ocean. Fishery Bulletin 93, 116-126.
| Google Scholar |
Okamura H, Semba Y (2009) A novel statistical method for validating the periodicity of vertebral growth band formation in elasmobranch fishes. Canadian Journal of Fisheries and Aquatic Sciences 66(5), 771-780.
| Crossref | Google Scholar |
Oshitani S, Nakano H, Tanaka SHO (2003) Age and growth of the silky shark Carcharhinus falciformis from the Pacific Ocean. Fisheries Science 69(3), 456-464.
| Crossref | Google Scholar |
Páez-Rosas D, Insuasti-Zarate P, Riofrío-Lazo M, Galván-Magaña F (2018) Feeding behavior and trophic interaction of three shark species in the Galapagos Marine Reserve. PeerJ 6, e4818.
| Crossref | Google Scholar |
Pardo SA, Cooper AB, Dulvy NK (2013) Avoiding fishy growth curves. Methods in Ecology and Evolution 4(4), 353-360.
| Crossref | Google Scholar |
Pastore M (2018) Overlapping: a R package for estimating overlapping in empirical distributions. Journal of Open Source Software 3(32), 1023.
| Crossref | Google Scholar |
R Core Team (2020) ‘R: A language and environment for statistical computing’. (R Foundation for Statistical Computing: Vienna, Austria). Available at https://www.R-project.org/
Rigby CL, Sherman CS, Chin A, Simpfendorfer C (2021) Carcharhinus falciformis (amended version of 2017 assessment). The IUCN Red List of Threatened Species 2021: e.T39370A205782570. Available at https://dx.doi.org/10.2305/IUCN.UK.2021-3.RLTS.T39370A205782570.en
Sánchez-de Ita J, Quiñónez-Velázquez C, Galván-Magaña F, Bocanegra-Castillo N, Félix-Uraga R (2011) Age and growth of the silky shark Carcharhinus falciformis from the west coast of Baja California Sur, Mexico. Journal of Applied Ichthyology 27(1), 20-24.
| Crossref | Google Scholar |
Santander-Neto J, Barreto R, Santana FM, Lessa RPT (2021) Age, growth and demography of the silky shark Carcharhinus falciformis from the southwestern Atlantic. Endangered Species Research 45, 237-249.
| Crossref | Google Scholar |
Schaefer KM, Fuller DW, Aires-da-Silva A, Carvajal JM, Martínez-Ortiz J, Hutchinson MR (2019) Postrelease survival of silky sharks (Carcharhinus falciformis) following capture by longline fishing vessels in the equatorial eastern Pacific Ocean. Bulletin of Marine Science 95(3), 355-369.
| Crossref | Google Scholar |
Schneider CA, Rasband WS, Eliceiri KW (2012) NIH Image to ImageJ: 25 years of image analysis. Nature Methods 9(7), 671-675.
| Crossref | Google Scholar |
Sembiring A, Pertiwi NPD, Mahardini A, Wulandari R, Kurniasih EM, Kuncoro AW, Cahyani NKD, Anggoro AW, Ulfa M, Madduppa H, Carpenter KE, Barber PH, Mahardika GN (2015) DNA barcoding reveals targeted fisheries for endangered sharks in Indonesia. Fisheries Research 164, 130-134.
| Crossref | Google Scholar |
Smart JJ (2019) Aquaticlifehistory: Fisheries life history analysis using contemporary methods. Available at https://github.com/jonathansmart/AquaticLifeHistory
Smart JJ (2020) Bayesgrowth: Estimate fish growth using MCMC analysis. Available at https://github.com/jonathansmart/BayesGrowth
Smart JJ, Grammer GL (2021) Modernising fish and shark growth curves with Bayesian length-at-age models. PLoS ONE 16(2), e0246734.
| Crossref | Google Scholar |
Smart JJ, Chin A, Tobin AJ, Simpfendorfer CA, White WT (2015) Age and growth of the common blacktip shark Carcharhinus limbatus from Indonesia, incorporating an improved approach to comparing regional population growth rates. African Journal of Marine Science 37(2), 177-188.
| Crossref | Google Scholar |
Smart JJ, Chin A, Tobin AJ, Simpfendorfer CA (2016) Multimodel approaches in shark and ray growth studies: strengths, weaknesses and the future. Fish and Fisheries 17(4), 955-971.
| Crossref | Google Scholar |
Stevens JD, Bonfil R, Dulvy NK, Walker PA (2000) The effects of fishing on sharks, rays, and chimaeras (chondrichthyans), and the implications for marine ecosystems. ICES Journal of Marine Science 57(3), 476-494.
| Crossref | Google Scholar |
Thorson JT, Simpfendorfer CA (2009) Gear selectivity and sample size effects on growth curve selection in shark age and growth studies. Fisheries Research 98(1–3), 75-84.
| Crossref | Google Scholar |
Vinyard EA, Frazier BS, Drymon JM, Gelsleichter JJ, Bubley WJ (2019) Age, growth, and maturation of the Finetooth Shark, Carcharhinus isodon, in the Western North Atlantic Ocean. Environmental Biology of Fishes 102, 1499-1517.
| Crossref | Google Scholar |
von Bertalanffy L (1938) A quantitative theory of organic growth (inquiries on growth laws. II). Human Biology 10(2), 181-213.
| Google Scholar |