

Response of a koala (Phascolarctos cinereus) source population following a large-scale progressive translocation harvest
John Callaghan A B C * , Stephen Phillips B and Ross Goldingay A
A
B
C
Abstract
Translocation is an important tool for species conservation. However, comparatively few translocation programs have investigated the impacts on source populations. The distribution and size of a koala (Phascolarctos cinereus) population occupying a rapidly urbanising landscape in south-east Queensland, Australia were investigated before and after progressive removal of koalas.
This study investigated how the population responded following translocation of 166 koalas over a 5-year period concomitant with loss of habitat.
Baseline surveys conducted in 2006 were compared to post-translocation surveys of the same area in 2017. Survey sites were located on a grid positioned over the study area. Sites were sampled using scat surveys to measure koala activity and fixed-radius searches for koalas to estimate population density.
The koala population size estimated in 2017 (440 ± 66 s.e.) was not markedly different to that for 2006 (510 ± 67 s.e.), with koalas occupying remaining habitat at similar density. The analysis did not identify any significant change in occupancy between survey periods. Estimates of the probability of detection were high in both periods with the preferred tree species group having values >0.8. Naïve occupancy estimates from raw field data were consistent with that predicted by modelling.
The results suggest that relatively large source populations of koalas can cope with a progressive translocation harvest.
The population coped better than anticipated. Regardless, monitoring is important as the new town centre is completed. Further management actions may be necessary to support and sustain the remaining population.
Keywords: conservation translocation, correlated replicate surveys, habitat loss, habitat occupancy, mitigation translocation, monitoring, population response, source population.
Introduction
Responses to threatened species conservation issues increasingly incorporate assisted movement or translocation of animals and plants (e.g. Van Houtan et al. 2009; Robert et al. 2015; Bellis et al. 2019; Berger-Tal et al. 2020). Translocation is defined by the IUCN/SSC (2013) as ‘…human-mediated movement of living organisms from one area, with release in another.’ Translocation programs may be motivated by a range of purposes such as reducing population size, addressing animal welfare concerns, commercial and/or recreational interests, or to achieve specific conservation objectives (IUCN/SSC 2013). The Guidelines for Reintroductions and Other Conservation Translocations (IUCN/SSC 2013) specify that removing individuals for translocation should not place the source population at risk and possible negative impacts on source populations should be assessed. Conservation-based translocation programs commonly focus on reintroductions or reinforcements within parts of the Indigenous range of the target species, or introductions into areas not known to be formerly occupied by the species (Fischer and Lindenmayer 2000; Short 2009; Robert et al. 2015; Berger-Tal et al. 2020). However, there is an increasing tendency for mitigation or salvage translocations in situations that involve human-wildlife conflicts, including where a translocation program for a species is focused on removal of individuals from habitat scheduled for clearing for land uses such as urban development (Short 2009; Massei et al. 2010; Germano et al. 2015).
In Australia, there are few cases where translocations have been comprehensively planned, implemented, and monitored over an extended timeframe. Mitigation-type translocations are often described as unsuccessful in the literature (Fischer and Lindenmayer 2000; Edgar et al. 2005). Fauna translocations can be complex undertakings with inherent risks including adverse effects on individual and population health, disruptions to genetic integrity, and interference with in situ residents at recipient sites (Griffith et al. 1989; Fischer and Lindenmayer 2000; Short 2009; Berger-Tal et al. 2020). Outcomes from fauna translocation have commonly been poorly reported and/or post-release monitoring has often involved few individuals or short time periods. Typical limitations have included inadequate health surveillance and failure to monitor implications for source populations (Massei et al. 2010; Haskins 2015). Given these considerations, rigourous analysis and a cautionary approach are recommended when assessing possible mitigation translocations (IUCN/SSC 2013). However, the alternative of leaving animals in situ in situations involving unavoidable greenfield developments in urban areas is likely to have adverse outcomes for the individuals and populations involved. Despite advances in the mechanics of translocation ecology, significant knowledge gaps remain and there is a need for extended monitoring and comprehensive reporting (Fischer and Lindenmayer 2000; Short 2009; Moro et al. 2015; Berger-Tal et al. 2020).
The koala (Phascolarctos cinereus) is listed as ‘Endangered’ throughout Queensland under both the State Nature Conservation Act 1992 and the Commonwealth Environment Protection and Biodiversity Conservation Act 1999. Long-term koala population monitoring and recent modelling for south-east Queensland indicated that declines in population density had occurred between 1996 and 2014, ranging from 54% in the Pine Rivers region to 80% in the Koala Coast to the north and east of Brisbane (Rhodes et al. 2015). Our study was focused on a koala population at East Coomera in south-east Queensland where long-standing and irrevocable planning commitments for intensive urban development involved an area known to support koalas. The development included construction of a ‘Town Centre’ and associated residential and commercial areas. Consequently, a substantial portion of the koala population would be displaced by habitat clearing processes. To gain formal approval, the translocation program was required to be thoroughly designed and adequately resourced to collect and contribute new information to help refine future koala translocations. The program design was guided by recommendations from a supporting baseline study (Biolink 2007a) and sought to investigate the complexities and potential pitfalls of translocation, as well as measuring overall success. A Koala Conservation Plan for East Coomera (City of Gold Coast Council 2014) was prepared and adopted by the City of Gold Coast Council at completion of the translocation program to monitor and manage the remaining koala population across the source area. The translocation program was designed to improve welfare outcomes for koalas to be translocated and to augment apparent low-density populations at recipient sites elsewhere in the Gold Coast hinterland.
There have been other smaller scale koala translocation programs in Queensland (e.g. Ellis et al. 1990, 2016; Sutcliffe 1997; Hanger et al. 2017; Ellis and FitzGibbon 2020), New South Wales (e.g. Gall 1978, 1980; Parsons 1990; Biolink 2013), and the Australian Capital Territory (e.g. Braysher 1978) for reasons ranging from reintroduction and reinforcement to mitigation. By comparison, Victoria and South Australia have an extensive history of koala translocation (some at very large scales) primarily designed to address over-population and over-browsing issues (see Warneke 1978; Lee et al. 1990; Santamaria 2002; Duka and Masters 2005; Whisson et al. 2012; Menkhorst 2017; Menkhorst et al. 2019). However, post-translocation monitoring studies have rarely focused on the conservation implications for koala source populations.
This study investigated how the population of koalas at East Coomera responded to the progressive removal of koalas over a 5-year period concomitant with the loss of a substantial area of habitat. Impacts of translocation on source populations are often overlooked and such an investigation has not been conducted for the koala previously. We examined the following fundamental question: ‘How did the source koala population respond to the progressive removal of individuals for translocation and associated substantive loss of habitat?’. To address this question, we conducted surveys before and after translocation and habitat removal to investigate whether changes occurred in koala tree species use, activity, distribution, density, and population size. We included tree condition in the ‘after’ surveys to investigate for possible shifts in the health of the suite of preferred browse species if population density was found to have increased.
Materials and methods
Study area
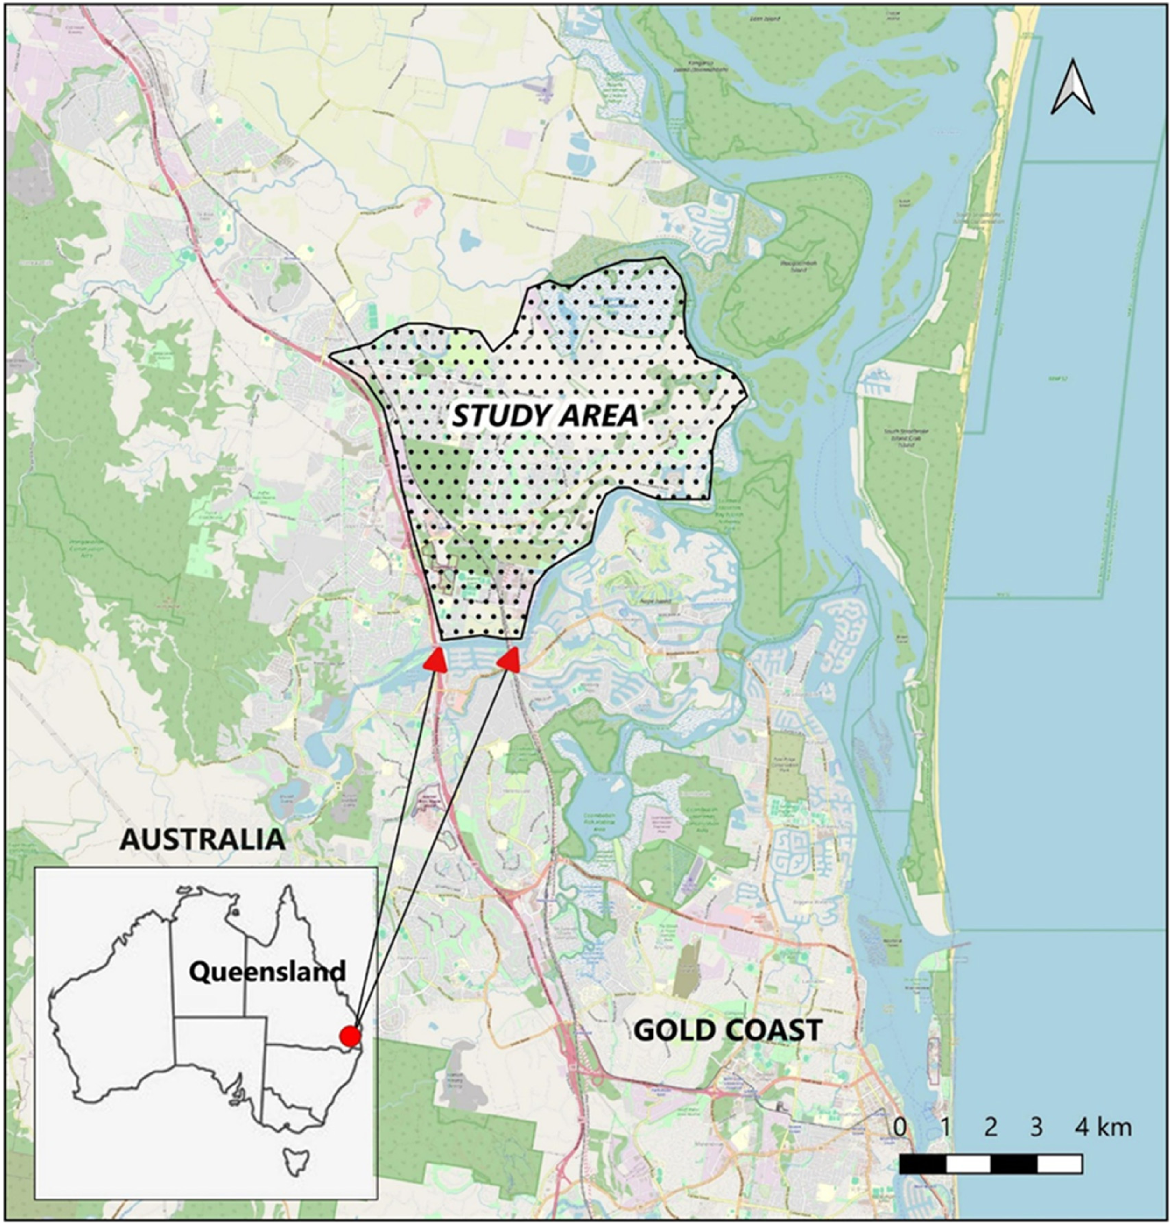
The East Coomera study area is in the north-eastern section of the City of Gold Coast Council in Queensland, Australia. The area is bounded in the south by the Coomera River, in the west by the Pacific Motorway, rural farming lands in the north, and the southern section of Moreton Bay to the east (Fig. 1). The study area covered approximately 3640 ha and was estimated to contain 1716 ha of suitable koala habitat (Biolink 2007b). Most of the suitable habitat (1035 ha) was located within the planned urban area that was estimated to be supporting around 70% of the local koala population (Biolink 2007a). Development of the new Town Centre would involve clearing or modifying the majority of koala habitat in the urban area, leading to displacement of resident koalas to other locations, some of which were assessed as high-risk (e.g. Pacific Motorway, other major roads, railway line, existing residential areas).
Translocation background
To avoid forced dispersal of koalas from development sites and exposing them to increased risks of mortality, 166 koalas were progressively translocated away from the study site over a 5-year period from 2009 to 2013. The translocations away from the East Coomera source population totalled 18 koalas (two adult males (AM), eight adult females (AF), two subadults (SA), six juveniles (J)) in 2009, 45 koalas (7AM; 19AF, 6SA, 13J) in 2010, 17 (4AM; 6AF, 6SA, 1J) in 2011, 31 (8AM; 15AF, 5SA, 3J) in 2012, and 55 (15AM; 22AF, 14SA, 4J) in 2013. Because the study involved a mitigation-based translocation, it was necessary to recruit all koalas for translocation ahead of clearing on approved development sites. Hence, a diversity of age-sex classes and health profiles were included in the translocated group. As well as removing individuals from risk of immediate harm, we hoped that this would also reduce risks of overcrowding, which could theoretically increase susceptibility to stress-related illness and disease transmission (see Brearley et al. 2012; Mundey 2012; Carreira et al. 2020). Any koalas with clinical signs of disease or that tested positive for active chlamydial infection were admitted for hospital treatment prior to translocation. Because the source population is the focus of this component of the translocation study, the criteria for recipient site selection is not presented here.
Koala surveys
The field surveys were conducted in two periods as consultancies for the City of Gold Coast: (1) baseline surveys in 2006; and (2) resurveys in areas of remaining habitat in 2017 (Biolink 2007a, 2017). Over the period between survey events, approximately 750 ha of the available habitat had been cleared. Survey sites were located based on a grid positioned over the study area. Grid cells measured 350 × 350 m except in the narrow area located between the Pacific Motorway and the railway corridor. Grid cells there were 250 × 250 m to allow for adequate sampling. Survey sites were located where grid intersections coincided with areas of native vegetation containing eucalypts. Garmin GPS units were used to locate survey sites. Sites were sampled using the Spot Assessment Technique (SAT) of Phillips and Callaghan (2011). This involves searching a 1-m catchment around the base of 30 nearest trees (≥10 cm diameter at breast height (dbh)) at each site for koala scats. A direct count of koalas was also conducted by at least two experienced observers searching every tree within a 25-m radius of the SAT centre tree (i.e. covering a search area of 0.196 ha). Only independent-aged individuals were entered for estimation of koala density values. Details including sex, assumed reproductive status (females only), and any overt signs of illness (e.g. conjunctivitis, wet-stained rump, clumped fur, emaciated body condition) were recorded for each koala observation based on inspection through binoculars.
Analysis of tree species usage data
The scat surveys provide evidence of tree species use (i.e. feeding and shelter) by koalas in both survey periods (2006 and 2017). Results from other studies verify that Eucalyptus species comprise the majority of browse consumed by koalas (e.g. Moore and Foley 2000; Sullivan et al. 2003; Smith 2004; Tucker et al. 2007). Hence, we divided the eucalypt data into two groups: (1) the preferred suite of species; and (2) other eucalypts. City-wide koala habitat assessment surveys undertaken in 2006 involved sampling 11,190 trees (including 26 species of Eucalyptus) across 32 different mapped Regional Ecosystem types (Biolink 2007b). The statistically homogeneous suite of most preferred eucalypt species for koalas throughout the City of Gold Coast was identified as forest red gum (Eucalyptus tereticornis), tallowwood (Eucalyptus microcorys), grey gum (Eucalyptus propinqua/biturbinata), and swamp mahogany (Eucalyptus robusta) (Biolink 2007b). For this study, we were particularly interested in discovering if there was any evidence of shifts in tree species preferences or levels of use that might be due to changes in koala density or possible over-crowding. A relevant example was reported by Martin (1985) from an investigation of koala food trees and defoliation impacts in reasonably isolated habitat at South Gippsland, Victoria.
Analysis of koala activity and koala density
The distribution of koala activity was established to help identify focal areas for the local population and for comparison between the two study periods. In accord with the SAT sampling protocols of Phillips and Callaghan (2011) koala activity levels for each site were estimated by dividing the total number of trees that had scats recorded within the search area around their base, by the total number of trees sampled (typically 30). For both survey events, koala density was estimated by dividing the total number of adult koalas sighted in all 25-m (0.196 ha) radial searches by the total area sampled using this approach. The density estimates for the two survey events (i.e. 2006 and 2017) were compared by selecting with replacement 20 subsets of 50 sites from the 101 sites surveyed in both 2006 and 2017, with 10 subsets allocated to each survey event. Mean density estimates were then calculated for each of the survey events prior to testing for homogeneity of variance (F-test) and comparison using the appropriate t-test.
Estimation of population size
The mean density estimates derived from the radial searches were multiplied by the total area of potential koala habitat derived for 2006 and 2017, respectively, by digitising remaining patches of mixed forest containing eucalypt species from recent air photo imagery. The available habitat at the study site consists of a mosaic of coastal forest communities (i.e. Regional Ecosystems as identified by the Queensland Herbarium) dominated by eucalypt and non-eucalypt canopy tree species, including the local preferred koala food and shelter resources. This approach is comparable to that reported by Dique et al. (2004) for an adjoining area in south-east Queensland. The koala density estimates derived by Dique et al. (2004) incorporated a koala sightability correction factor of 1.2. This was not applied in our study because we expect location-specific differences in sightability. Dique et al. (2001) reported that missing 20% of the koalas present produced only a small increase in the standard deviation of density and was little influenced by koala distribution. We have assumed that the percentage of koalas detected was equivalent in our two sample periods. The large numbers of sites that we sampled enabled variation in density to be estimated.
Activity modelling
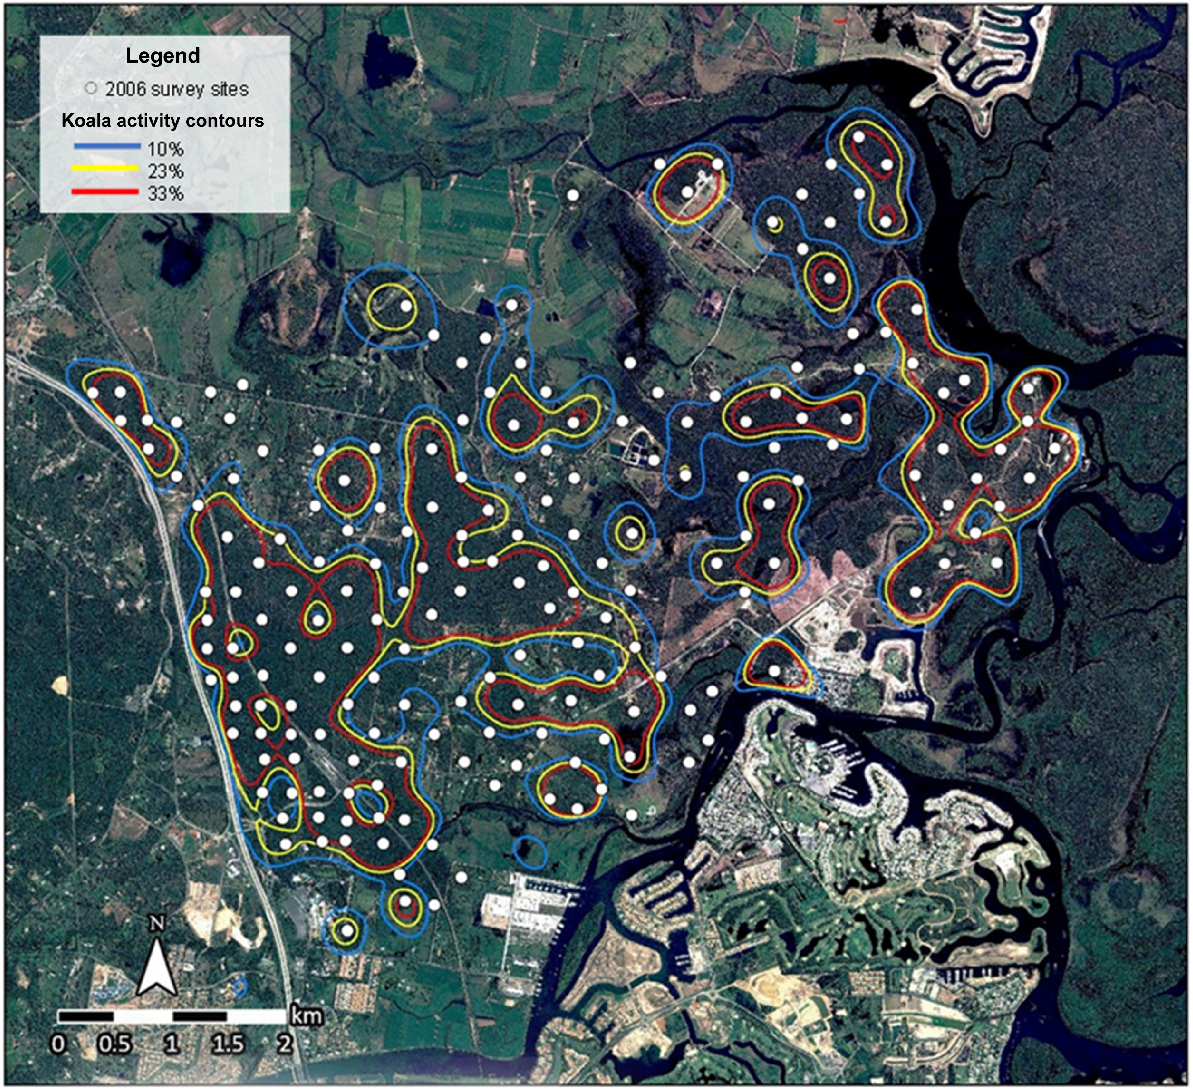
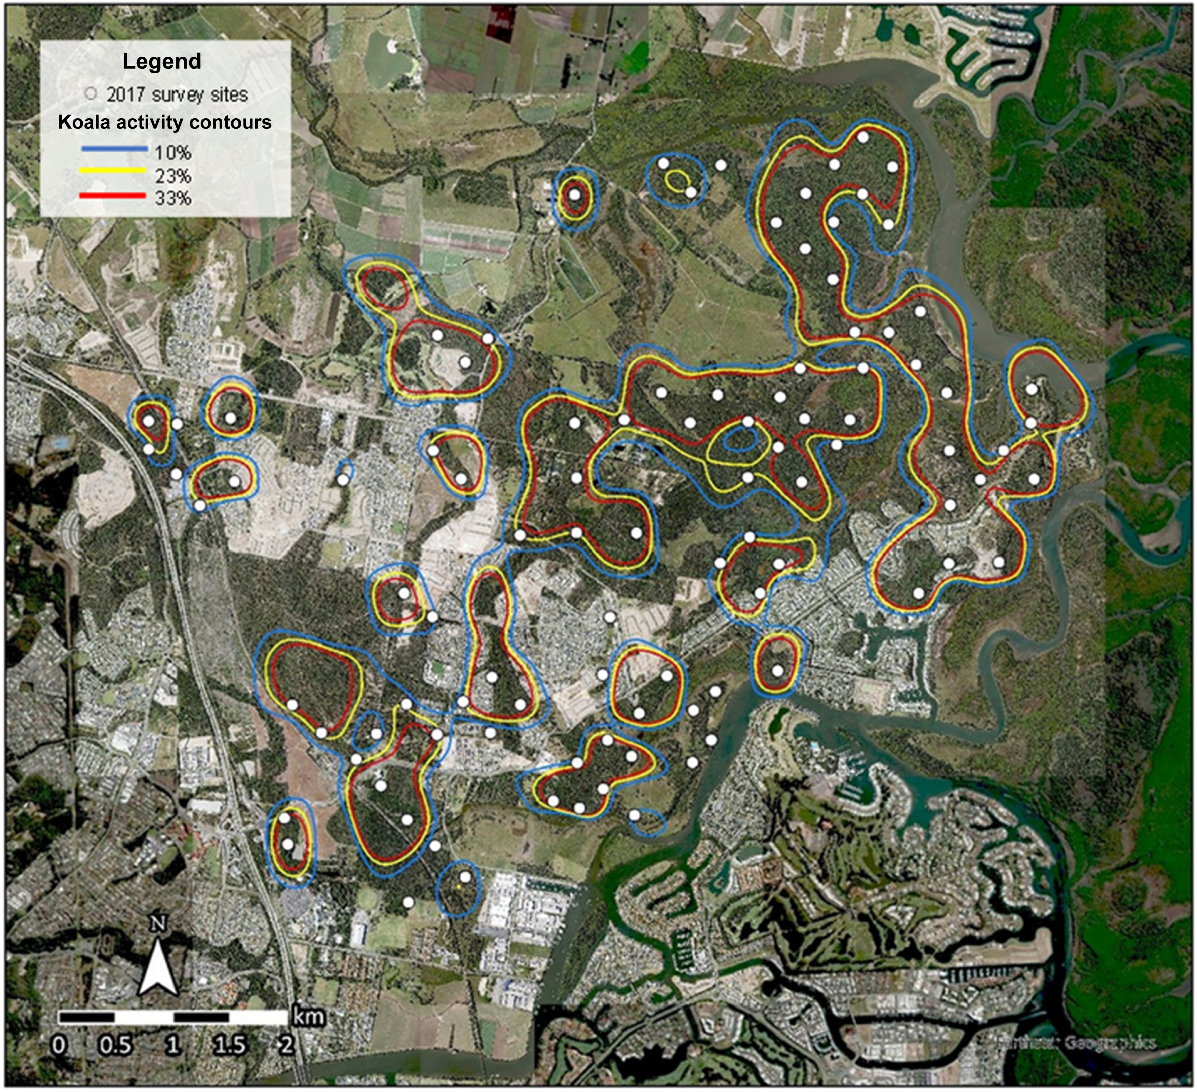
Koala activity levels for each SAT site were used as a basis for ArcGIS spatial analysis involving a combination of regularised splining using the default parameters to interpolate koala activity across the study area (Biolink 2007a; 2017), followed by contouring. This produces a koala activity contour map that theoretically delineates areas supporting established resident koalas by identifying significant activity values of 22% and 32% based on the east coast medium-high population density activity thresholds detailed in table 2 of Phillips and Callaghan (2011), with the addition of a 10% activity contour. The 10% contour buffers the extent of significant activity and delineates areas of potential important use in elevated sections of the study area where koala carrying capacity is likely to be lower, while also providing insights into aspects of connectivity between areas of higher use.
Analysis of occupancy using scat surveys
In addition to naïve estimates of the proportion of area occupied (naïve occupancy) arising from field surveys, we used an occupancy framework (see Mackenzie et al. 2018) to investigate changes in occupancy between the two time periods. We used the correlated detection model of Hines et al. (2010) as implemented in program PRESENCE ver. 12.24 (USGS Patuxent Wildlife Research Centre, Laurel, MD, 20708, USA). This approach makes use of spatial repeat samples at sites where there is only a single sample occasion. Because there are spatial replicates at the sample units it is likely that those samples are highly correlated. This requires estimation of availability of the target species to be detected. Furthermore, if the correlated nature of the samples is not accounted for the estimates of occupancy will be biased.
We had two periods of sampling that we analysed separately. We were not interested in parameters that related to colonisation and extinction at sample sites given that the spatial coverage of our sites changed over time due to removal of some habitat areas. We had up to 30 spatial replicate surveys at each site consisting of koala scat searches under individual trees. We constructed detection histories (H) for each site reflecting whether a scat was detected (1) or not (0) at each tree (i.e. H = 0,0,0,1,1,0,1,1 and so on). The modelling approach of Hines et al. (2010) includes different parameters than other forms of occupancy modelling. The key addition is the need to model the availability of the target species given the correlated sampling. This model includes occupancy (psi), and detection (P) but in this case, detection is conditioned on availability. The other key difference is the inclusion of three availability theta (θ) parameters: (1) θ1 is the probability of availability (i.e. koala scats) in the first survey or in this case at the first tree sampled; (2) θ0 is the probability of availability where not detected at the previous tree survey; and (3) θ1 is the probability of availability when detected at the previous tree.
We conducted our analysis in three steps. We first ran different detection models and then used the best outcomes to model the θ parameters. Once the top θ models were identified we refitted the detection covariates to ensure the top model had been identified. We investigated the influence of five tree preference groups as the covariates that might influence detection and the θ parameters. A large body of literature documents that koalas exhibit preference for different tree species or groups of species (e.g. Moore and Foley 2000; Phillips and Callaghan 2000; Phillips et al. 2000; Sullivan et al. 2003; Tucker et al. 2007; McAlpine et al. 2008). Hence, we expected tree preference to influence whether a scat was detected. The tree groups were those identified in the analysis of tree use: group 1, which is the statistically homogeneous suite of most-preferred eucalypt species); group 2, which is the suite of less-preferred eucalypt species in Table 1; and groups 3, 4, and 5, which are three ranked sets of non-eucalypt species. These covariates were scored as present/absent and so were dummy coded for each sampled tree. We included these groups as covariates one at a time with a parameter and then constructed models incorporating several of these covariates.
| Tree species groupings | 2006 Baseline surveys | 2017 Repeat surveys | |
|---|---|---|---|
| Preferred eucalypt species (g1) | |||
| Tallowwood (Eucalyptus microcorys) | 0.49 ± 0.02 | 0.57 ± 0.11 | |
| Forest red gum (Eucalyptus tereticornis) | 0.48 ± 0.02 | 0.63 ± 0.03 | |
| Swamp mahogany (Eucalyptus robusta) | 0.36 ± 0.05 | 0.88 ± 0.12 | |
| Grey gum (Eucalyptus propinqua) | 0.46 ± 0.03 | 0.41 ± 0.08 | |
| Non-preferred eucalypt species (g2) | |||
| Narrow-leaved ironbark (Eucalyptus crebra) | 0.28 ± 0.02 | 0.28 ± 0.04 | |
| Grey ironbark (Eucalyptus siderophloia) | 0.30 ± 0.02 | 0.33 ± 0.05 | |
| White stringybark (Eucalyptus eugenioides) | 0.19 ± 0.04 | 0.44 ± 0.09 | |
| Tindale’s stringybark (Eucalyptus tindaliae) | 0.22 ± 0.03 | 0.39 ± 0.06 | |
| White mahogany (Eucalyptus acmenoides) | 0.21 ± 0.05 | 0.38 ± 0.09 | |
| Broad-leaved white mahogany (Eucalyptus carnea) | 0.29 ± 0.02 | 0.21 ± 0.08 | |
| Broad-leaved red ironbark (Eucalyptus fibrosa) | 0.22 ± 0.04 | 0.15 ± 0.07 | |
| Blackbutt (Eucalyptus pilularis) | 0.08 ± 0.03 | 0.40 ± 0.08 | |
| Red mahogany (Eucalyptus resinifera) | 0.32 ± 0.05 | 0.20 ± 0.13 | |
| Narrow-leaved red gum (Eucalyptus seeana) | 0.27 ± 0.04 | 0.42 ± 0.10 | |
Use is defined as the proportion of trees of a species with koala scats divided by the total number of trees sampled of that species across all sites with scats. g is the eucalypt species groupings used in occupancy modelling.
Models were compared using Akaike’s Information Criterion for small sample size (AICc), to indicate how well they explained the data (Burnham and Anderson 2004). Models were ranked from lowest to highest AICc. Differences in AICc between the top model and another model (ΔAICc) suggest the strength of support for that model (Burnham and Anderson 2004). Models with ΔAICc <2 were considered equally supported. Increasing values of ΔAICc indicate less support for a model. If a covariate added to a top model did not improve model fit by >2ΔAICc it was deemed an uninformative parameter and omitted (see Arnold 2010).
Vegetation condition
Vegetation health assessments were conducted at each SAT site in 2017. Each tree surveyed within the SAT was given a health rating of (1) <30% healthy foliage present (i.e. foliage not missing due to tree death or decline, or mistletoe infestation), (2) 30–70% healthy foliage present, or (3) >70% healthy foliage present (Department of Sustainability and Environment (DSE) 2004). A Geographic Resource Solutions densitometer was used to score canopy cover at 25 points within each 25-m radial survey area, five around the centre point and five at each of the four cardinal points at the outer margin of each assessment site. An average of the 25 values was calculated. The species and number of saplings (i.e. trees <10 cm dbh) were also recorded within each of the 25-m radial search areas at each survey site. Any evidence of declines in tree health or defoliation that may be associated with over-browsing pressures by koalas is likely to be focused on the identified preferred tree species (e.g. Martin 1985).
Results
Tree species use
The baseline data for the East Coomera surveys in 2006 involved 5142 trees from 200 SAT sites. The surveys for 2017 sampled 2615 trees across 106 SAT sites that remained in vegetated areas, including five sites that could not be accessed in 2006. This included 859 trees from 14 eucalypt species and 1756 trees from 27 non-eucalypt species (Table 1). Tree species use in 2017 from sites with scats ranged from 0.88 for swamp mahogany to 0.15 for broad-leaved red ironbark. Tree use data from both sampling periods were determined to be normally distributed. There was a significant increase in the level of proportional utilisation for the pooled suite of seven preferred eucalypt species from 2006 to 2017 (mean 2006 = 0.448, mean 2017 = 0.622; χ2 = 14.832; 1d.f., P = 0.0001). Use of the pooled group of 10 non-preferred eucalypt species was also significantly elevated in 2017 compared to 2006 (mean 2006 = 0.238, mean 2017 = 0.32; χ2 = 5.611; 1d.f., P = 0.0179).
Koala activity levels
In the 2006 baseline surveys, 159 (79.5%) of the 200 SAT sites had evidence of koala activity (i.e. koala scats recorded). The mean koala activity level in 2006 was 28.4% (±2.8% s.e.). A total of 52% of sites (n = 105) had an activity level above the 22% activity threshold for medium use. Koala activity levels in 2017 averaged 41.4% (±2.9% s.e.) with koala scats recorded at 89.6% of the SAT sites. The activity levels for 67% of sites (n = 71) were above the 22% activity threshold for medium use. The mean activity level recorded in 2017 was significantly higher than that recorded in 2006 (F(105) = 1.1, P = 0.315, t(205) = 3.227; P < 0.001).
Koala activity models
The koala activity models produced from the 2006 and 2017 SAT surveys delineated locations of significant koala activity across the East Coomera study area (Figs 2 and 3). Comparison of the two models indicated that koalas were still resident in 2017 in previously occupied locations where suitable habitat remained. The comparison revealed:
Reduction and fragmentation of bushland habitat and decreased significant koala activity within central and western sections of the study area where urban development was focused.
An increase in areas supporting significant koala activity in the north-eastern section beyond the extent of intensive urban development.
Occupancy analysis
Evidence of habitat use by koalas was recorded from 159 of the 200 sampled field sites, enabling a naïve occupancy estimate of 79.5%.
A detection model where tree group 1 was added as a covariate differed to the null model by >100 AIC. The addition of other tree group covariates to the group 1 covariate including less preferred eucalypts (group 2 (g2)) and ranked non-eucalypts (group 3 (g3), group 4 (g4) and group 5 (g5)), substantially improved model fit (Table 2). The addition of group 3 substantially improved model fit. This model had a model weight of 1.0 so was substantially more plausible than any other model. Estimates for detection at a tree conditioned on when a koala was present was much higher for tree groups 1 and 3 than for the other three groups, though it was above 0.5 for all groups (Fig. 4).
| Model | AICc | ΔAICc | w | ML | k | |
|---|---|---|---|---|---|---|
| Detection | ||||||
| p(g1 + g3) | 4552.27 | 0.00 | 1.00 | 1.00 | 7 | |
| p(g1 + g4) | 4566.19 | 13.92 | 0.00 | 0.00 | 7 | |
| p(g1 + g2) | 4567.26 | 14.99 | 0.00 | 0.00 | 7 | |
| p(g1 + g5) | 4567.26 | 14.99 | 0.00 | 0.00 | 7 | |
| p(g1) | 4570.71 | 18.44 | 0.00 | 0.00 | 6 | |
| Theta (θ) parameters | ||||||
| θ0(g4 + g5), θ1(g4 + g5) | 4525.03 | 0.00 | 1.00 | 1.00 | 11 | |
| θ0(g4 + g2), θ1(g4 + g2) | 4543.24 | 18.21 | 0.00 | 0.01 | 11 | |
| θ0(g4), θ1(g4) | 4544.32 | 19.29 | 0.00 | 0.00 | 9 | |
| θ0(g5), θ1(g5) | 4544.38 | 19.35 | 0.00 | 0.00 | 9 | |
| θ0(g2), θ1(g2) | 4544.42 | 19.39 | 0.00 | 0.00 | 9 | |
The covariates represent different ranked tree groups (g) including eucalypts (g1 and g2) and non-eucalypts (g3, g4, and g5). For detection only that parameter is shown. The top detection model was used for all theta models but is not shown. The occupancy parameter (psi) is held constant and is not shown.
Parameter estimates (see text for definition) from the top correlated detection model for 2006 koala scat surveys. g, different numbered tree groups (see Table 1); th, θ (theta). The symbol (/) indicates those groups were estimated as equivalent.
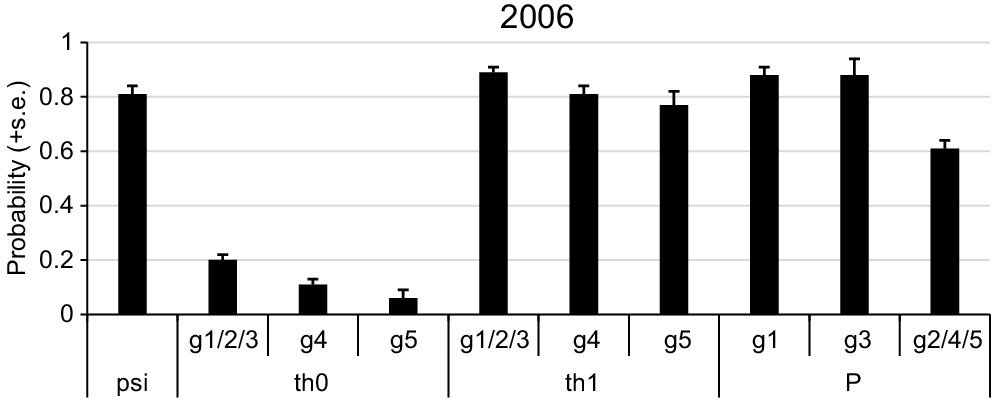
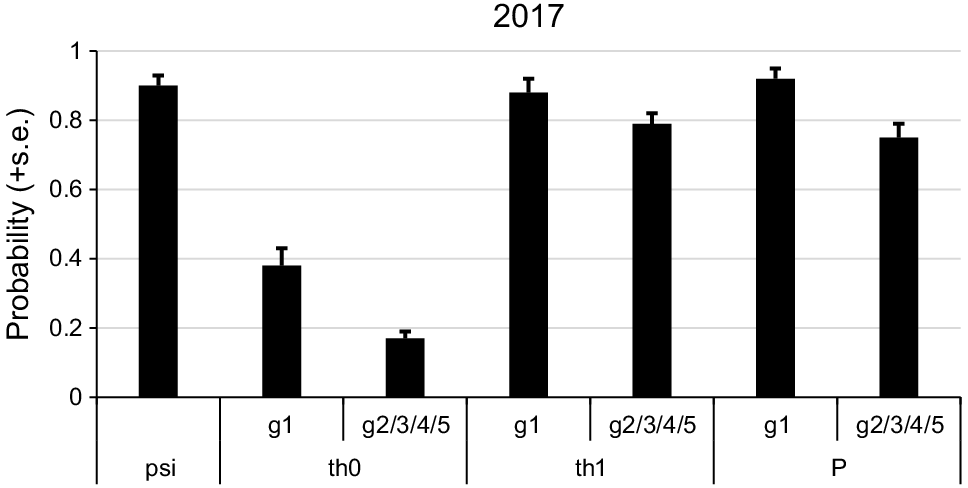
The addition of one of the tree group covariates to the θ parameters improved model fit relative to a null θ model except for the inclusion of group 3. The addition of either group 4 or group 5 differed to the null θ model by >7 AIC. The top model included groups 4 and 5, and consequently groups 1, 2 and 3 were estimated equal. This showed that if a scat was not detected at the previous tree the probability of being present at a tree (θ0) was low but almost twice as high for group 1, 2 and 3 compared to group 4 and three times higher than for group 5. If a scat was detected at the previous tree the probability of being present at a tree (θ1) was very high (>0.7) for all tree groups (Fig. 4). The substantially different values for θ0 and θ1 confirm the correlated detection process of these surveys. The estimate of psi from the top model was 0.81 ± 0.03. The estimate of θ1 was 0.75 ± 0.07.
Evidence of habitat use by koalas was recorded from 95 of the 106 sampled field sites resulting in a naïve occupancy estimate of 89.6%.
A detection model in which tree group 1 was added as a covariate differed to the null model by >40 AIC. This model differed to the next best model by >30 AIC and was clearly the most plausible model (Table 3). The estimate for detection at a tree was much higher for tree group 1 compared to all other groups (Fig. 5). The addition of tree group 1 and 5 covariates to the θ parameters improved model fit relative to a null θ model (Table 3). A model with group 3 did not converge so was excluded. The top model that included group 1 was the most plausible, differing to the next model by >10AIC. Under this model if a scat was not detected at the previous tree the probability of being present at a tree (θ0) was 0.38 for group 1 but 0.17 for other groups. If a scat was detected at the previous tree the probability of being present at a tree (θ1) was very high (>0.7) for all tree groups (Fig. 5). The estimate of psi from the top model was 0.90 ± 0.03. The estimate of θ1 was 0.66 ± 0.11.
| Model | AICc | ΔAICc | w | ML | k | |
|---|---|---|---|---|---|---|
| Detection | ||||||
| p(g1) | 2751.77 | 0.00 | 1.00 | 1.00 | 6 | |
| p(g4) | 2786.53 | 34.76 | 0.00 | 0.00 | 6 | |
| p(g5) | 2789.11 | 37.34 | 0.00 | 0.00 | 6 | |
| p(g3) | 2794.86 | 43.09 | 0.00 | 0.00 | 6 | |
| p(g2) | 2798.55 | 46.78 | 0.00 | 0.00 | 6 | |
| Theta (θ) parameters | ||||||
| θ0(g1), θ1(g1) | 2733.69 | 0.00 | 1.00 | 1.00 | 8 | |
| θ0(g5), θ1(g5) | 2747.47 | 13.78 | 0.00 | 0.01 | 8 | |
| θ0(.), θ1(.) | 2751.77 | 18.08 | 0.00 | 0.00 | 6 | |
| θ0(g4), θ1(g4) | 2752.65 | 18.96 | 0.00 | 0.00 | 8 | |
| θ0(g2), θ1(g2) | 2753.79 | 20.10 | 0.00 | 0.00 | 8 | |
The covariates represent different ranked tree groups (g) including eucalypts (g1 and g2) and non-eucalypts (g3, g4 and g5). For detection only that parameter is shown. The top detection model was used for all theta models but is not shown. The occupancy parameter (psi) is held constant and is not shown.
Parameter estimates (see text for definition) from the top correlated detection model for 2017 koala scat surveys. g, different numbered tree groups (see Table 1); th, θ (theta). The symbol (/) indicates those groups were estimated as equivalent.
Koala sightings
Nine koalas were located during the 2006 baseline surveys within the 25-m radial search area at seven of the 200 SAT sites covering 39.2 ha (Biolink 2007a). The repeat SAT surveys in 2017 resulted in six koala sightings from 101 SAT sites covering 19.8 ha. Health profiles were established for each member of the source population when captured for translocation or in situ monitoring. The health rating data was used for survival analysis modelling for the translocation study group compared to members of the source population, and existing residents at recipient sites. Outcomes from that component of the study are reported separately.
Population density and size estimates
A density estimate of 0.30 ± 0.05 (s.e.) koalas per hectare (ha−1) was derived from 101 SAT-based radial searches in 2017. The estimated density from the 2006 surveys was 0.23 ± 0.03 (s.e.) koalas ha−1. Extrapolation of the 2006 density estimate across 2217 ha of koala habitat produced an overall population estimate of 510 ± 67 (s.e.) koalas, compared to 440 ± 66 (s.e.) koalas for 2017 across 1467 ha of remaining habitat (Table 4). The comparison of mean (M) density estimates derived for the two survey events (n = 10 for each event) using the set of 101 repeat sites (M 2006 = 0.234; M 2017 = 0.295) indicated that they were not significantly different (F(9) = 2.029, P = 0.153, t(18) = 1.116, P = 0.279 two-tailed test).
| Comparison of survey results | |||
|---|---|---|---|
| Key survey results | 2006 | 2017 | |
| Koala habitat area | 2217 ha | 1467 ha | |
| No. SAT sites | 200 | 106 | |
| No. trees surveyed | 5124 | 2615 | |
| No. active SATs | 159 | 95 | |
| Mean activity level | 28.4% ± 2.8% | 41.4% ± 2.9% | |
| No. medium-high use sites | 105 (52.5%) | 71 (66.9%) | |
| Naïve occupancy (field survey) | 0.80 ± 0.03 | 0.90 ± 0.06 | |
| Modelled occupancy (psi) | 0.81 ± 0.03 | 0.90 ± 0.03 | |
| Modelled availability (θ1) | 0.75 ± 0.07 | 0.66 ± 0.11 | |
| Density estimate (koalas per ha) | 0.23 ± 0.03 | 0.30 ± 0.05 | |
| Population estimates | 510 ± 67 | 440 ± 66 | |
| Population est. range (±95% CI) | 379–641 koalas | 308–572 koalas | |
Tree health
The assessment of tree health in 2017 involved 2615 trees across the SAT survey sites. Overall, 243 trees (9.3%) were recorded in the highest health category (3) >70% healthy foliage, 1909 trees (73%) in the medium category (2) 30–70% healthy foliage, and 463 trees (17.7%) in the lowest category (1) <30% healthy foliage. All sites except for four had ≥50% of trees in the medium health category, three of these recorded ≥40% of trees in the lowest category. Eleven sites in the north-east, south-east and north-west sections of the study area recorded ≥20% of trees in the lowest health category.
Health of preferred koala food trees (PKFTs)
PKFTs were present at 70.8% of the sites and represented ≥20% of surveyed trees at 31.1% of sites. A total of 370 PKFTs were assessed with 74.3% of these assigned to the medium health category (2), displaying 30–70% expected healthy foliage cover (Table 5). The proportion of each PKFT species assigned to the medium health score included tallowwood (80.95%), forest red gum (74.92%), small-fruited grey gum (68.42%), and swamp mahogany (62.50%). Of the forest red gums, 15.2% recorded <30% healthy foliage present. Of sites where PKFTs were present, only four were of concern regarding health ratings for PKFTs compared to non-preferred trees. Three of these sites occur in areas of high browsing pressure due to relatively small patch size and high koala density.
| PKFT species | Health rating 1 | Health rating 2 | Health rating 3 | Total trees | Total sites | |
|---|---|---|---|---|---|---|
| Emic | 3 (14.29%) | 17 (80.95%) | 1 (4.76%) | 21 | 7 | |
| Epro | 5 (13.16%) | 26 (68.42%) | 7 (18.42%) | 38 | 14 | |
| Erob | 2 (25%) | 5 (62.50%) | 1 (12.50%) | 8 | 2 | |
| Eter | 46 (15.18%) | 227 (74.92%) | 30 (9.90%) | 303 | 57 | |
| Total PKFT | 56 (15.14%) | 275 (74.32%) | 39 (10.54%) | 370 | 75 | |
| Total non-PKFT | 406 (18.17%) | 1627 (72.8%) | 202 (9.04%) | 2235 | 106 | |
| Totals | 462 | 1902 | 241 | 2605 | 106 |
Ratings of overall health condition score for trees surveyed within SAT sites: 1 = <30% healthy foliage; 2 = 30–70% healthy foliage; 3 = >70% healthy foliage. Emic, Eucalyptus microcorys; Epro, Eucalyptus propinqua; Erob, Eucalyptus robusta; Eter, Eucalyptus tereticornis.
A total of 11,190 saplings were recorded from the SAT sites. Of these, 2.2% (n = 237) were PKFT saplings; predominantly forest red gum, as well as tallowwood, grey gum, and occasional swamp mahogany. Of the sites where PKFT saplings were absent (but other saplings were present), 75.7% (n = 78) contained PKFTs >10 cm dbh. Where PKFT saplings were present, 86.3% of sites (n = 44) contained PKFTs >10 cm dbh (Table 6). Within the 25-m radial assessment areas at SAT sites, PKFT saplings were present at 48.1% of sites (n = 51). Regression analysis did not identify any significant correlation between koala activity levels and the numbers of saplings present at survey sites (y = −0.034x + 44.965, r2 = 0.012), which was explored to investigate whether sapling abundance might have a positive influence on koala activity.
| Mean number of saplings ± s.e. | Maximum number saplings per site | Total number of saplings | Number of sites where saplings present | Number of sites with PKFTs >10 cm dbh present | ||
|---|---|---|---|---|---|---|
| Non-PKFT saplings | 103.33 ± 9.16 | 512 | 10,953 | 103 | 78 | |
| PKFT saplings | 2.24 ± 0.44 | 27 | 237 | 51 | 44 | |
| Total | 11,190 |
Eighty sites (75.5%) recorded mean densitometer readings between 40% and 80% foliage projective cover (FPC). Eleven sites recorded mean FPC readings above 80%, predominantly in north-eastern sections of the study area beyond the urban landscape. Remaining sites with mean FPC readings below 40% were mainly located in or adjoining urban areas or in partially cleared rural areas.
Discussion
While translocation has an important role to play for species conservation and recovery, few studies have involved detailed investigations into potential impacts on free-ranging source populations (Griffith et al. 1989; Fischer and Lindenmayer 2000; Dimond and Armstrong 2007; Massei et al 2010; Berger-Tal et al. 2020; Mitchell et al. 2022). Nevertheless, a fundamental goal for conservation translocation (except in rare circumstances) is to avoid prolonged negative effects and maintain viability of the source populations (IUCN/SSC 2013). In the case of previous large-scale koala translocation programs designed to address over-abundance issues in parts of southern Australia (Victoria and South Australia), management success has typically been measured in terms of effects at the source site. However, the foremost aim in these cases was to induce a substantial reduction in abundance and over-browsing of preferred food trees, with less emphasis on outcomes for the translocated individuals (Whisson et al. 2012). In these circumstances, measures of success have tended to centre on the extent of recovery of declining tree health and general welfare of koalas that remain at the source site (Menkhorst 2017; Menkhorst et al. 2019). Detailed monitoring and reporting on impacts of translocation on demographic trends and viability for the source population have not generally been a focus, although Whisson et al. (2012) and Menkhorst et al. (2019) did compare outcomes for some translocated individuals to control groups at source sites.
The East Coomera investigation provides an important study of outcomes for the source koala population following a progressive removal of a relatively large number of adults. The analysis examined changes in density, distribution, and abundance of the koala population at either end of a 10-year period in a rapidly developing landscape in south-east Queensland. Results from baseline surveys in 2006 were compared to those from repeat surveys in 2017. Our density estimates fall within the range identified previously for low-density remnant bushland sites (0.18–0.35 koalas ha−1) within the Koala Coast region to the north of the study site (Dique et al. 2004; Rhodes et al. 2011). Koala density did not differ significantly between our two sample periods. Despite the loss of around 750 ha of the available habitat (~34%) and the gradual harvest for the translocation program, the estimated koala population size in 2017 (440 ± 66 s.e.) was only moderately less than that estimated for 2006 (510 ± 67 s.e.). The probability of occupancy was estimated at 0.81 (95% CI 0.75–0.87) for 2006, and 0.90 (95% CI 0.83–0.95) for 2017. Most field survey data typically underestimate true occupancy (MacKenzie et al. 2002). However, our modelled outcomes were concordant with the naïve estimates derived from the field surveys (i.e. 2006 = 0.80; 2017 = 0.90). While we used a correlated occupancy model (see Hines et al. 2010) to allow for the structure of our surveys, both the field surveys and the modelling confirmed equivalence in occupancy for the two time periods, before and after harvesting. Estimates of the probability of detection were high in both periods with the preferred tree species group having values >0.8. These values are consistent with high overall abundance because the probability of detection is influenced by local abundance (e.g. Royle and Nichols 2003). We are confident that our results are robust given that they are based on several lines of evidence and the period between survey events allowed time for some equilibration following the translocation harvest.
Further monitoring will be needed to establish whether the population remains stable and if the habitat continues to cope with increased browsing pressures. If not, the incidence of clinical disease may increase within the koala population due to added nutritional and psychological stress and social pressures (Hing et al. 2016). The 2017 surveys did not observe any marked increase in occurrence of overt signs of disease among the sighted koalas, nor did it identify any widespread evidence of declining tree health that might have resulted from increased koala browsing pressures. An earlier study in an area of increasing koala density in Victoria investigated impacts on eucalypt species and confirmed disproportionate and progressive defoliation of the preferred browse species over a 14-month study period (Martin 1985). That study also identified a decline in selection of the preferred browse species during the second year and suggested this may have been due to diminished foliage availability. Our study did not find evidence for substantial changes in tree species selection, implying the koala density observed in 2017 was unlikely to have exceeded habitat carrying capacity at that time. We did identify a significant increase in utilisation of the most preferred browse species. This confirms the significant nutritional role of these species and suggests their availability is likely to function as a limiting factor at the local population level. We also recorded greater exploitation within the less preferred eucalypts (specifically the two stringybark species), suggesting a level of adaptability and the potential for utilisation of some of these species to elevate in response to restricted availability of the more preferred species.
Potential effects of increasing density on reproduction
Evidence from studies on other species has indicated that crowding following sudden habitat loss can have negative impacts on demographic and social structures, as well as species diversity and assemblage patterns (e.g. Vallejos et al. 2020; Amorim et al. 2022; Cudney-Valenzuela et al. 2023). However, despite possible crowding impacts on demographics and survival, overall fecundity may not be reduced, at least over the short term (Amorim et al. 2022). This scenario may be relevant to outcomes for the East Coomera source population, although the reproductive rate of koalas is reasonably low despite some populations having the potential to increase comparatively rapidly (Phillips 2000). While healthy adult female koalas may produce a maximum of one offspring per year following sexual maturity at around 2 years, an average of one young each second year would be most typical over their reproductive life, plus fecundity declines with age and with chlamydial infection (see Handasyde et al. 1990; Martin and Handasyde 1990). The consequence of a shift in population density and demographics may be that key social factors and age-structures involved in regulating population size and carrying capacity could take several years to return to equilibrium. There are several documented cases in Victoria where koala populations have experienced sharp declines in response to unchecked population expansion and over-browsing pressures (Martin and Handasyde 1990; Phillips 2000; Menkhorst 2008). However, there was no evidence of this occurring at East Coomera during the study period.
Capacity of the source population to respond to translocation harvest
The evidence from the East Coomera study demonstrates that relatively large koala populations have the capacity to respond successfully to a progressive harvest associated with a translocation program. This is consistent with broad evidence from koala translocations in Victoria for koala management purposes in the past 90 years (Martin and Handasyde 1990; Menkhorst 2008; Menkhorst 2017; Menkhorst et al. 2019). However, the capacity for any given source population to respond successfully is likely to depend upon critical factors such as the initial population size and demographic parameters, the scale and pace of translocation, population health, habitat quality and functional connectivity, and threatening processes. Several factors may have contributed towards the successful response of the East Coomera source population to the translocations including:
Koalas were only sourced for translocation from sites that were approved for intensive clearing or from other high-risk locations spread patchily across the emerging urban area.
The progressive timing of the translocations between 2009 and 2013 aligned with the pace of clearing approvals, landowner consents for property access, and program logistics.
Retention of forested linkages between new urban areas and adjoining rural landscapes.
A sufficiently large area of remaining habitat was available to maintain adequate demographic stability and reproductive potential to enable population recovery.
A boost in fecundity may have resulted from a temporary reduction in population density through the translocation harvest if density-dependent regulatory mechanisms were involved (see Brook and Bradshaw 2006; Dimond and Armstrong 2007; Mitchell et al. 2022).
Favourable environmental conditions in the years during and immediately following the translocation harvests (i.e. absence of drought or severe wildfire conditions).
Destabilising effects on the source population may have been far more severe had the translocations involved greater numbers or been undertaken over a condensed timeframe. This knowledge is important for the design of future conservation-based koala translocation programs, where it is crucial to avoid major disruptions to source populations. This is likely to be particularly salient when considering Chlamydia-positive populations with lowered reproductive potential and corresponding increased sensitivity to habitat loss and other disturbance (Phillips 2000). There is some evidence to link koala population declines at source locations with harvesting for translocations where habitat loss was not a potential contributing factor to a downward trajectory (Gall 1978, 1980; Phillips 2000). This suggests that individual source populations may respond differently to translocations based on a potentially complex array of factors, regardless of additional disturbance effects. For example, the work of McAlpine et al. (2006) promoted the importance of size of forest habitat patches, their spatial configuration and quality, and connectivity for the occurrence and persistence of koala populations. Rhodes et al. (2008) found that koala habitat-occupancy values were best described by threshold models, whereby minimum requirements for native forest cover of around 60% were identified for the Noosa area, in the same bioregion as the East Coomera study site. Rhodes et al. (2006, 2014) reported that the probability of koala presence increased with the amount of primary and secondary quality koala habitat and decreased in areas supporting high proportions of marginal habitat, and when the density of roads increased. These factors highlight the importance of context when interpreting outcomes from translocation harvests on source populations.
Management implications
Predicting precise impacts of translocation programs on a source population is a complex consideration irrespective of the target species (e.g. Dimond and Armstrong 2007; Mitchell et al. 2022). The primary aim for this study was to measure changes in the size and distribution of a koala source population following a progressive translocation harvest and the outcomes may help to inform the design and management of future translocation programs. The following points are recommended for consideration when assessing potential impacts of translocation harvest on koala source populations:
Incorporate robust baseline assessments for source populations ideally prior to, during, and post-harvesting over an adequate timeframe (e.g. at least one koala generation) to gauge population response.
Plan to recruit animals broadly across the source population rather than focusing in localised areas unless they involve sites intended for unavoidable major disturbance.
Contemplate potential implications from crowding where habitat loss is occurring at the source location (i.e. in the case of mitigation-based translocations) during assessments for potential translocation programs.
Monitor trends in the source population size, density, demographics, health, survival, fecundity, and distribution over an adequate length of time (e.g. one koala generation).
Review outcomes every 3–4 years (i.e. around ½ koala generation time) to allow for adaptive management if needed.
Undertake a priori population viability analysis to explore possible impacts on the source population under a range of harvest scenarios and timeframes (see Dimond and Armstrong 2007; Mitchell et al. 2022).
Conclusion
Monitoring impacts and responses to translocation in source populations should be standard practice. However, it is rarely treated as a research focus and is often scantily reported. In this study, the scope and intensity of in situ monitoring such as we have reported had not been undertaken previously as part of a large-scale koala translocation program. This research has confirmed that it is possible to remove some individuals from a koala population for translocation without severely impacting the source population. This aligns with the principle of not placing the source population at risk by the translocation and accords with the IUCN/SSC (2013) translocation guidelines. The level of disruption and the ability for the population to recover is likely to be contingent upon the scale and the timing of the harvest and caution should be applied in the context of other species. In this case the timeframe was gradual, which likely assisted the population to maintain stable parameters. Given that the study involved a mitigation-based translocation program all koalas from development sites were recruited irrespective of age-class, sex, or cohort status. This may have helped minimise demographic disruptions, despite some population fragmentation effects.
Data availability
The data that support this study will be shared upon reasonable request to the corresponding author and with permission from the City of Gold Coast Council.
Declaration of funding
The 2006 baseline surveys and the repeat 2017 surveys were commissioned and funded by the City of Gold Coast Council. The comparative study and manuscript preparation has been undertaken as a component of a PhD thesis by JC through Southern Cross University.
Acknowledgements
We thank the Biolink field staff for their assistance in undertaking the surveys, and Kirsty Wallis for helping with preparation of the GIS figures. We acknowledge the support and commitment provided by the City of Gold Coast Council and supporting officers who engaged Biolink to undertake the monitoring studies for the East Coomera koala population in 2006 and 2017. The manuscript was improved by helpful input from the Associate Editor and two anonymous referees.
References
Amorim F, Pita R, Mata VA, Beja P, Rebelo H (2022) Crowding after sudden habitat loss affects demography and social structure in a bat population. Journal of Animal Ecology 91(3), 668-680.
| Crossref | Google Scholar | PubMed |
Arnold TW (2010) Uninformative parameters and model selection using Akaike’s information criterion. Journal of Wildlife Management 74(6), 1175-1178.
| Crossref | Google Scholar |
Bellis J, Bourke D, Williams C, Dalrymple S (2019) Identifying factors associated with the success and failure of terrestrial insect translocations. Biological Conservation 236, 29-36.
| Crossref | Google Scholar |
Berger-Tal O, Blumstein DT, Swaisgood RR (2020) Conservation translocations: a review of common difficulties and promising directions. Animal Conservation 23(2), 121-131.
| Crossref | Google Scholar |
Brearley G, McAlpine C, Bell S, Bradley A (2012) Influence of contrasting urban edges on arboreal mammal stress: a case study of squirrel gliders in southeast Queensland, Australia. Landscape Ecology 27(10), 1407-1419.
| Crossref | Google Scholar |
Brook BW, Bradshaw CJA (2006) Strength of evidence for density dependence in abundance time series of 1198 species. Ecology 87(6), 1445-1451.
| Crossref | Google Scholar | PubMed |
Burnham KP, Anderson DR (2004) Multimodel inference: understanding AIC and BIC in model selection. Sociological Methods & Research 33(2), 261-304.
| Crossref | Google Scholar |
Carreira JCA, Bueno C, da Silva AVM (2020) Wild mammal translocations: a public health concern. Open Journal of Animal Sciences 10(1), 64-133.
| Crossref | Google Scholar |
Cudney-Valenzuela SJ, Arroyo-Rodríguez V, Morante-Filho JC, Toledo-Aceves T, Andresen E (2023) Tropical forest loss impoverishes arboreal mammal assemblages by increasing tree canopy openness. Ecological Applications 33(1), e2744.
| Crossref | Google Scholar |
Dimond WJ, Armstrong DP (2007) Adaptive harvesting of source populations for translocation: a case study with New Zealand Robins. Conservation Biology 21(1), 114-124.
| Crossref | Google Scholar | PubMed |
Dique D, Penfold G, Thompson J, Leslie R, Preece H (2001) Koala distribution and density in southeast Queensland: the accuracy and precision of koala surveys. In ‘The research and management of nonurban koala populations’. (Eds K Lyons, A Melzer, F Carrick, D Lamb) pp. 105–121. (Koala Research Centre of Central Queensland: Rockhampton, Queensland)
Dique DS, Preece HJ, Thompson J, de Villiers DL (2004) Determining the distribution and abundance of a regional koala population in south-east Queensland for conservation management. Wildlife Research 31(2), 109-117.
| Crossref | Google Scholar |
Duka T, Masters P (2005) Confronting a tough issue: fertility control and translocation for over-abundant Koalas on Kangaroo Island, South Australia. Ecological Management & Restoration 6(3), 172-181.
| Crossref | Google Scholar |
Edgar PW, Griffiths RA, Foster JP (2005) Evaluation of translocation as a tool for mitigating development threats to great crested newts (Triturus cristatus) in England, 1990–2001. Biological Conservation 122(1), 45-52.
| Crossref | Google Scholar |
Ellis W, FitzGibbon S (2020) A new approach to conserving Queensland’s koalas: re-establishing koala populations in suitable, unoccupied landscapes within the species’ range – Tandora Koala population re-establishment program. Final report to Queensland Government, Department of Environment and Heritage Protection. Koala Ecology Group, The University of Queensland.
Ellis WAH, White NA, Kunst ND, Carrick FN (1990) Response of koalas (Phascolarctos-cinereus) to reintroduction to the wild after rehabilitation. Australian Wildlife Research 17(4), 421-426.
| Crossref | Google Scholar |
Fischer J, Lindenmayer DB (2000) An assessment of the published results of animal relocations. Biological Conservation 96(1), 1-11.
| Crossref | Google Scholar |
Gall BC (1980) Aspects of the ecology of the Koala, Phascolarctos cinereus (Goldfuss), in Tucki Tucki Nature Reserve, New South Wales. Australian Wildlife Research 7(2), 167-176.
| Crossref | Google Scholar |
Germano JM, Field KJ, Griffiths RA, Clulow S, Foster J, Harding G, Swaisgood RR (2015) Mitigation-driven translocations: are we moving wildlife in the right direction? Frontiers in Ecology and the Environment 13(2), 100-105.
| Crossref | Google Scholar |
Griffith B, Scott JM, Carpenter JW, Reed C (1989) Translocation as a species conservation tool: status and strategy. Science 245(4917), 477-480.
| Crossref | Google Scholar | PubMed |
Haskins KE (2015) Alternative perspectives on reintroduction success. Animal Conservation 18(5), 409-410.
| Crossref | Google Scholar |
Hines JE, Nichols JD, Royle JA, MacKenzie DI, Gopalaswamy AM, Kumar NS, Karanth KU (2010) Tigers on trails: occupancy modeling for cluster sampling. Ecological Applications 20(5), 1456-1466.
| Crossref | Google Scholar | PubMed |
Hing S, Narayan EJ, Thompson RCA, Godfrey SS (2016) The relationship between physiological stress and wildlife disease: consequences for health and conservation. Wildlife Research 43(1), 51-60.
| Crossref | Google Scholar |
MacKenzie DI, Nichols JD, Lachman GB, Droege S, Royle JA, Langtimm CA (2002) Estimating site occupancy rates when detection probabilities are less than one. Ecology 83(8), 2248-2255.
| Crossref | Google Scholar |
Martin RW (1985) Overbrowsing, and decline of a population of the Koala, Phascolarctos cinereus, in Victoria. I. Food Preference and Food Tree defoliation. Australian Wildlife Research 12(3), 355-365.
| Crossref | Google Scholar |
Massei G, Quy RJ, Gurney J, Cowan DP (2010) Can translocations be used to mitigate human-wildlife conflicts? Wildlife Research 37(5), 428-439.
| Crossref | Google Scholar |
McAlpine CA, Rhodes JR, Callaghan J, Bowen ME, Lunney D, Mitchell DL, Pullar DV, Possingham HP (2006) The importance of forest area and configuration relative to local habitat factors for conserving forest mammals: a case study of koalas in Queensland, Australia. Biological Conservation 132(2), 153-165.
| Crossref | Google Scholar |
McAlpine CA, Rhodes JR, Bowen ME, Lunney D, Callaghan JG, Mitchell DL, Possingham HP (2008) Can multiscale models of species’ distribution be generalized from region to region? A case study of the koala. Journal of Applied Ecology 45(2), 558-567.
| Crossref | Google Scholar |
Menkhorst P, Ramsey D, O’Brien T, Hynes E, Whisson D (2019) Survival and movements of koalas translocated from an over-abundant population. Wildlife Research 46(7), 557-565.
| Crossref | Google Scholar |
Mitchell WF, Boulton RL, Sunnucks P, Clarke RH (2022) Are we adequately assessing the demographic impacts of harvesting for wild-sourced conservation translocations? Conservation Science and Practice 4(1), e569.
| Crossref | Google Scholar |
Moore BD, Foley WJ (2000) A review of feeding and diet selection in koalas (Phascolarctos cinereus). Australian Journal of Zoology 48(3), 317-333.
| Crossref | Google Scholar |
Moro S, Hayward MW, Seddon PJ, Armstrong DP (2015) Reintroduction biology of Australia and New Zealand fauna: progress, emerging themes and future directions. In ‘Advances in reintroduction biology of Australian and New Zealand Fauna’. (Eds DP Armstrong, MW Hayward, D Moro, PJ Seddon) pp. 285–290. (CSIRO Publishing: Clayton South, Victoria)
Phillips SS (2000) Population trends and the koala conservation debate. Conservation Biology 14(3), 650-659.
| Crossref | Google Scholar |
Phillips S, Callaghan J (2000) Tree species preferences of koalas (Phascolarctos cinereus) in the Campbelltown area south-west of Sydney, New South Wales. Wildlife Research 27(5), 509-516.
| Crossref | Google Scholar |
Phillips S, Callaghan J (2011) The spot assessment technique: a tool for determining localised levels of habitat use by Koalas Phascolarctos cinereus. Australian Zoologist 35(3), 774-780.
| Crossref | Google Scholar |
Phillips S, Callaghan J, Thompson V (2000) The tree species preferences of koalas (Phascolarctos cinereus) inhabiting forest and woodland communities on Quaternary deposits in the Port Stephens area, New South Wales. Wildlife Research 27(1), 1-10.
| Crossref | Google Scholar |
Rhodes JR, Wiegand T, McAlpine CA, Callaghan J, Lunney D, Bowen M, Possingham HP (2006) Modeling species’ distributions to improve conservation in semiurban landscapes: koala case study. Conservation Biology 20(2), 449-459.
| Crossref | Google Scholar | PubMed |
Rhodes JR, Callaghan JG, McAlpine CA, de Jong C, Bowen ME, Mitchell DL, Lunney D, Possingham HP (2008) Regional variation in habitat–occupancy thresholds: a warning for conservation planning. Journal of Applied Ecology 45(2), 549-557.
| Crossref | Google Scholar |
Rhodes JR, Fei Ng C, de Villiers DL, Preece HJ, McAlpine CA, Possingham HP (2011) Using integrated population modelling to quantify the implications of multiple threatening processes for a rapidly declining population. Biological Conservation 144(3), 1081-1088.
| Crossref | Google Scholar |
Rhodes J, Lunney D, Callaghan J, McAlpine C (2014) A few large roads or many small ones? How to accommodate growth in vehicle numbers to minimise impacts on wildlife. PLoS ONE 9(3), e91093.
| Crossref | Google Scholar | PubMed |
Robert A, Colas B, Guigon I, Kerbiriou C, Mihoub J-B, Saint-Jalme M, Sarrazin F (2015) Reintroducing reintroductions into the conservation arena. Animal Conservation 18(5), 413-414.
| Crossref | Google Scholar |
Royle JA, Nichols JD (2003) Estimating abundance from repeated presence-absence data or point counts. Ecology 84, 777-790.
| Crossref | Google Scholar |
Sullivan BJ, Norris WM, Baxter GS (2003) Low-density koala (Phascolarctos cinereus) populations in the mulgalands of south-west Queensland. II. Distribution and diet. Wildlife Research 30(4), 331-338.
| Crossref | Google Scholar |
Tucker G, Melzer A, Ellis W (2007) The development of habitat selection by subadult koalas. Australian Journal of Zoology 55(5), 285-289.
| Crossref | Google Scholar |
Vallejos MAV, Padial AA, Vitule JRS, Monteiro-Filho ELdA (2020) Effects of crowding due to habitat loss on species assemblage patterns. Conservation Biology 34(2), 405-415.
| Crossref | Google Scholar | PubMed |
Van Houtan KS, Halley JM, van Aarde R, Pimm SL (2009) Achieving success with small, translocated mammal populations. Conservation Letters 2(6), 254-262.
| Crossref | Google Scholar |
Whisson DA, Holland GJ, Carlyon K (2012) Translocation of overabundant species: implications for translocated individuals. The Journal of Wildlife Management 76(8), 1661-1669.
| Crossref | Google Scholar |