

Transnational shark trade: personal baggage and postal seizures in Australia and New Zealand
Josephine Lingard A * , Patrick Reis-Santos A , Phillip Cassey B and Bronwyn M. Gillanders A
A
B
Abstract
Sharks (Chondrichthyes) are declining globally with over one third of species threatened with extinction, largely due to anthropogenic threats including overfishing driven by the international trade of products such as fin and meat.
We used border seizure data from Australia and Aotearoa/New Zealand (from passenger flights and unaccompanied mail) to investigate where shark products originated from and whether there were country-specific differences in the products traded through time.
Seizure data were collated from biosecurity and government agencies to investigate the contribution of Australia and Aotearoa/New Zealand to global shark trade.
In Australia, shark products were more likely to originate from Asia and the total number of seized products decreased over time. In Aotearoa/New Zealand, Australia was the top originating country. Both countries showed clear reductions in seizures in 2020–2021 when border closures were enforced due to COVID-19. Trophy items, such as preserved specimens, were more likely to originate from the USA while fin products originated from Hong Kong and China. Less than 1% of seizures from both countries contained species-specific information, with 14 of the 18 species seized listed on CITES Appendix II.
International trade of shark products for personal use in Australia and Aotearoa/New Zealand was evident, with Australia a potential source and gateway for these products, raising concerns around the trade of endangered species.
Improving recorded species information is essential to enhance monitoring and support regulations on the trade of sharks and endangered species.
Keywords: Australia, biosecurity seizures, chondrichthyan, conservation, elasmobranchs, fins, New Zealand, wildlife trade.
Introduction
International wildlife trade is a multibillion-dollar industry (Haken 2011), involving legal and illegal trade, and a wide range of species and countries (Harfoot et al. 2018; ‘t Sas-Rolfes et al. 2019). Thousands of species, across at least seven phyla, have been recorded (Fukushima et al. 2020), including across Internet-based trade listings in over 100 languages (Stringham et al. 2021). This global trade encompasses a range of iconic and lesser-known species from rhinoceros (Milliken 2014; Chanyandura et al. 2021) to bears (Cassey et al. 2021) and dried seahorses (Vincent et al. 2011; Boehm et al. 2023), in various forms and products, including live animals for pets to derivatives such as foodstuffs, medicine or trophies (Woodcock et al. 2023; Boratto et al. 2024). This is a major concern for species conservation and the agencies managing the protection, as illegal wildlife trade and smuggling are leading causes of biodiversity loss, with many species threatened with extinction due to overexploitation (Phelps et al. 2016). To support conservation efforts and combat illegal trade, the Convention on International Trade in Endangered Species of Wild Fauna and Flora (CITES) was established in 1975 (CITES 1973). CITES, currently encompassing 184 parties, is a legally binding international treaty established to ensure that international trade does not threaten the survival of wildlife and plants. CITES provides protection to 40,000+ species by regulating international trade through a licensing system and permits for export, re-export and import to ensure that trade is legal, sustainable and traceable. However, CITES applies only to international trade and does not govern domestic policies that remain under national jurisdiction.
Over one third of chondrichthyan species are currently threatened with extinction, with all threatened shark species also overfished (Dulvy et al. 2021). Chondrichthyan species, particularly elasmobranchs that include sharks and shark-like rays (i.e. Rhinopristiformes) (hereafter simply referred to as ‘shark’) are widely sought after for fins and many species are used for shark fin soup, a delicacy and status symbol primarily consumed in Southeast Asia (Clarke 2004; Cardeñosa et al. 2020). The fin trade is centred around Hong Kong and China (Dent and Clarke 2015; Jabado et al. 2015). The meat from shark species also provides an important source of protein in many countries (Clarke 2004; Booth et al. 2021) and while the global trade in shark meat has been steadily increasing since the early 2000s (Dent and Clarke 2015; Okes and Sant 2019), the trade of legally collected shark fins (i.e. where fins are landed with the body) has been decreasing (Okes and Sant 2019). Several factors have likely contributed to this reduction, including changes in social norms in key markets. For example, China has introduced restrictions on shark fin soup at official banquets and promoted efforts to reduce consumption at weddings (Dent and Clarke 2015). Another important influencing factor has been the introduction of regulations brought in to reduce the practice of finning (i.e. the act of cutting off a shark’s fins at sea and discarding the body back into the water) by enforcing the landing of individuals with ‘fins naturally attached’ (Dent and Clarke 2015). This approach facilitates species identification and may also have incentivised use of shark meat in some markets where this was previously limited. However, despite these efforts, the illegal trade and smuggling of fins from threatened species and illegally caught sharks is still widespread and often involves CITES-listed species (Asbury et al. 2021; Bonaccorso et al. 2021; Villate-Moreno et al. 2021). Overall, while regulatory changes have been introduced across shark fisheries, there have been minimal improvements to global shark mortality with overall mortality increasing between 2012 and 2019 (Worm et al. 2024).
A variety of methods can identify, quantify and track heavily traded products such as fins and meat through supply chains (Martins et al. 2018; Van Houtan et al. 2020; Cardeñosa et al. 2023). DNA barcoding has played a key role (Cruz et al. 2021; Cardeñosa et al. 2022; Drescher et al. 2022; Sharrad et al. 2023), particularly for detecting CITES-listed species (e.g. hammerheads Sphyrna spp. (Chapman et al. 2009) and threshers Alopias spp. (Cardeñosa et al. 2021)). These assessments of species availability serve as valuable proxies for trade volumes and are often compared to official trade volumes to inform estimates of illegal international trade (Agnew et al. 2009; Worm et al. 2013). With advances in identification techniques and the constant shifts in trade routes and international smuggling, research has branched out to search for the occurrence of threatened or illegal species using innovative tools such as eDNA (Lee et al. 2021; Prasetyo et al. 2023), real-time polymerase chaing reaction (Cardeñosa et al. 2018), machine learning algorithms (Barone et al. 2022) and monitoring of online trade (Pytka et al. 2023; Chakraborty et al. 2025). However, there is still sparse information on a variety of shark products and derivatives, including trophy items (e.g. preserved specimens, egg casings, skin or jaws) (Pytka et al. 2023) and the trade volumes, routes and key actors in global supply chains (Dent and Clarke 2015). Moreover, the role the demand for these commodities plays in driving shark trade remains generally overlooked.
Where studies have been conducted into assorted shark products, these are generally country-specific, and in recognised hubs of legal and illegal shark trade (Jabado et al. 2015; Hasan et al. 2017; Pytka et al. 2023). Therefore, broader patterns remain unclear, particularly outside the Middle East and Southeast Asia. Overall, wildlife trade involves multiple actors and here we investigate the role of two non-traditional wildlife trade countries, Australia and Aotearoa/New Zealand. Both nations are renowned for biosecurity and surveillance systems, including border and customs inspections of passengers at international borders, among other import/export controls and CITES related wildlife trade monitoring. However, the prominent shark fisheries (e.g. Southern and Eastern Scalefish and Shark Fishery), related exports (Dent and Clarke 2015; Okes and Sant 2019) and proximity to shark trade ‘hubs’ also raise concern about the potential for these nations to act as transit points. There are also suggestions that Australia may act as an intermediary stepping stone for the illegal export of wildlife products to Aotearoa/New Zealand (Alacs and Georges 2008; Wyatt 2013). While we lack information on shark products and derivatives, seizures by customs and biosecurity enforcement agencies highlight international smuggling and illegal trade, including of non-native species, among others (Alacs and Georges 2008; Cassey et al. 2021; Linacre 2021). Ultimately, this lack of understanding of transnational trade networks for shark products, including the origins, transit routes and destination markets, along with the role of non-source regions in shaping demand and trade dynamics, hinders our efforts to combat illegal practices, mitigate threats and support conservation measures.
We used border force and customs data on seized shark products at the Australian and Aotearoa/New Zealand borders to identify where shark products were most likely to originate from and whether there were any trends over time and between commodities. Specifically, we examined trends in seizures over time, the different commodities being seized, and patterns in the countries of origin and transit, including between Australia and Aotearoa/New Zealand. This comprehensive approach enabled us to explore potential illegal transnational trade links for shark commodities, identify potential gaps in border security and seizure reporting, and inform strategies to combat illegal shark product trade.
Materials and methods
Seizure data
Shark product seizure data, including relating to CITES listings, were obtained from the relevant reporting and conservation enforcement agency databases in Australia and Aotearoa/New Zealand, namely the Department of Agriculture, Water and Environment (Australia; 2009–2018), the Department of Home Affairs (Australia; 2009–2023) and the Ministry for Primary Industries (Aotearoa/New Zealand; 2009–2023). The term seizure is defined here as any product stopped at the border that had a case file opened, noting that not all of these incidents resulted in the item being permanently confiscated by customs officers. Datasets were compiled using searches for shark or elasmobranch products and included information on seizures from passenger arrivals into Australia and Aotearoa/New Zealand by flight and ship (e.g. personal luggage, concealed), and records for shark products that arrived unaccompanied by mail. All records were checked (N = 684) for potential extraneous or non-relevant materials (N = 19 removed) and duplicates in the datasets from the two Australian agencies were also removed (N = 97).
For the passenger seizure data, information from both countries included whether a product was declared and the outcome of the seizure. However, the actions and descriptors differed slightly between the two countries. For Australia, outcomes were either: (1) forfeited/disposed of; or (2) released back to the traveller for ‘Non-CITES’ or ‘Other’ reasons. For Aotearoa/New Zealand, outcomes were one of the following: (1) destroyed; (2) referred to ‘DOC’ (Department of Conservation) or ‘ACVM’ (Agricultural compounds and veterinary medicines); (3) treatment; (4) released to the passenger or ‘transit facility’; (5) held; or (6) not entered. Mail-inspected seizure data were available for Aotearoa/New Zealand only and the same outcomes described above apply to these data.
Information extracted included: the year of the seizure; the state (Australia only) or port of entry; the origin of the incident; the species seized (where available); and a description of the commodity. In the Australian dataset, origin information was divided into the country of last departure (i.e. where the item arrived into Australia from) and country of origin (i.e. country of export or production of the product). Commodity categories and information included broad to very detailed descriptions of the general item and were re-categorised into one of the following categories: fins, meat, trophy (e.g. preserved specimens, jaw/teeth, skin, egg casing) and others (e.g. medicine, liver products, cartilage, pet food) to facilitate comparison. For example, an entry initially categorised as ‘fin’ with no species information and a description that specified ‘Port Jackson shark egg casings’ was recategorised as trophy and the species information was added. Species-specific information was also extracted from the commodity descriptions where available. Data columns with missing information marked ‘NA’ were retained unless otherwise stated.
Statistical analysis
We analysed trends in seizures (i.e. commodity types, sources, quantity) over time for both countries. Negative binomial regressions were used to analyse trends in the count of seizure records over time for each country, accounting for the overdispersion in the data (i.e. where variance exceeds the mean) (Cassey et al. 2021). Logistic regressions were used to investigate any relationships between the seized commodity and (1) the declared status or (2) the processed status for Aotearoa/New Zealand passenger data. Overall, binary logistic regression models estimated the probability of an outcome based on commodity type (e.g. whether a commodity was declared or not). Independence of commodity type and origin location were assessed using contingency-type frequency tests. All analyses and visualisations were conducted using R ver. 4.2.0 (R Core Team 2021) and packages ‘lmtest’ (Zeileis and Hothorn 2002), ‘vcd’ (Zeileis et al. 2007; Meyer et al. 2020) and ‘tidyverse’ that includes ‘ggplot’ (Wickham et al. 2019). Additionally, the package ‘ggalluvial’ (Brunson and Read 2023) was used to create alluvial diagrams to show the trends in the flow of shark products from locations of origin and arrival in Australia and Aotearoa/New Zealand.
Results
Australia
We identified 278 records of shark products brought into Australia between 2009 and 2023 (14 years), with an average of 18 seizures per year but variations over time were high (standard error (s.e.) = 1.12). Overall, the number of records declined significantly over time (negative binomial regression; estimate = −0.25, s.e. = 0.02, z-value = −12.09, P = <0.001) from a peak of 56 in 2009 to minima of 0 in 2020 during the COVID-19 pandemic, followed by 3 and 2 seizure records for 2021 and 2022 respectively (Fig. 1a).
Bar plot displaying the number of seizure records from passenger flights coming into (a) Australia and (b) Aotearoa/New Zealand, and the number of mail-inspected seizures (c) arriving in Aotearoa/New Zealand between 2009 and 2022. Note: (a) excludes 22 records that did not include date information, records from 2023 were excluded from (a), (b) and (c) as the dataset for that year was incomplete; y-axis for (c) differs.
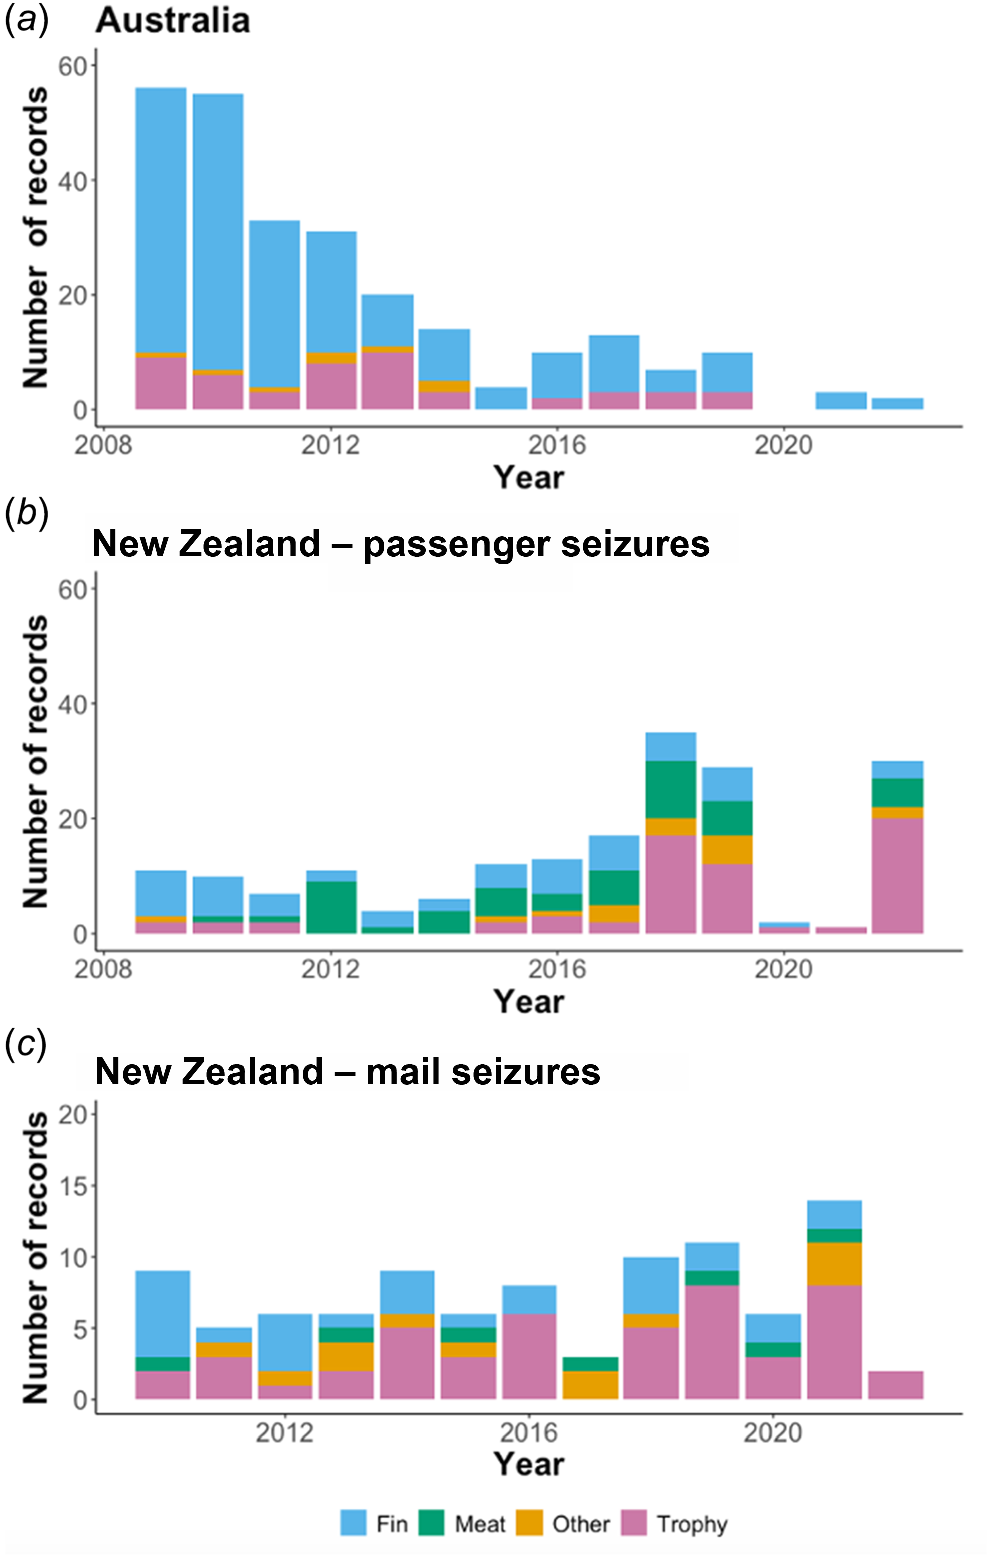
Fins were the most seized commodity encompassing 76% (210 out of 278 records) of all seizures, followed by trophies (n = 60) that were dominated by jaw and teeth products (n = 35), and preserved specimens (n = 16) (Fig. 1, Supplementary Table S1). Overall, most fin and trophy products were forfeited (77% (162 out of 210) and 63% (38 out of 60) respectively), with all cartilage, meat and medicine products forfeited. A significant portion of products was declared (74% (207 out of 278)), with the bulk of fin and trophy items declared (78% (163 out of 210) and 65% (39 out of 60) respectively), and nearly all preserved specimens (81% (13 out of 16)) declared. All cartilage and meat products were declared, compared with no declared medicine products. However, we found no significant relationship between commodity type and declaration status for forfeited products (logistic regression; estimate = 16.74, s.e. = 2.4e+1, z-value = 0.007, P = 0.994).
Only 18 records (0.06%) contained species information, with a further 2 having genus-level information and 6 with family level information (Table 1). The family Carcharhinidae was the most prominent, with 11 records. Overall, 14 out of 18 species documented were listed on a CITES Appendix, including all those in the Carcharhinus genus and iconic species such as the great white shark Carcharodon carcharias (Linnaeus, 1758) and the shortfin mako Isurus oxyrinchus (Rafinesque, 1810). However, only great white sharks and basking sharks Cetorhinus maximus (Gunnerus 1765) were CITES listed at the time of seizure, with all other species listed after the items were seized, with all species listed on CITES Appendix II. Half of the six C. carcharias and C. maximus products that were identified were forfeited while the remaining half were returned to the passengers.
| Species information | CITES Appendix | Date of listing | Number of seizures | ||
|---|---|---|---|---|---|
| AUS | AoNZ | ||||
| Carcharhinidae | |||||
| Carcharhinus brachyurus Bronze whaler shark | App II | 11/2023 | 2 | 0 | |
| Carcharhinus leucas Bull shark | App II | 11/2023 | 1 | 0 | |
| Carcharhinus melanopterus Blacktip reef shark | App II | 11/2023 | 1 | 0 | |
| Carcharhinus obscurus Dusky shark | App II | 11/2023 | 1 | 0 | |
| Carcharhinus plumbeus Sandbar shark | App II | 11/2023 | 1 | 0 | |
| Galeocerdo cuvier Tiger shark | Not listed | ––– | 2 | 0 | |
| Prionace glauca Blue shark | App II | 11/2023 | 1 | 0 | |
| Carcharhinus spp. (Requiem sharks) | App II | 11/2023 | 1 | 0 | |
| Carcharhinidae Requiem sharks | App II | 11/2023 | 3 | 0 | |
| Lamnidae | |||||
| Carcharodon carcharias Great white shark | App II | 01/2005 | 5 (4) | 1 (1) | |
| Isurus oxyrinchus Shortfin mako shark | App II | 11/2019 | 1 | 0 | |
| Isurus spp. Mako sharks | App II | 11/2019 | 1 | 1 | |
| Lamna ditropis Salmon shark | Not listed | ––– | 0 | 1 | |
| Cetorhinidae | |||||
| Cetorhinus maximus Basking shark | App II | 02/2003 | 1 (1) | 0 | |
| Heterodontidae | |||||
| Heterodontus portusjacksoni Port Jackson shark | Not listed | ––– | 1 | 0 | |
| Triakidae | |||||
| Mustelus antarcticus Gummy shark | Not listed | ––– | 1 | 0 | |
| Other | |||||
| Orectolobidae (Wobbegong sharks) | Not listed | ––– | 1 | 0 | |
| Sphyrna lewini, S. mokarran, S. zygaena Scalloped, Great and Smooth Hammerheads | App II | 09/2014 | 0 | 0 | |
| Sphyrnidae (all other Hammerhead sharks) | App II | 02/2023 | 2 | 0 | |
| Manta ray (species not specified) | App II | 09/2014 | 0 | 2 (2) | |
| Chondrichthyes (Sharks, skate, rays, chimeras) | ––– | ––– | 18 | 0 | |
| Lamniformes (Mackerel sharks) | ––– | ––– | 26 | 0 | |
| Sawshark (species not specified) | ––– | ––– | 0 | 1 | |
| Stingray (species not specified) | ––– | ––– | 2 | 1 | |
| No species information | ––– | ––– | 207 | 186 | |
Information includes whether the species is listed in a CITES Appendix (i.e. which Appendix (app) and the year listed if relevant), and the number of records for each species from Australia (AUS) and Aotearoa/New Zealand (AoNZ). Numbers in brackets represent the subset of total seizures that occurred after the listings. Note – within the family Sphyrnidae, three species were listed in 09/2014 (Sphyrna lewini, S. mokarran, S. zygaena).
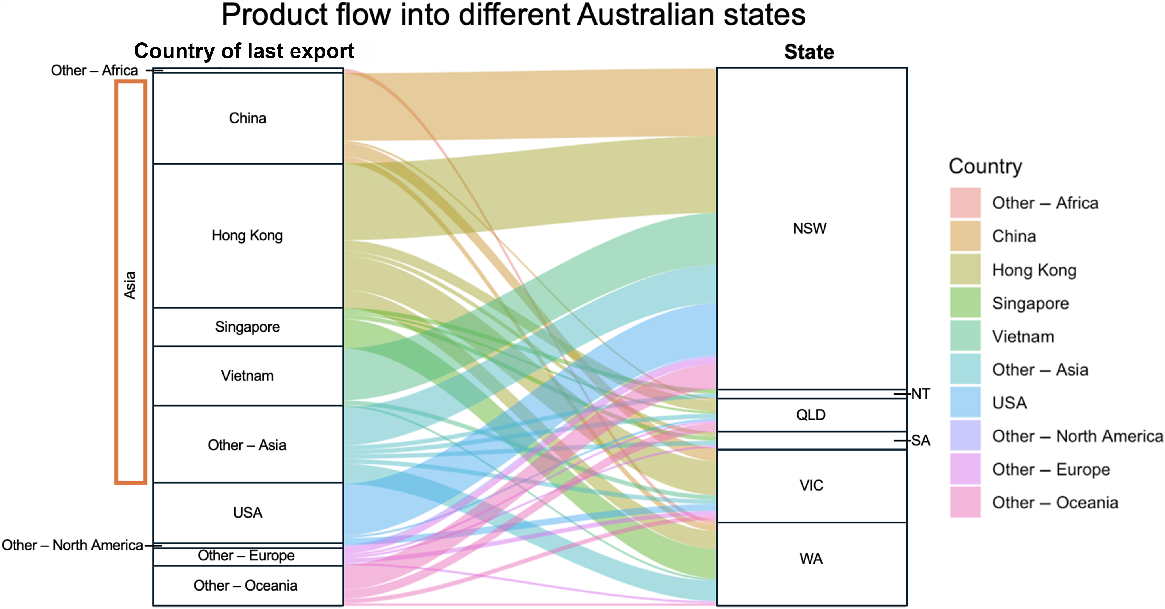
For seizures in Australia, 30 countries were identified as the country of last departure and origin (Fig. 2; Table S1). Over half the seizures came from five countries i.e. Hong Kong, China, Vietnam, USA and Singapore, with 62% of all seizures arriving from Asia (n = 173). However, most seizures (60%) did not have a declared country of origin for where the product was made (60% (168 of 278)). The top four countries of origin matched the top four countries of last departure (Hong Kong, China, Vietnam, USA). Only two products had different country of origin and last departure information, whereby these arrived from Singapore and Hong Kong but originated from Vietnam and China respectively (Supplementary Fig. S1). Only one type of commodity was seized from 19 countries, with 74% of these countries only having one record, while nine countries recorded seizures from at least two commodities.
Alluvial diagram showing the flow of shark products from the country of last export (origin of flight into Australia) and where these arrived in Australia (State). Where country of last export was unavailable, country of origin was used instead. This plot shows 238 incidents where shark products were stopped at the border and a case file was opened out of a total of 278 incidents. Incidents are not represented if these had missing information in both country of origin and country of last export, and arrival state into Australia. States and territories are: New South Wales (NSW), Northern Territory (NT), Queensland (QLD), South Australia (SA), Victoria (VIC) and Western Australia (WA). There were no seizures reported entering Tasmania.
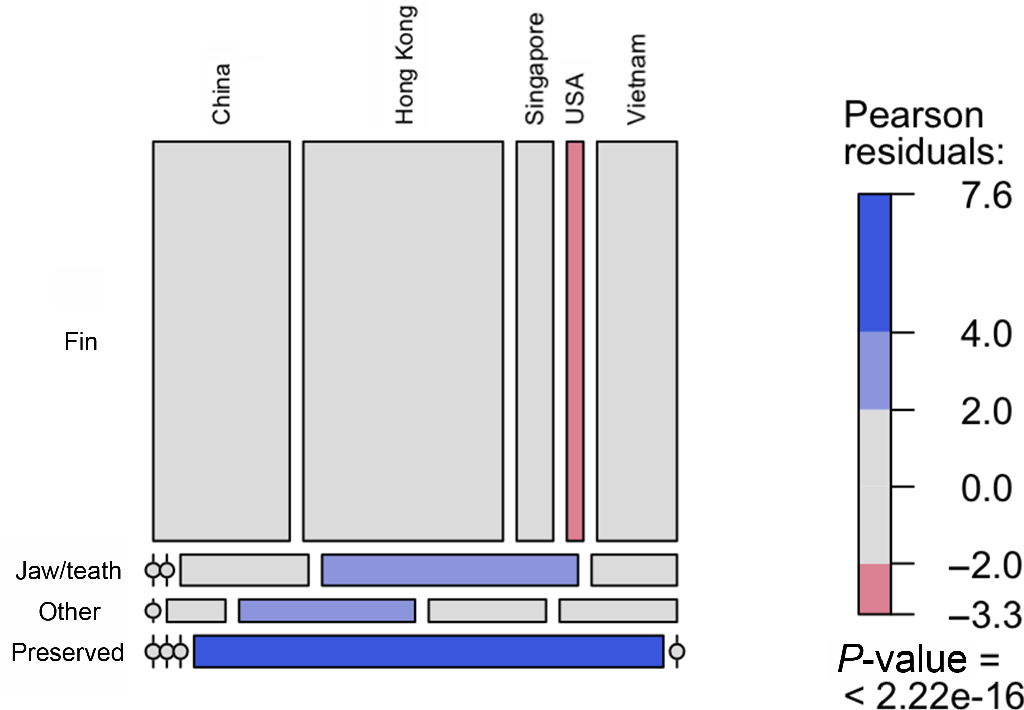
Relationships between commodity and origin country were generally not predictable but there were a few strong trends. The United States was more likely to be the origin of trophy items such as preserved specimens, and jaw and teeth products but was a less likely origin for fins. Singapore also showed a positive trend as the origin of other product types that predominantly encompassed cartilage tablets (Fig. 3).
Mosaic plot of proportional representation between the top four commodity types and the top five countries (country of origin) involved in Australian shark product seizures. Box size represents proportion of data. Colours represent significant Pearson’s residuals where the observed frequency is higher (blue) or lower (red) than expected by chance alone.
Seizure and attempted entry into Australia occurred largely in New South Wales (54%; 149 seizures), with Victoria and Western Australia the next most common states (43 and 39 seizures respectively). Only, 10% of seizures was recorded entering the remaining states with no records of shark products entering Tasmania. Overall, jaw and teeth products were the only commodity found in all represented states/territories.
Aotearoa/New Zealand
There was a total of 290 seizure records from Aotearoa/New Zealand between 2009 and 2023 (14 years) split into 193 passenger flight records and 97 mail-inspected records. In contrast to Australia, the number of passenger records oscillated showing no significant trend (negative binomial regression; estimate = 0.071, s.e. = 0.049, z-value = 1.424, P = 0.155) (Fig. 1b). However, there was a general decrease in seizures from 2009 to 2013 (except for 2012) and a subsequent steady increase until 2018 (maximum of 35 records) for passenger-related seizures. A major cutback in seizures followed in 2020 and 2021 (minimum of one record) during the COVID-19 pandemic but the numbers of seizures rapidly returned to pre-pandemic levels in 2022 (n = 30). Overall, there was an average of 13 seizures per year (s.e. = 0.77).
Trophies were the most seized commodity (34% (65 out of 193 records)), followed by fins (30%, n = 59) and meat (27%, n = 52) (Fig. 1, Table S2). Trophies were dominated by jaw and teeth products (n = 56). Most seizures were referred to another department (predominantly DOC) (79%; n = 153), with only 30 seizures resulting in the products being forfeited. A third of all meat products was forfeited (35% (18 out of 52)) but only a few trophy items and fins were forfeited (3 out of 65 and 7 out of 59 respectively). No significant relationships were found between commodity type, declaration status and the processing level of products forfeited (logistic regression; estimate = −3.09e+01, s.e. = 9.22e+03, z-value = −0.003, P = 0.997) or referred products (logistic regression; estimate = 3.26e+01, s.e. = 9.22e+03, z-value = 0.004, P = 0.997). Most records had no species information and out of the seven that did, two represented the CITES-listed species C. carcharias and Isurus spp., with both of these products referred to DOC (Table 1).
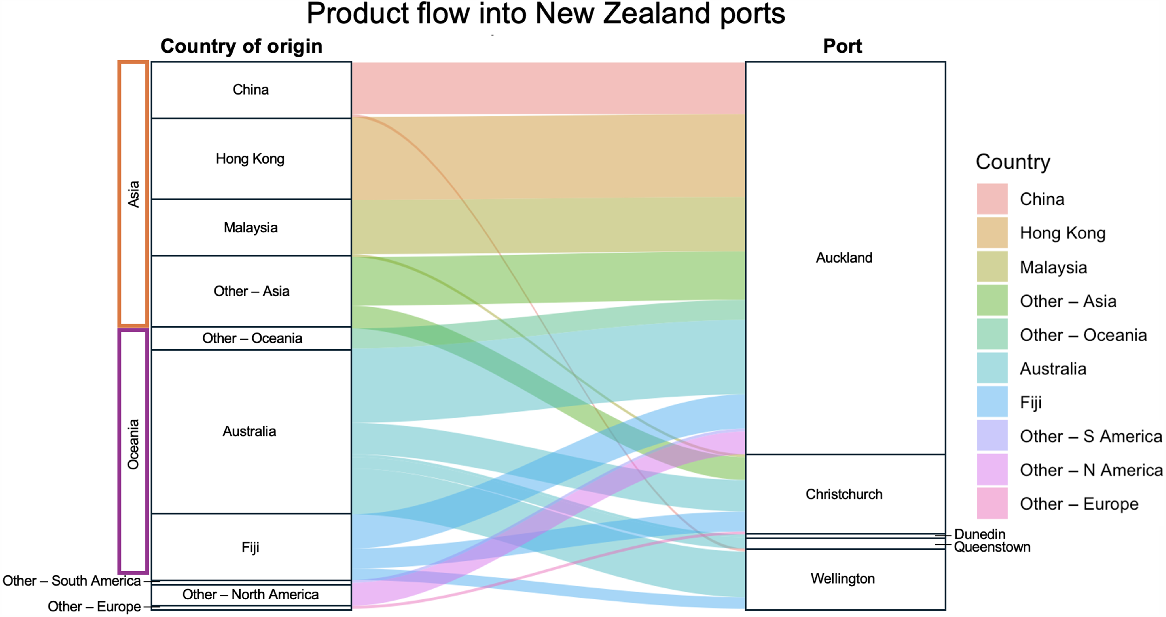
Shark products originated from 20 countries, though 5 countries dominated, with Australia, Hong Kong, Fiji, Malaysia and China representing 51% (n = 149) of the total (Fig. 4). Australia alone contributed 58 seizures, followed by Fiji (n = 23), with Indonesia, Cook Islands and Tonga the other Oceania sources (n = 88). The highest sources from Asia were Hong Kong, Malaysia and China (68 records out of a total of 93 from Asia). Only one type of commodity was seized from 11 countries, with 82% of these only having one record. A total of 72% (n = 139 out of 193) of seizures arrived in Auckland, with Australia being the only country of origin to have seizures at all ports.
Alluvial diagram showing the flow of products from the country of origin and the port at which these arrived in Aotearoa/New Zealand.
Independence tests showed that fins were most likely to originate from China and Hong Kong but not from Fiji. In contrast, jaw and teeth products were strongly linked with Fiji as the most likely origin. China, Hong Kong and Malaysia were less likely origins for jaw and teeth seizures, with only a small number of items but meat products were likely to originate from Malaysia. Overall, Australia was the most prominent country but did not show a clear relationship across commodity categories (Fig. 5a).
Mosaic plot of proportional representation between the top four commodity types and the top five countries involved in Aotearoa/New Zealand shark product seizures from (a) passenger data and (b) mail-inspected data. Box size represents proportion of data. Colours represent significant Pearson’s residuals where the observed frequency is higher (blue) or lower (red) than expected by chance alone.
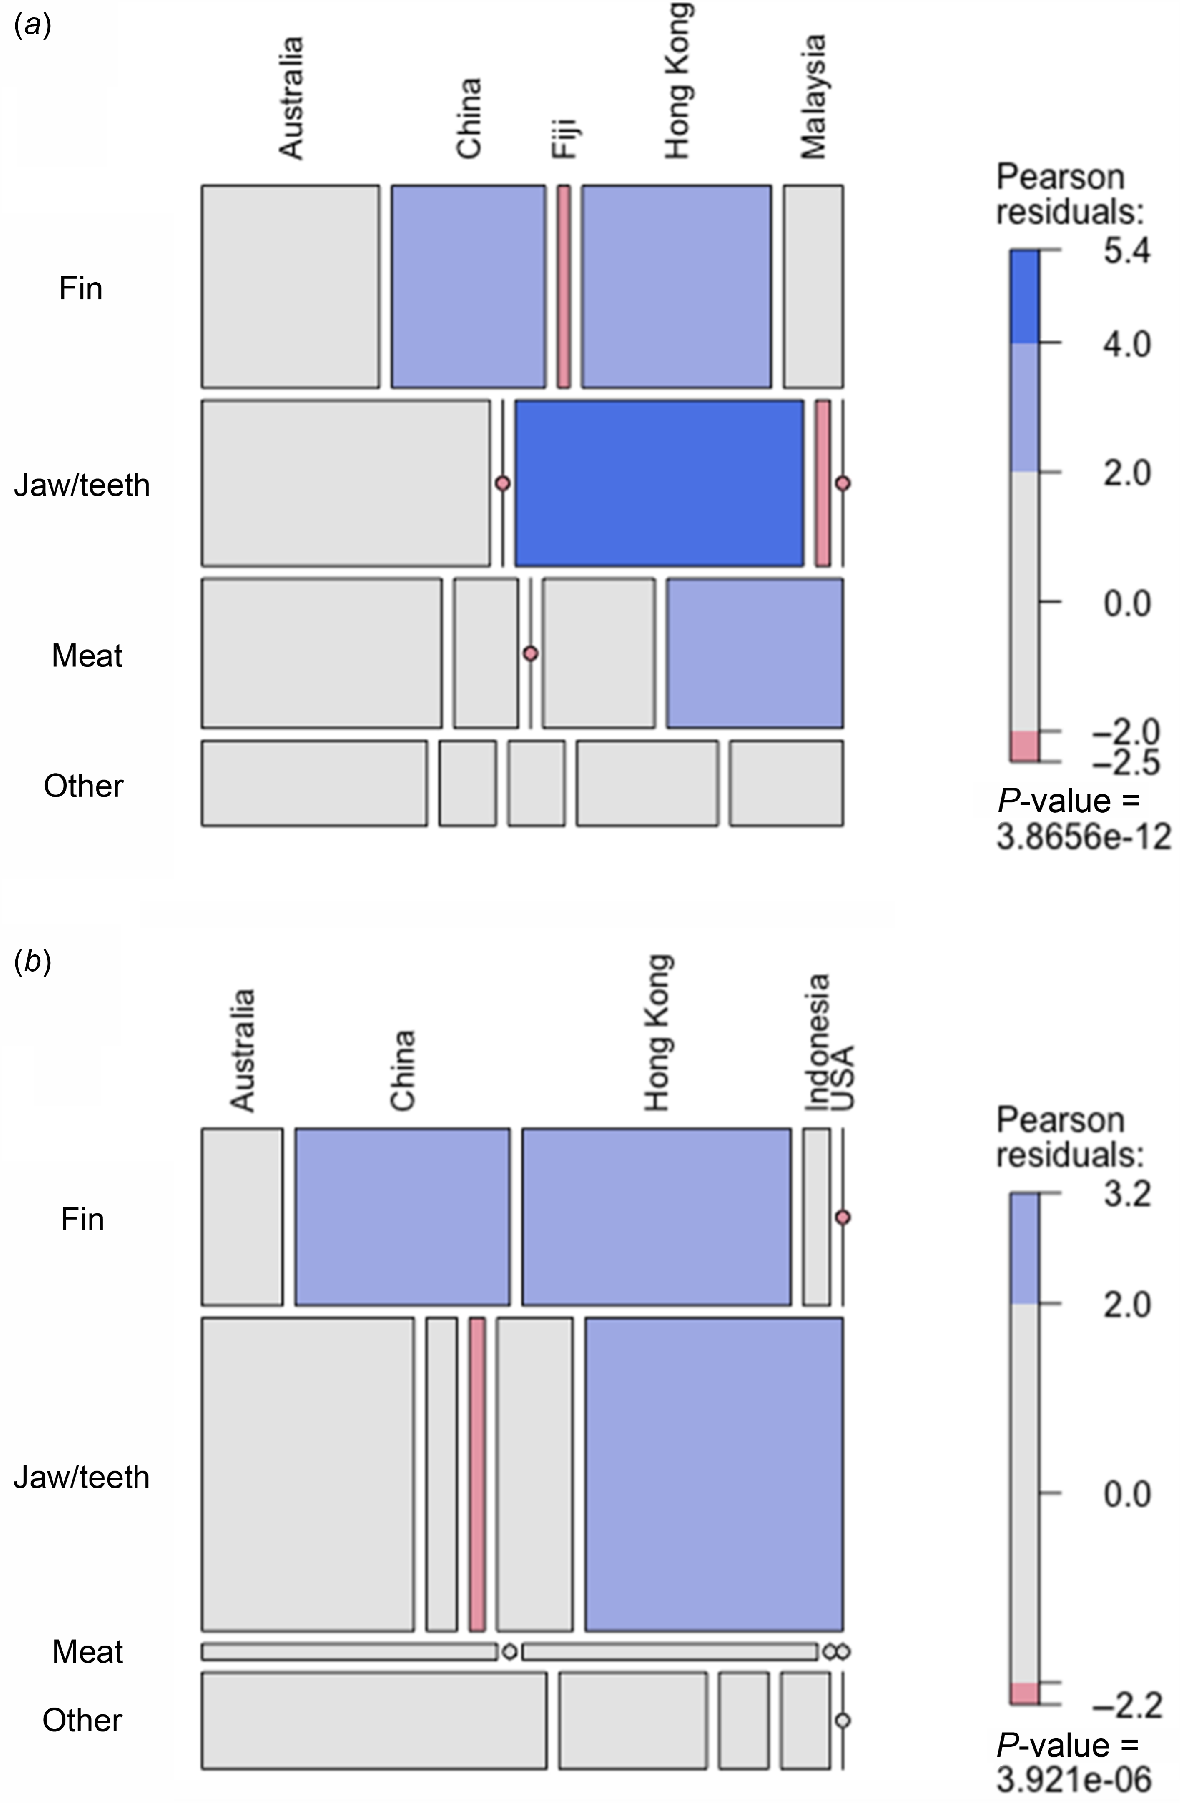
There was a total of 97 records of shark products arriving in Aotearoa/New Zealand via mail between 2009 and January 2023, with an average of 7 seizures per year (s.e. = 0.35). Seizures peaked in 2021 at 14 and were lowest at 2 in 2022 with no significant trend observed over time (negative binomial regression; estimate = −0.01, s.e. = 0.03, z-value = −0.358, P = 0.720) (Fig. 1c). Trophies were the most common products, encompassing half of all records (49 out of 97), followed by fins (n = 29) (see Table S3). Almost all trophy items were jaw and teeth products (n = 48). Overall, more than half the records were sent to the associated destination (n = 62), with a quarter of records referred to DOC (n = 26) and only nine records were forfeited. No significant relationships were found between seized commodity and declared status. Only 18 records (21%) included species information, namely 1 by common name, and others with information by genus (n = 8) or species level (n = 9). All seizures reported to species level corresponded to CITES-listed species (see Table S4). Of the three products from species listed at the time of inspection, two conformed and were sent on, while one was referred to DOC.
There were 16 countries of origin but four contributed the most seizures (n = 68 out of 97; Australia, USA, China and Hong Kong), similar to passenger seizures, with larger overall proportions of items seized from Asia (n = 43) and Oceania (n = 29). Only 1 type of commodity was seized from 11 countries, with 45% only having a single record, while 5 countries recorded seizures of at least 2 commodities.
Assessments of independence showed that China and Hong Kong were likely to be the points-of-origin for fin products, but jaw and teeth products were unlikely to come from Hong Kong (Fig. 5b). Conversely, the United States was more likely to be the source of jaw and teeth products but fin products were unlikely to originate there. Both Australia and Indonesia did not show relationships with any commodity. No port or arrival location information was available.
Discussion
Our results highlight a variety of shark products being carried in personal luggage and postage entering both Australia and Aotearoa/New Zealand, including clear patterns in trade flows between the two countries. Products were likely being transported for personal use, as trophies or for resale, with the influence of known processing and trading hubs evident. Products entering Australia predominantly came from Asia and the most seized commodity was fin products, aligning with the literature that suggests that East Asia, particularly Hong Kong and China, are the centre of shark fin processing and trade (Dent and Clarke 2015; Sadovy de Mitcheson et al. 2018). While Asia was also the most common region of origin for products entering Aotearoa/New Zealand, Oceania followed closely with Australia being the most dominant country of origin in both passenger and mail seizures. This was unexpected as Australian seizures showed a decline in the number of seizures over time while Aotearoa/New Zealand’s seizures increased. The occurrence of seizures from Australia may be due to Aotearoa/New Zealand’s geographic position and international flight connections. The connection between the two countries is emphasised by Aotearoa/New Zealand ranking as the top source of air and ship traffic into Australia in both 1999 and 2012 (Cope et al. 2016), and previous evidence of Australia being used as a ‘stepping stone’ for products entering Aotearoa/New Zealand (Alacs and Georges 2008).
Another layer of complexity in the relationship between Australia and Aotearoa/New Zealand is the inverse trends seen in seizure numbers over time. Both countries showed substantial drops in 2020 and 2021 that coincided with the global COVID-19 pandemic when both countries had severe border closures and heavy international travel restrictions. These restrictions reflected decreases in passenger arrivals into Australia (Australian Bureau of Statistics 2024) and Aotearoa/New Zealand (Stats NZ 2024) (e.g. from a total of 21.6 and 3.9 million in 2019 to 0.96 and 0.24 million during lockdowns in 2020–2021 respectively). As borders reopened, Australian seizure numbers remained low, while Aotearoa/New Zealand numbers increased to pre-COVID-19 pandemic levels, including products arriving from Australia. As Australia’s seizures declined over time there are a few reasons that may explain why the increase in seizures from Australia entering Aotearoa/New Zealand was observed. The first is that sharks are potentially being caught and products processed and/or purchased in Australia and taken to Aotearoa/New Zealand. Another possibility is that Australia is listed as the country of origin but is merely a stopover location for passengers travelling from elsewhere, and the transiting luggage is not being inspected until arriving at the final destination in Aotearoa/New Zealand. This may be of broader concern for CITES-regulated species, where this information should be included in export permits and where required, non-detriment finds that accompany the specimens (Mundy-Taylor et al. 2014). Australia has previously been identified as a stepping stone for products moving from elsewhere into Aotearoa/New Zealand in the case of dried seahorses that originated from China (Alacs and Georges 2008). Investigating alternative transport methods such as cargo shipping data could provide a window to further understand where shark products are being caught and processed.
The pattern in shark product seizure numbers in Australia and Aotearoa/New Zealand mirrors patterns observed for illegal bear trade (Cassey et al. 2021). This suggests that the downward trend of product seizures in Australia could be due to multiple factors, including a possible reduction in the trade. However, this could also be due to fewer inspections and a decrease in search effort by Australian border force officers. Similarly, the reduction in seizures observed in both countries during the COVID-19 pandemic could be due to the reduction in international travel but also reduced workforce capacity or a combination of both. Seizure of bear products entering Aotearoa/New Zealand fluctuated more than for products entering Australia (Cassey et al. 2021), complementing the varying but overall increasing trend patterns we observed for shark products (except for COVID-19 years).
Overall, New South Wales is the primary hub for international travel in Australia and with the largest number of international flights, had the most seizures. Conversely, international passengers travelling to other states such as South Australia, the Australian Capital Territory or Tasmania often transit through New South Wales or Victoria before continuing on domestic flights that may explain the lack or lower number of seizures that occurred in those states.
The lack of species information makes inferences on catch origin extremely difficult, however, there was one instance of a salmon shark Lamna ditropis (Hubbs and Follett 1947) product entering Aotearoa/New Zealand and this is a species not found in either Aotearoa/New Zealand or Australian waters. All other species that were declared can be found in Australian waters. The lack of species information across datasets matches general shark fisheries data where species are often grouped (Dent and Clarke 2015; Humane Society International Australia, Australian Marine Conservation Society, Environmental Defenders Office 2021) using harmonised system codes (Tlusty et al. 2024). This issue impedes conservation management of species and makes the monitoring of threatened species increasingly difficult. The absence of accurate species information is often impacted by the onboard processing of sharks that frequently removes features essential for accurate morphological identification such as the heads and fins (Cardeñosa et al. 2023). Seizures reflected ongoing trade of threatened and overexploited species, with items inspected due to concerns regarding potential CITES-listed species. However, items were usually returned without further adequate species information being provided or acquired. Considering the dramatic increase in Chondrichthyan species recently listed on CITES Appendix II, there is a clear need for better monitoring of this trade. Improvements to identification tools, including morphological guides or quick, cost effective molecular approaches could provide a vital boost for monitoring and ensuring that endangered species (Villate-Moreno et al. 2021), especially those listed on a CITES Appendix with international trade restrictions, are not being unknowingly traded. At the time of seizure, CITES-listed seizure records were notably limited to iconic great white sharks, basking sharks and mako sharks.
The limited species-specific details in the records is concerning. Even in what would typically be considered ‘data-rich’ countries with strong biosecurity programs, records were often incomplete. This underscores the challenges in other data-poor regions where monitoring, enforcement and data transparency are likely more limited. For example, in Southeast Asia, these challenges may be further compounded by the unique elasmobranch diversity (Kyne and Jabado 2022), data availability and regulatory oversight (Pytka et al. 2023). To complement the information collated here from border seizures, further efforts could use information from alternative data sources such as shipping manifests, fisheries records, commercial import/export records and potentially interviews with key stakeholders across the supply chain.
In Australia, there was a clear indication that trophy items originated from the USA, suggesting that the USA may be a key producer and/or processor of these items. Conversely, this role was filled by Fiji in the Aotearoa/New Zealand dataset, with an overall higher representation from smaller Oceania countries such as Tonga and the Cook Islands likely due to Auckland being a key link within Oceania for international travel (Statistics New Zealand 2024). These trends between countries and commodities can potentially highlight some drivers and demands that may not be entirely expected or attainable from looking at fishery trade, and providing insights into possible trade routes. The seizures we report are notably the minimum for the time period, as we did not include seizures described as unknown, despite potentially containing records of shark or related products. Both Australia and Aotearoa/New Zealand are island nations praised for biosecurity screening and border security (Brenton-Rule et al. 2016), with this dataset providing an opportunity to study island nation trade dynamics for sharks and related species. While the data provided here are considered good and relatively complete, acknowledging that wildlife seizures are an important part of our understanding but will never provide a full picture of illicit wildlife trade due to the complex and changing nature of the trade (Clarke et al. 2018) is important. The high proportions of shark trophies seized in Australia and Aotearoa/New Zealand is likely to differ from other contexts, for example compared with countries more heavily involved in fin or meat trade (Almerón-Souza et al. 2018; Cardeñosa et al. 2022) but reinforces the need for a stronger global focus on this trade.
While there is a clear consumer trade route between Australia and Aotearoa/New Zealand, further investigation of export and import records from a broader range of wildlife products would allow for clarification of the occurrence of these patterns among different commodities. This would also provide a clearer picture of the overarching illegal wildlife trade that occurs between Australia and Aotearoa/New Zealand and information about the role that these countries may play in broader global trade.
Data availability
The data that support this study were obtained from the Australian Government Department of Home Affairs and Biosecurity New Zealand by permission. Data will be shared upon reasonable request to the corresponding author with permission from the Australian Government Department of Home Affairs and Biosecurity New Zealand.
Declaration of funding
JL was supported by an Australian Government Research Training Program Scholarship through the University of Adelaide. PC is an Australian Research Industry Laureate Fellow ‘Combatting Wildlife Crime and Preventing Environmental Harm’ (IL230100175).
Author contributions
JL – Investigation, data curation, visualisation, writing – original draft, review and editing. PRS – Conceptualisation, investigation, funding acquisition, supervision, writing – review and editing. PC – Conceptualisation, writing – review and editing. BMG – Conceptualisation, funding acquisition, supervision, writing – review and editing.
Acknowledgements
The authors acknowledge the CITES Management and Enforcement Authorities in Australia and Aotearoa/New Zealand, the Department of Home Affairs and Border Force in Australia, and the Ministry for Primary Industries in Aotearoa/New Zealand for assisting in the collection and curation of seizure and enforcement data. Particular thanks to Vythees (Department of Home Affairs, Australia), Jo Beath (Department of Agriculture, Water and Environment, Australia), Andrew Spelman (Ministry for Primary Industries, New Zealand) and Dylan Swain (Department of Conservation, New Zealand) for facilitating provision of CITES seizure datasets. The authors thank Oliver Stringham for discussions on accessing information. The authors acknowledge the Indigenous Traditional Owners of the land on which the University of Adelaide is built, the Kaurna peoples of the Adelaide Plains.
References
Agnew DJ, Pearce J, Pramod G, Peatman T, Watson R, Beddington JR, Pitcher TJ (2009) Estimating the worldwide extent of illegal fishing. PLoS ONE 4, e4570.
| Crossref | Google Scholar | PubMed |
Alacs E, Georges A (2008) Wildlife across our borders: a review of the illegal trade in Australia. Australian Journal of Forensic Sciences 40(2), 147-160.
| Crossref | Google Scholar |
Almerón-Souza F, Sperb C, Castilho CL, Figueiredo PICC, Gonçalves LT, Machado R, Oliveira LR, Valiati VH, Fagundes NJR (2018) Molecular identification of shark meat from local markets in Southern Brazil based on DNA barcoding: evidence for mislabeling and trade of endangered species. Frontiers in Genetics 9, 138.
| Crossref | Google Scholar | PubMed |
Asbury TA, Bennett R, Price AS, Da Silva C, Bürgener M, Klein JD, Maduna SN, Sidat N, Fernando S, Bester-van der Merwe AE (2021) Application of DNA mini-barcoding reveals illegal trade in endangered shark products in southern Africa. African Journal of Marine Science 43(4), 511-520.
| Crossref | Google Scholar |
Australian Bureau of Statistics (2024) Overseas arrivals and departures. Available at https://www.abs.gov.au/statistics/industry/tourism-and-transport/overseas-arrivals-and-departures-australia/latest-release [accessed 20 March 2024]
Barone M, Mollen FH, Giles JL, Marshall LJ, Villate-Moreno M, Mazzoldi C, Pérez-Costas E, Heine J, Guisande C (2022) Performance of iSharkFin in the identification of wet dorsal fins from priority shark species. Ecological Informatics 68, 101514.
| Crossref | Google Scholar |
Boehm JT, Bovee E, Harris SE, Eddins K, Akahoho I, Foster M, Pell SK, Hickerson MJ, Amato G, DeSalle R, Waldman J (2023) The United States dried seahorse trade: a comparison of traditional Chinese medicine and ecommerce-curio markets using molecular identification. PLoS ONE 18, e0291874.
| Crossref | Google Scholar | PubMed |
Bonaccorso E, Ordóñez-Garza N, Pazmiño DA, Hearn A, Páez-Rosas D, Cruz S, Muñoz-Pérez JP, Espinoza E, Suárez J, Muñoz-Rosado LD, Vizuete A, Chaves JA, Torres MdL, Bustos W, Rueda D, Hirschfeld M, Guayasamin JM (2021) International fisheries threaten globally endangered sharks in the Eastern Tropical Pacific Ocean: the case of the Fu Yuan Yu Leng 999 reefer vessel seized within the Galápagos Marine Reserve. Scientific Reports 11, 14959.
| Crossref | Google Scholar | PubMed |
Booth H, Chaya F, Ng S, Tan V, Rao M, Teepol B, Matthews E, Lim A, Gumal M (2021) Elasmobranch fishing and trade in Sarawak, Malaysia, with implications for management. Aquatic Conservation: Marine and Freshwater Ecosystems 31(11), 3056-3071.
| Crossref | Google Scholar |
Boratto R, Porter AA, Shepherd CR (2024) Canada’s role in global wildlife trade: research trends and next steps. European Journal of Wildlife Research 70, 12.
| Crossref | Google Scholar |
Brenton-Rule E, Frankel S, Lester P (2016) Improving management of invasive species: New Zealand’s approach to pre- and post-border pests. Policy Quarterly 12(1), 17-25.
| Crossref | Google Scholar |
Cardeñosa D, Quinlan J, Shea KH, Chapman DD (2018) Multiplex real-time PCR assay to detect illegal trade of CITES-listed shark species. Scientific Reports 8, 16313.
| Crossref | Google Scholar |
Cardeñosa D, Shea KH, Zhang H, Feldheim K, Fischer GA, Chapman DD (2020) Small fins, large trade: a snapshot of the species composition of low-value shark fins in the Hong Kong markets. Animal Conservation 23(2), 203-211.
| Crossref | Google Scholar |
Cardeñosa D, Fields AT, Shea SKH, Feldheim KA, Chapman DD (2021) Relative contribution to the shark fin trade of Indo-Pacific and Eastern Pacific pelagic thresher sharks. Animal Conservation 24(3), 367-372.
| Crossref | Google Scholar |
Cardeñosa D, Shea SK, Zhang H, Fischer GA, Simpfendorfer CA, Chapman DD (2022) Two thirds of species in a global shark fin trade hub are threatened with extinction: conservation potential of international trade regulations for coastal sharks. Conservation Letters 15, e12910.
| Crossref | Google Scholar |
Cardeñosa D, Robles YL, Ussa DA, Del Valle CM, Caballero S, Chapman DD (2023) Pre-export shark fin processing to conceal CITES-listed species: a case-study from a shark fin seizure in Colombia. Animal Conservation 26(6), 781-788.
| Crossref | Google Scholar |
Cassey P, Gomez L, Heinrich S, García-Díaz P, Stoner S, Shepherd CR (2021) Bearing all down under: the role of Australasian countries in the illegal bear trade. Pacific Conservation Biology 28(6), 472-480.
| Crossref | Google Scholar |
Chakraborty S, Roberts SN, Petrossian GA, Sosnowski M, Freire J, Jacquet J (2025) Prevalence of endangered shark trophies in automated detection of the online wildlife trade. Biological Conservation 304, 110992.
| Crossref | Google Scholar |
Chanyandura A, Muposhi VK, Gandiwa E, Muboko N (2021) An analysis of threats, strategies, and opportunities for African rhinoceros conservation. Ecology and Evolution 11(11), 5892-5910.
| Crossref | Google Scholar | PubMed |
Chapman DD, Pinhal D, Shivji MS (2009) Tracking the fin trade: genetic stock identification in western Atlantic scalloped hammerhead sharks Sphyrna lewini. Endangered Species Research 9, 221-228.
| Crossref | Google Scholar |
Clarke S (2004) Understanding pressures on fishery resources through trade statistics: a pilot study of four products in the Chinese dried seafood market. Fish and Fisheries 5(1), 53-74.
| Crossref | Google Scholar |
Clarke S, Stenekes N, Kancans R, Woodland C, Robinson A (2018) Undelivered risk: a counter-factual analysis of the biosecurity risk avoided by inspecting international mail articles. NeoBiota 40, 73-86.
| Crossref | Google Scholar |
Cope RC, Ross JV, Wittmann TA, Prowse TA, Cassey P (2016) Integrative analysis of the physical transport network into Australia. PLoS ONE 11, e0148831.
| Crossref | Google Scholar | PubMed |
Cruz MM, Szynwelski BE, De Freitas TRO (2021) Biodiversity on sale: the shark meat market threatens elasmobranchs in Brazil. Aquatic Conservation: Marine and Freshwater Ecosystems 31(12), 3437-3450.
| Crossref | Google Scholar |
Drescher L, Heng NJK, Chin MY, Karve NRO, Cheung EJW, Kurniadi A, Urera MQ, Waldeck FG, Dharshini U, Hoe NTE, Choo JSY, Lok RFJ, Kibat C, Wainwright BJ (2022) Blood in the water: DNA barcoding of traded shark fins in Singapore. Frontiers in Marine Science 9, 907714.
| Crossref | Google Scholar |
Dulvy NK, Pacoureau N, Rigby CL, Pollom RA, Jabado RW, Ebert DA, Finucci B, Pollock CM, Cheok J, Derrick DH, Herman KB, Sherman CS, VanderWright WJ, Lawson JM, Walls RHL, Carlson JK, Charvet P, Bineesh KK, Fernand D, Ralph GM, Matsushiba JH, Hilton-Taylor C, Fordham SV, Simpfendorfer CA (2021) Overfishing drives over one-third of all sharks and rays toward a global extinction crisis. Current Biology 31(21), 4773-4787.e8.
| Crossref | Google Scholar |
Fukushima CS, Mammola S, Cardoso P (2020) Global wildlife trade permeates the Tree of Life. Biological Conservation 247, 108503.
| Crossref | Google Scholar | PubMed |
Harfoot M, Glaser SAM, Tittensor DP, Britten GL, McLardy C, Malsch K, Burgess ND (2018) Unveiling the patterns and trends in 40 years of global trade in CITES-listed wildlife. Biological Conservation 223, 47-57.
| Crossref | Google Scholar |
Hasan M, Nazru KMS, Rashed Parvej M, Alam Patwary MS, Uddin AMMB (2017) Shark and shark products trade channel and its conservation aspects in Bangladesh. Journal of Fisheries & Livestock Production 5, 221.
| Crossref | Google Scholar |
Jabado RW, Al Ghais SM, Hamza W, Henderson AC, Spaet JLY, Shivji MS, Hanner RH (2015) The trade in sharks and their products in the United Arab Emirates. Biological Conservation 181, 190-198.
| Crossref | Google Scholar |
Kyne PM, Jabado RW (2022) Most rhino rays (sawfishes, wedgefishes, giant guitarfishes, guitarfishes, banjo rays) are threatened with extinction. In ‘Imperiled: the encyclopedia of conservation.’ (Eds DA DellaSala, MI Goldstein) pp. 763–772. (Elsevier: Oxford) 10.1016/B978-0-12-821139-7.00118-5
Lee H-T, Liao C-H, Hsu T-H (2021) Environmental DNA (eDNA) Metabarcoding in the fish market and nearby seafood restaurants in Taiwan reveals the underestimation of fish species diversity in seafood. Biology 10(11), 1132.
| Crossref | Google Scholar | PubMed |
Linacre A (2021) Wildlife crime in Australia. Emerging Topics in Life Sciences 5(3), 487-494.
| Crossref | Google Scholar |
Martins APB, Feitosa LM, Lessa RP, Almeida ZS, Heupel M, Silva WM, Tchaicka L, Nunes JLS (2018) Analysis of the supply chain and conservation status of sharks (Elasmobranchii: Superorder Selachimorpha) based on fisher knowledge. PLoS ONE 13, e0193969.
| Crossref | Google Scholar | PubMed |
Meyer D, Zeileis A, Hornik K (2020) vcd: visualizing categorical data. Available at https://rdrr.io/cran/vcd/
Mundy-Taylor V, Crook V, Foster F, Fowler S, Sant G, Rice J (2014) CITES non-detriment findings guidance for shark species (2nd, revised version). A framework to assist authorities in making non-detriment findings (NDFs) for species listed in CITES Appendix II. Report prepared for the Germany Federal Agency for Nature Conservation (Bundesamt für Naturschutz, BfN).
Phelps J, Biggs D, Webb EL (2016) Tools and terms for understanding illegal wildlife trade. Frontiers in Ecology and the Environment 14(9), 479-489.
| Crossref | Google Scholar |
Prasetyo AP, Murray JM, Kurniawan MFAK, Sales NG, McDevitt AD, Mariani S (2023) Shark-dust: application of high-throughput DNA sequencing of processing residues for trade monitoring of threatened sharks and rays. Conservation Letters 16(5), e12971.
| Crossref | Google Scholar |
Pytka JM, Moore ABM, Heenan A (2023) Internet trade of a previously unknown wildlife product from a critically endangered marine fish. Conservation Science and Practice 5(3), e12896.
| Crossref | Google Scholar |
Sadovy de Mitcheson Y, Andersson AA, Hofford A, Law CSW, Hau LCY, Pauly D (2018) Out of control means off the menu: the case for ceasing consumption of luxury products from highly vulnerable species when international trade cannot be adequately controlled; shark fin as a case study. Marine Policy 98, 115-120.
| Crossref | Google Scholar |
Sharrad AE, Reis-Santos P, Austin J, Gillanders BM (2023) Umbrella terms conceal the sale of threatened shark species: a DNA barcoding approach. Food Control 148, 109606.
| Crossref | Google Scholar |
Stats NZ (2024) Tourism. Available at https://www.stats.govt.nz/topics/tourism [accessed 20 March 2024]
Stringham OC, Moncayo S, Thomas E, Heinrich S, Toomes A, Maher J, Hill KGW, Mitchell L, Ross JV, Shepherd CR, Cassey P (2021) Dataset of seized wildlife and their intended uses. Data in Brief 39, 107531.
| Crossref | Google Scholar | PubMed |
Tlusty MF, Cassey P, Rhyne AL, Omrow DA, Stoett P (2024) Species-level, digitized wildlife trade data are essential for achieving biodiversity targets. Proceedings of the National Academy of Sciences 121, e2306869121.
| Crossref | Google Scholar |
‘t Sas-Rolfes M, Challender DWS, Hinsley A, Veríssimo D, Milner-Gulland EJ (2019) Illegal wildlife trade: scale, processes, and governance. Annual Review of Environment and Resources 44, 201-228.
| Crossref | Google Scholar |
Van Houtan KS, Gagne TO, Reygondeau G, Tanaka KR, Palumbi SR, Jorgensen SJ (2020) Coastal sharks supply the global shark fin trade. Biology Letters 16, 20200609.
| Crossref | Google Scholar | PubMed |
Villate-Moreno M, Pollerspöck J, Kremer-Obrock F, Straube N (2021) Molecular analyses of confiscated shark fins reveal shortcomings of CITES implementations in Germany. Conservation Science and Practice 3(6), e398.
| Crossref | Google Scholar |
Wickham H, Averick M, Bryan J, Chang W, McGowan L, François R, Grolemund G, Hayes A, Henry L, Hester J, Kuhn M, Pedersen T, Miller E, Bache S, Müller K, Ooms J, Robinson D, Seidel D, Spinu V, Takahashi K, Vaughan D, Wilke C, Woo K, Yutani H (2019) Welcome to the tidyverse. Journal of Open Source Software 4(43), 1686.
| Crossref | Google Scholar |
Woodcock L, Gooch J, Wolff K, Daniel B, Frascione N (2023) Fingermarks in wildlife forensics: a review. Forensic Science International 350, 111781.
| Crossref | Google Scholar | PubMed |
Worm B, Davis B, Kettemer L, Ward-Paige CA, Chapman D, Heithaus MR, Kessel ST, Gruber SH (2013) Global catches, exploitation rates, and rebuilding options for sharks. Marine Policy 40, 194-204.
| Crossref | Google Scholar |
Worm B, Orofino S, Burns ES, D’Costa NG, Feitosa LM, Palomares MLD, Schiller L, Bradley D (2024) Global shark fishing mortality still rising despite widespread regulatory change. Science 383, 225-230.
| Crossref | Google Scholar | PubMed |
Zeileis A, Hothorn T (2002) Diagnostic checking in regression relationships. R News 2, 7-10.
| Google Scholar |
Zeileis A, Meyer D, Hornik K (2007) Residual-based shadings for visualizing (conditional) independence. Journal of Computational and Graphical Statistics 16(3), 507-525.
| Crossref | Google Scholar |