

Risk assessment for wildland fire aerial detection patrol route planning in Ontario, Canada
Colin B. McFayden A G , Douglas G. Woolford B , Aaron Stacey C , Den Boychuk D , Joshua M. Johnston E , Melanie J. Wheatley A and David L. Martell FA Ontario Ministry of Natural Resources and Forestry, Aviation, Forest Fire and Emergency Services, Dryden Fire Management Centre, 95 Ghost Lake Road, PO Box 850, Dryden, ON P2N 2Z5, Canada.
B Department of Statistical and Actuarial Sciences, University of Western Ontario, 1151 Richmond Street, London, ON N6A 5B7, Canada.
C Ontario Ministry of Natural Resources and Forestry, Aviation, Forest Fire and Emergency Services, 300 Water Street, South Tower, Peterborough, ON K9J 3C7, Canada.
D Ontario Ministry of Natural Resources and Forestry, Aviation, Forest Fire and Emergency Services, 400–70 Foster Drive, Sault Ste Marie, ON P6A 6V5, Canada.
E Canadian Forest Service, Great Lakes Forestry Centre, 1219 Queen Street E, Sault Ste Marie, ON P6A 2E5, Canada.
F Faculty of Forestry, University of Toronto, 33 Willcocks Street, Toronto, ON M5S 3B3, Canada.
G Corresponding author: Email: colin.mcfayden@ontario.ca
International Journal of Wildland Fire 29(1) 28-41 https://doi.org/10.1071/WF19084
Submitted: 9 June 2019 Accepted: 23 October 2019 Published: 5 December 2019
Journal Compilation © IAWF 2020 Open Access CC BY-NC-ND
Abstract
This study presents a model developed using a risk-based framework that is calibrated by experts, and provides a spatially explicit measure of need for aerial detection daily in Ontario, Canada. This framework accounts for potential fire occurrence, behaviour and impact as well as the likelihood of detection by the public. A three-step assessment process of risk, opportunity and tolerance is employed, and the results represent the risk of not searching a specified area for the detection of wildland fires. Subjective assessment of the relative importance of these factors was elicited from Ontario Ministry of Natural Resources and Forestry experts to develop an index that captures their behaviour when they plan aerial detection patrol routes. The model is implemented to automatically produce a province-wide, fine-scale risk index map each day. A retrospective analysis found a statistically significant association between points that aerial detection patrols passed over and their aerial detection demand index values: detection patrols were more likely to pass over areas where the index was higher.
Additional keywords: decision-making, decision support systems, forest fire detection, uncertainty, wildfire detection.
Introduction
Early detection of wildland fires while small is essential. They are less likely to escape control efforts, reducing socioeconomic impacts and lowering suppression costs (Kourtz 1987, 1994; Hirsch et al. 1998; Cumming 2005; Arienti et al. 2006; Martell and Sun 2008). Climate change is forecast to increase fire occurrence (Woolford et al. 2014) and area burned in Ontario (Podur and Wotton 2010), which will lead to an increased demand for early detection.
We develop a risk-based spatially explicit aerial detection demand index. This index incorporates key factors that drive aerial detection patrol routeing: potential fire occurrence, fire behaviour and impacts on resources and assets. Risk, opportunity, tolerance and the probability of fires being detected by the public are also incorporated in this index. The relative importance of the factors that are included in the aerial detection demand index (ADDI) was elicited from experienced fire management staff.
Background
Wildland fire management agencies employ both direct and indirect detection systems. Direct detection agents actively search for fires at specific times and specified locations by, for example, staffing lookout towers and flying aerial detection patrols. Indirect detection is passive whereby information regarding newly discovered fires is received as a result of other activities, such as reports from the public or suppression staff travelling in aircraft. Fire managers actively influence and support indirect detection systems by maintaining and publicising public reporting hotlines and by training firefighters to remain vigilant and report new fires they discover in the course of their work (Thomas and McAlpine 2010; Johnston et al. 2018).
The term ‘detection demand’ was described by Kourtz (1973), as the number of fires burning undetected in an area, with more fires representing a greater need to view an area to detect fires. Kourtz (1973) developed a dynamic programming model to specify a patrol route for a high-level infrared aircraft that would maximise the expected number of fires detected given several factors including aircraft range, cloud coverage and the prediction of the expected number of fires burning undetected. The requirement for routeing detection aircraft was again outlined by Kourtz (1994) in the Province of Quebec, where the factors thought to be important to determine the number of patrols over each cell were the predicted number of fires, their predicted rates of spread, fire intensity and values at risk.
Recent detection studies have focused on the use and performance of new technology, for example remote sensing (e.g. Allison et al. 2016; Halle et al. 2018; Johnston et al. 2018), image processing (e.g. Schroeder 2004), distributed sensor networks (e.g. Alkhatib 2014), unmanned aviation systems (UAS) and others (Yuan et al. 2015). Advanced fire monitoring satellite systems are emerging (e.g. Halle et al. 2018), like aerial patrols, require dynamic spatial prioritising for deployment and sensor targeting and could eventually be viewed as direct detection. However, there are gaps in the needs of fire management and the decision support available (Martell 2011; Duff and Tolhurst 2015), including how to deploy a dynamic, direct fire detection system such as aerial detection.
Wildland fire and detection in Ontario, Canada
The Ontario Ministry of Natural Resources and Forestry (OMNRF) is responsible for detecting and responding to wildland fires over an area of ~107 million ha (OMNRF 2014) where there is high variability in weather, fire occurrence and area burned, both daily and seasonally. Historically, there are fewer than 18 active fires burning on 50% of days and more than 192 active fires on 2% of days during the fire season (April–October).
In the sparsely populated areas of northern Ontario, fire detection is carried out primarily by indirect means (e.g. commercial and recreational aircraft). Direct detection takes place over the remaining ~63 million ha where there is a heavy amount of wildland–urban interface and forest that is managed for timber production and other resources (Fig. 1). Approximately 12% of recent fires in the province of Ontario were found by direct detection (patrol aircraft), and the remaining 88% were found through indirect methods, namely 40% by OMNRF staff carrying out suppression activities and 49% reported by the public (Table 1).

|

|
Not all wildland fires are aggressively suppressed in Ontario. The OMNRF’s Wildland Fire Management Strategy (OMNRF 2014) calls for an ‘appropriate response’ for wildland fire that should minimise the expected total cost plus net loss while accounting for other factors (Boychuk and McFayden 2017). Some fires can therefore be left to be monitored because the benefits (e.g. ecological impact of fire) outweigh the losses (the negative impacts). However, there is a time window during which a fire can be successfully contained before it becomes too active or large for successful suppression (Parks 1964), necessitating the need for early or small detection of fires to support appropriate response decision-making.
Hundreds of fire lookout towers once dotted Ontario’s landscape. The decommissioning of these towers started in the 1960s. They were eventually replaced with the more cost-effective aerial detection program (Eno n.d.; Foster 1962; Kourtz 1987). Several Canadian forest fire management agencies still use towers, aircraft, or a mix of both (e.g. Schroeder 2004; Thomas and McAlpine 2010).
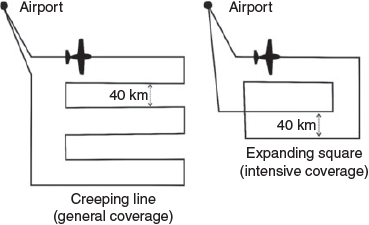
The OMNRF currently charters a fleet of 10 detection patrol aircraft (Cessna Skymaster 337), each of which are staffed with a pilot and detection observer to provide direct detection for the 63-million-ha aerial patrol region of Ontario described in Fig. 1. Detection patrol routes are designed following general search and rescue principles (e.g. National Defence Fisheries and Oceans Canada 2014) and have a typical duration of 3.5 h. The area covered by a single aircraft is variable pending the route design, and there are not enough aircraft to view all of the patrol region on a given day (Fig. 2). However, not every location needs to be seen, not every aircraft is needed every day and aircraft can be hired on a short-term basis.
|
Daily aerial detection decision-making
In Ontario, a provincial Detection Leader plans the daily deployment and routeing of aerial detection patrols to satisfy the needs of two regional Duty Officers who manage all wildland fire management activities in their respective regions. Route design varies from general coverage of areas of lower concern yet higher uncertainty about undetected fires and their potential behaviour, to intensive coverage of an area of higher concern with a higher likelihood of undetected fires (Fig. 2).
To assist with the prioritisation of areas and patrol route design, a variety of spatial data overlaid in a geographic information system (GIS) environment is used, such as recent lightning, resources and assets, Canadian Forest Fire Weather Indices (see Van Wagner 1987), active fires and satellite hotspots. Other factors influencing priority and route design include aircraft logistics (e.g. fuel, airport locations, Transport Canada-regulated duty and flight times, visibility), public detection potential, location of active fires and suppression activities. Most aerial detection planning decisions are ‘recognition-primed decisions’ (e.g. Hutton and Klein 1999) where the design of patrol routes is based on familiarity with the situation and knowledge of the spatial distribution of detection priorities.
There is a range of expertise in decision-making (Dreyfus 2004), and experts are needed for recognition-primed decisions. The expertise among staff is always in some state of flux because people gain experience, retire, or move on to other work. Decision support systems integrate information about the various factors and consistently combine them in structured way according to expert decision-makers’ understanding of the problem. It is our view that, even for experts, decision support provides a baseline for comparison, and may save time, contribute to decision-making and provide an objective record of the decision.
The objective of the present study was to address the gap between the decision-support needs of fire management staff and the support available (Martell et al. 1999; Martell 2011; Pacheco et al. 2015) by developing a risk-based framework, calibrated by experts, that provides a measure of the spatially explicit degree of need for aerial detection each day. Our framework accounts for potential fire occurrence, behaviour and impact as well as the likelihood of indirect detection by the public.
Methods
Risk-based model structure
Risk assessment is a widely used method to help fire management staff make many tactical and strategic decisions (e.g. Finney 2005; Hardy 2005; Calkin et al. 2011; Ager et al. 2013). A risk framework organises the questions that need to be posed and answered to assess loss and address uncertainty. Risk is typically expressed as impact multiplied by likelihood to quantify expected loss, such as Crichton’s (1999) ‘risk triangle’, which connects hazard, vulnerability and exposure. This risk triangle was modified for wildfire risk by Scott (2006) and a comprehensive approach to risk elements for wildland fire management was outlined by Xi et al. (2019).
To identify how fire management staff assess risk for aerial detection route planning, OMNRF Regional Duty Officers and Detection Leaders were asked to participate in a series of engagements. There is more than one method of elicitation and there is no single perfect method (Hickey and Davis 2003). Our goal was to describe the experts’ reasoning behind their prioritising areas for direct detection. To do so, we simply asked questions and observed performance with different levels of formality (e.g. Hoffman and Lintern 2006). This engagement took place over the period 2009 to 2016 as the scope progressed from the scale of a model for a single fire response sector, to a region and then to the province. The elicitation included observation and collaborative sessions, such as:
-
posing scenarios where detection planners were asked to recall specific days that had various levels of ‘hazard’ and were asked probing questions such as ‘What would you do on a day like that in this area?’
-
observing their daily actions, e.g. actual operational route planning
-
reviewing procedures and training documents
-
illustrating the components of their decision-making using influence diagrams, and
-
carrying out opportunistic discussions, e.g. staff were engaged where and when available with different levels of structure.
During these discussions, experts were advised of the goal of the study, and assured that their responses would be treated as anonymous to encourage openness and that the intent was not replace their expertise with a model (a concern noted in early conversations). Experts were asked to describe how they prioritise areas for aerial detection patrols and in particular, what criteria or situation would increase or decrease their attention to a specific area.
We organised the responses into three stages of decision-making or assessment (below) that experts follow to determine which areas require direct detection and the corresponding factors needed to perform the assessment. Fundamentally, questions to resolve are (1) what can happen; (2) how likely is it to happen; and (3) if it occurs, what are the potential consequences (Kaplan and Garrick 1981)?
Assessment Stage 1: Determining risk (expected loss)
-
‘What can happen?’
-
-
Fires will grow and progressively damage resources and assets before detection and containment.
-
-
‘How likely is it to happen?’
-
-
How probable is it that there now are active but undetected fires, and how probable is it that new fires will occur later this day?
-
-
‘If it occurs, what are the potential consequences?’
-
-
There is a potential for negative impacts from fire effects on various resources and assets; the magnitudes of the impacts are a function of fire intensity, fire size, geographical location and other factors.
-
Assessment Stage 2: Considering opportunities that may decrease loss
-
‘What can happen?’
-
-
The public could detect the fire early enough to enable suppression action that day.
-
-
‘How likely is it to happen?’
-
-
What is the probability of early public detection today?
-
-
‘If it occurs, what are the potential consequences?’
-
-
Potential negative impacts are reduced.
-
Assessment Stage 3: Determining the willingness to rely on the opportunity and tolerance of remaining loss
-
‘Given the initial risk (Stage 1), to what extent are decision-makers willing to rely on the likelihood of public detection?’
-
-
Residual risk occurs if the initial risk is reduced but not eliminated by public detection. If residual risk is too high, it may be reduced further with aerial detection.
-
These stages of risk assessment are the basis for a modelling framework (Fig. 3) with factor weighting based on further expert elicitation (discussed in the Calibration of the combination of factors through expert elicitation section) to calculate the following two demand indices:
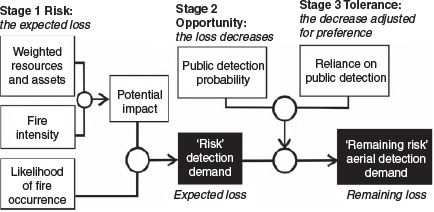
|
-
Detection Demand Index (DDI): (Stage 1) quantifies the risk if the area is not seen by direct or indirect detection agents today. Potential fire impacts are proportional to the types and amounts of resources and assets nearby, and to fire intensity because greater intensity is associated with greater spread, difficulty of control and impacts from resources and assets (RAs). The likelihood of fire occurrence stems from conditions of fuels and recent ignition potential. These impacts and likelihoods form risk (expected loss), for which there is a need for detection.
-
Aerial Detection Demand Index (ADDI): (Stages 2 and 3) quantifies the risk if the area is not seen by direct detection (i.e. aerial detection) today. DDI and the probability of public detection are used to calculate the ADDI. The tolerance, namely the level of reliance on public detection depends on the magnitude of the risk (e.g. dry and windy v. wet or calm conditions) and the time horizon for public detection.
The four main input factors and their effects on the need for detection or aerial detection for a day are (Fig. 3):
-
Fire occurrence (higher occurrence leads to a greater need for detection)
-
Head fire intensity (HFI) (higher HFI leads to a greater need for detection)
-
Impacts from nearby RAs (higher impacts lead to a greater need for detection)
-
Public detection probability (a higher public probability may lead to a reduced need for aerial detection, depending on the other factors)
The need for detection is directly proportional to the first three factors and is modelled as a multiplicative combination of these factors to account for interactions. For example, if the first three factors are high, then the risk and need for detection are very high. If the first, second or third factor is near zero, then the risk and need for detection will be near zero. Hence, one might assume:
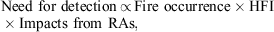
which directly aligns with the framework of risk being equal to likelihood × impact. Here, fire occurrence is a surrogate measure of likelihood and the combination of HFI and impacts from RAs represents impact.
Spatial and temporal input variables
The spatial extent and scale of this risk model is the official Ontario wildland fire management region, partitioned into a set of ~20 by 20-km grid cells. Some cells near provincial and water boundaries are smaller than 20 by 20 km. This scale accommodates the OMNRF standard effective scanning range for a person on an aerial detection patrol and matches an existing grid that is used for a lightning-caused fire occurrence prediction model (Wotton et al. 2005). The model is not limited to the general aerial patrol area of Ontario (Fig. 1) because there are times and places where direct detection efforts may be required in remote areas and our intent was not to limit the model to current operational procedures. Finer-scale input data were processed to compute the model factors in each cell. The planning horizon is 1 day.
Fire behaviour
Fire behaviour is characterised in terms of several measures including intensity. Fire intensity is used for many fire management purposes because it is considered to be an important indicator of fire propagation, resistance to control and damage to RAs (e.g. Byram 1959; Hirsch and Martell 1996). For example, a high-intensity fire can destroy a building whereas a lower-intensity fire may only cause cosmetic or superficial damage. One measure of fire intensity is HFI, which is the rate of energy release per unit time per unit length of fire front (Byram 1959). The HFI is the product of the rate of fire spread, amount of fuel consumed and heat yield. It is the dominant single descriptor of fire behaviour (Alexander 1982). Similarly to other studies (Scott et al. 2013; Thompson et al. 2013; McFayden et al. 2019), we use HFI to measure potential impact, calculated as the forecast peak burn HFI at 1700 hours local time for the dominant fuel type (see Forestry Canada Fire Danger Group 1992) in each grid cell as a daily measure of fire behaviour.
Weighting the types and amounts of resources and assets
We consider RAs to be valued geospatial entities that could be affected by fire (e.g. see Scott et al. 2013; McFayden et al. 2019). Resources refer to natural and biological elements (e.g. timber, habitat, water), whereas assets refer to human developments (e.g. infrastructure, structures, developed recreational areas). We developed a model to score each RA type and calculated a weighted total RA for each grid cell to represent potential loss.
Using data layers displayed on OMNRF situational awareness maps as the RA, an anonymous survey was conducted of an expert group of 10 senior OMNRF staff including Duty Officers, Fire Behaviour Analysts, Fire Intelligence Specialists and Fire Operations management personnel. The respondents were asked to provide an importance score for each RA, scored on a Likert scale of 0–10. The RA data considered were counts for point features, kilometres for linear features, and hectares for areal features within each cell (see Table 2).

|
A Likert scale ranks the RAs’ relative importance to each other rather than on an absolute value scale. ‘Importance’ was used to describe socioeconomic impact from the loss or full disruption of the RA (i.e. a score of 10, or very high importance, is synonymous with a high negative socioeconomic impact if lost or destroyed). As the effects of fire and the resulting impacts can vary greatly, this simplification was used to obtain a tractable measure of impacts.
The scores in each cell were calculated by multiplying each individual RA type by its the median score from the surveys, then summing these over all RAs for a total weighted score. Adjustments to linear and point data were made in border cells smaller than 20 by 20 km. The underlying principle was that urgency for detection increases with both increasing amounts and importance of RAs. For example, three structures cause more concern that a single structure.
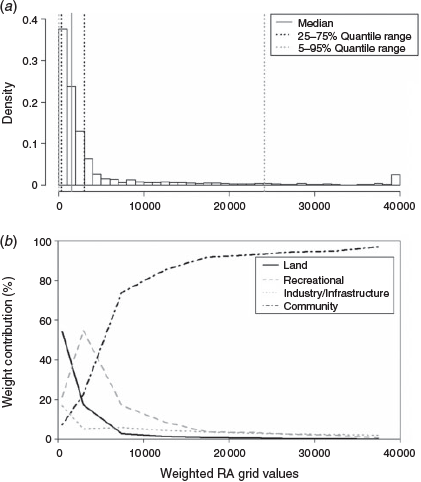
A maximum cell score (40 000) was based on the assumption that once a certain threshold of RA density has been reached within a cell, a higher value would not significantly increase the demand for detection. This maximum score approximately corresponds to a cell with a small city within it.
The distribution of the set of final cell scores across the study area was calculated and examined to determine the extent to which it reflected the expert interpretation of the spatial impact potential (Fig. 4a). It is skewed towards lower values and exhibits a small build-up of frequency at the upper limit of 40 000, with a median of 1532, and 5, 25, 75 and 95% quantiles of 11, 363, 3052 and 24 193 respectively. This indicates that much of the province is considered to have lower impact potential, while some areas have a far higher impact potential. To explore what drives the increased values of grid cells, the 25 RAs were grouped into general categories (Land, Recreational, Industry and Infrastructure, and Community) and the percentage contribution of each group to the total weight of each grid cell was calculated and presented as a function of cell total weight (Fig. 4b). Not surprisingly, there is a strong correlation between grid cell total weighted score and the contribution of the RA classed as Community, where impact is typically highest.
|
Likelihood of fire occurrence
The processes underlying wildland fire occurrence vary by cause of ignition, so the likelihood of fire occurrence was calculated by combining the outputs of separate models for person- and lightning-caused fire occurrence prediction (FOP), developed on the same grid. A spatially explicit person-caused FOP model was developed using the logistic generalised additive modelling (GAM, see Wood 2017) methodology pioneered by papers that include Brillinger et al. (2003) and Preisler et al. (2004). This methodology has been employed for FOP models in other regions (Vilar et al. 2010; Woolford et al. 2011). A detailed review of FOP modelling including this logistic GAM methodology appears in Taylor et al. (2013).
In Ontario, person-caused fires are classified as being caused by residents (e.g. burning brush), railway operations, recreational activities and industrial activities, as well as miscellaneous, incendiary and unknown causes. A stratified modelling approach was therefore used to account for the different seasonal and spatial baselines (e.g. Brillinger et al. 2003) as well as different variables that drive these various causes. A ‘spring peak’ category includes railway, residential, miscellaneous and unknown-cause fires, whereas a ‘summer peak’ category includes recreation, industry and incendiary fires. The full suite of models includes separate spring and summer peak models for each of the North-west and North-east Fire Regions, along with an aspatial model for small clusters of cells in far-north communities. The predictors for these models include the Fine Fuel Moisture Code, forest landscape type as characterised by ecoregion, time of year (to capture intra-annual seasonality), length of railway, length of roads, a measure of human activity in wildland areas (elicited from OMNRF personnel), along with seasonal and spatial baselines (see Woolford et al. 2016). The predicted fire occurrence probabilities from these models are summed within each cell to obtain the expected number of person-caused fires in each grid cell location on a given day.
The spatially explicit lightning-caused FOP model used was developed for Ontario by Wotton and Martell (2005). Lightning-caused fire factors include lightning strike (number, polarity and density), Sheltered Duff Moisture Code (Wotton et al. 2005), Drought Code (Van Wagner 1987) and forest landscape type as characterised by ecoregion. The outputs of this model are the expected number of lightning-caused fires for the day in each grid cell, both the expected number of holdover fires smouldering undetected on the landscape and the expected number of those fires to arrive (i.e. be reported) during the day. The former is used for detection planning and the latter for fire response planning.
Public detection probability model
Many fires in Ontario (nearly half) are discovered and reported by the public. A simple empirical approach was employed to estimate the spatially explicit probability of public detection. Historical data from 1998 to 2013 were used to calculate the empirical proportion of fires that were first detected and reported by the public within a given cell within a given time horizon. An exception is for cells with at least one fire but fewer than five fires, in which case the probability was simply reduced by 50% to address the influence of a small sample size.
The success of initial attack of fires is believed to be affected by many factors including the elapsed time from ignition to reporting and subsequent fire suppression action (Paudel et al. 2019). Time horizons of 4, 8, 12 and 24 h were used for public detection probability. This stratification was done because the importance of the elapsed time depends on the potential fire behaviour and potential impacts. When they are low, longer elapsed times are acceptable, but when they are high, longer elapsed times are not acceptable.
Calibration of the combination of factors through expert elicitation
Detection experts possess a tacit knowledge of the system that is subjective and difficult to describe. There has been a growing focus on expert elicitation and many studies where expert knowledge is preserved in decision aids (Hoffman et al. 1995) including those used in other fire management applications (e.g. Hirsch et al. 1998, 2004; Scott et al. 2013; McFayden et al. 2019). It was clear from the initial interviews that experts did not weight all factors equally or linearly (e.g. the hazard represented by fire behaviour conditions was more of a concern to experts than the likelihood of fire occurrence in some situations). Nor would a weighting of each factor fully capture the how they considered these factors and their interaction (e.g. it was not simply a matter of fire occurrence being twice as important as RAs).
The DDI was therefore calibrated to reflect the decision-making of OMNRF staff considered to be detection experts. Noting that there are many methods of expert elicitation (e.g. Hoffman et al. 1995; Hickey and Davis 2003; Hoffman and Lintern 2006), we chose to use semistructured interviews with an interactive tabular representation of the DDI scores given low to high fire occurrence, fire intensity and weighted resource and asset scenarios. In an ask-and-answer format, experts provided feedback about whether or not their feeling of the ‘level of concern’ was represented when the interviewer showed the results of different non-linear combinations of the factors. The numeric output was a coloured chart where higher scores were coloured red and lower coloured green to aid in interpretation. This ask-and-answer process of ‘do you like it now, or now?’ (similar to the process used by an optometrist to assess vision) proceeded until the experts were satisfied with the results. There was no set number of iterations, and the expert was free to engage in discussions and respond to additional questions from the interviewer. After completion of individual exercises, each participant was provided with the responses of the other members of the group and their rationales were discussed.
The final form of the DDI model was arrived at by group consensus. For this, we used 7 days of historical data to calculate and map the DDI along with the actual planned detection routes and reported fires. The expert panel reviewed results, discussed what they recalled of those situations and specified the model settings that they felt adequately represented their risk preferences.
The rationale for the final form of each factor in the DDI model was as follows:
-
Fire occurrence: contributions from the person- and lightning-caused fire models have significantly different magnitudes. It is rare that the person-caused model will predict more than one expected fire per cell per day, whereas the lightning-caused model may predict several owing to the spatial and temporal clustering (surges) of lightning fire arrivals. To resolve the difference in model scale in both the person- and lightning-caused models, the expected number of fires for each model was mapped to a set of ordinal fire occurrence categories, each with indices of 1–10 representing the relative likelihood of fire occurrence in each cell (1 being low, 5 being moderate and 10 being high). Those categories were combined across the lightning- and person-caused models to produce the total likelihood of fire occurrence categorical variable (Lf) used in DDI. The expert panel also strongly felt that the desire to look at an area rises quickly as the likelihood of fire occurrence increases from zero. However, this approaches a plateau because the desire to look at an area can eventually become a necessity. The Lf is weighted in DDI with a power transformation (0.8) to represent this behaviour.
-
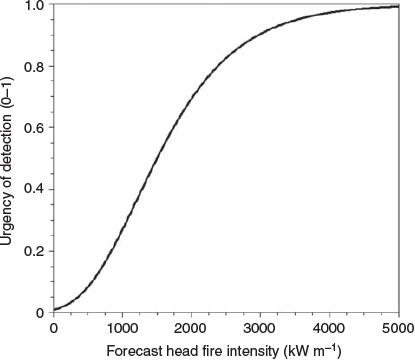
HFI: a polynomial transformation of HFI to sHFI was developed through an elicitation process. This is a common approach to HFI classifications (e.g. Alexander and Cole 1995). The expert panel felt that HFI has a compressed scale. Once a fire reaches a sufficiently high intensity level, the importance of looking no longer increases linearly but plateaus. As is the case with fire occurrence, once the HFI is high enough, it is already highly desirable if not a necessity to look at the cell. The polynomial transformation for HFI to represent this behaviour as determined through the elicitation process is depicted in Fig. 5.
-
Impacts from the types and amounts of resources and assets: the experts wanted to look at an area when there are any impacts on RAs, even very small. The desire to see a medium v. a high density of weighted RAs was not much different. The Wra is weighted in the DDI by a power transformation (0.5) to represent this behaviour.
|
Calculating the DDI
The following is the function for the DDI:
where Lf is the index of the likelihood of fire occurrence factor, sHFI is the polynomial head fire intensity (peak burn) factor, and Wra is the weighted resources and assets factor.
The DDI is constrained to range from 0 to 100 and categorised onto an ordinal scale, ranging from 1 to 10 for the purpose of colour-coded mapping of this risk. Table 3 depicts an example of the different components of DDI and a comparison of a standard risk calculation that uses linear weighting and the expert non-linear weighting that is used.

|
Calculating the ADDI
The ADDI is calculated as follows:

Note that the ADDI adjusts the DDI for both public detection probability (Ppd) and the reliance on the public detection (RelPpd). This produces a measure of the need for a cell to be seen by aerial detection observers, so fires can be detected and reported. Similarly to the DDI, the ADDI is constrained to range from 0 to 100 and is categorised onto the same linear scale as the DDI for mapping purposes.
The time delay category for which the Ppd is applied in the ADDI calculation depends on the DDI (see Table 4). When the DDI is higher, a more immediate public detection timeframe is used. For example, a cell may have a higher probability that the public will report a fire within 24 h, but a low probability of detection in 4 h. If the DDI is high, a shorter time window for public detection probability is used to calculate ADDI.

|
The reliance on pubic detection probability (RelPpd) also depends on the DDI (see Table 5). The higher the DDI, the less willing a decision-maker is to rely only on an uncertain public detection. This is both because of the variability in public detection reporting (e.g. random encounter and voluntary reporting) and the simplicity of the model we have used. These model parameters mimic the decisions taken when detection planners state they ‘rely on the public’. Table 6 gives an example of the different components of DDI and ADDI for a range of conditions identical to those used in Table 3.
|
|

|
Illustration and Validation
An example of the components of DDI and ADDI is illustrated in Fig. 6. The top three maps show the likelihood of fire occurrence, the HFI and the weighted RAs respectively. Each of the three factors in the three top maps are important for determining detection demand but none of the factors alone or in any two-way pairing are sufficient to determine the detection demand.

|
The DDI and ADDI maps in Fig. 6 illustrate the effect of reliance on the probability of public detection. Although the two maps are similar, the ADDI map generally has slightly lower indices. This is particularly noticeable where the reddish cells on the DDI map appear in a lower category on the ADDI map.
To explore the ADDI as a measure of the demand for aerial detection, we examine the relationship between the ADDI and where the detection patrols flew in the past. Our hypothesis is that our ADDI model is valid if past aerial detection flights, planned by expert detection planners, were routed over cells with large rather than small ADDI values.
We calculated the daily ADDI during a study period consisting of 1 June through 15 August for each of the 2016 and 2017 fire seasons. We focus on this core summer period of the fire season because it avoids the variability associated with fire weather station start-up and shut-down rules. The timing of spring snow melt and fall (autumn) shut down can vary from year to year and spatially across the provincial network of fire weather stations operated by the OMNRF. By limiting our analysis to this period, we ensure consistent spatial interpolation of weather variables and subsequent calculation of fire-weather indices and the HFI.
Each detection aircraft has an automated flight following unit that transmits ‘heartbeats’ that include data on location, altitude and speed of the aircraft during each flight. Heartbeats occur approximately every 2 min and are transmitted via a satellite link to a ground station server and redistributed to the OMNRF’s web-based monitoring application for flight monitoring. We used this heartbeat data to determine when grid cells are looked at during a route flown by aerial detection (see Fig. 7).

|
Any grid cell with its centroid within 20 km of a heartbeat location is said to have received a ‘look’ because this is the standard scanning distance used in the Ontario. These data were cleaned by removing all heartbeats with an altitude of zero and where the speed was less than 60 knots (kn) (i.e. below the stall speed of the aircraft). Furthermore, cells with a centroid within 20 km of the main base airports for contract detection aircraft were removed because those cells receive many looks simply due to the detection aircraft taking off and landing there frequently. A final cleaning step was to remove all grid cells above the northern boundary of aerial detection patrols (see Fig. 1) because aerial detection patrols above that boundary are coordinated through a different management process, namely reconnaissance flights that are dispatched to investigate fires reported by other means.
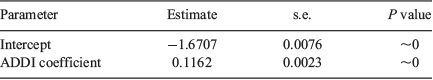
We examined the association between the detection aircraft heartbeats and the ADDI values of the cells visited in proximity to the detection aircraft. A logistic generalised linear model (GLM; e.g. Wood 2017) was fitted to model the probability that a detection patrol flies through or near a cell as a function of the ADDI. A likelihood ratio test comparing this model with the null model showed a highly significant improvement in model fit with the inclusion of an ADDI effect (P value ~0) and hypothesis tests for the intercept and ADDI coefficient parameters were highly significant (Table 7).
|
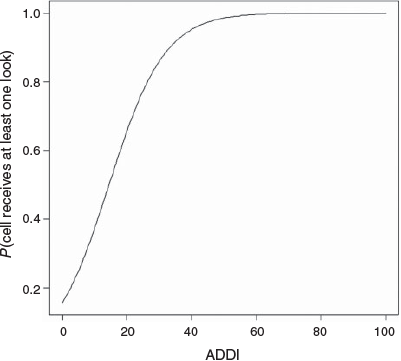
The estimated logistic regression coefficient for the ADDI was positive. Hence, the probability of a cell receiving at least one ‘look’ significantly increases as a function of ADDI. The estimated parameters are on the logit scale. The fitted model mapped back to the probability scale is given by the following equation.
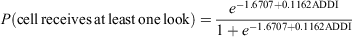
which is visualised in Fig. 8.
|
Discussion
As with all models, there are limitations in ADDI. For example, there are hundreds of RAs in the provincial data warehouse (OMNRF 2019) that are not accounted for in our weighted RA model (e.g. habitat areas, different types of structures). More detailed approaches to impact quantification could improve the model (e.g. Scott et al. 2013; Thompson et al. 2013; McFayden et al. 2019). We also recognise that fire can have positive impacts and offsite effects, neither of which our methodology currently addresses. The current approach for public detection probability uses simple time categories and historical data. Refinements to public detection modelling are ongoing. The ADDI does not indicate when or how often a cell needs to be looked at each day. Answering these questions requires among other things addressing the probability of fire detection by a person in a detection aircraft and the value of early detection, which are areas of active study.
More broadly, the ADDI model is patterned after expert preference and therefore reflects the behaviour of staff, which is the result of the culture, values, structure and operating norms of the fire management agency (e.g. Thompson et al. 2018). Experts can be subject to biases, e.g. representativeness bias or adjustment and anchoring (Tversky and Kahneman 1975). Hand et al. (2015) and Wilson et al. (2011) also found bias influenced decision-making in fire management. There can also be problems with including expert judgment that may affect model performance (e.g. Hoffman et al. 1995). For example, in our observations, we may have captured what the expert did, but not always what they know. Bias can be introduced from the elicitation methods used, e.g. leading questions, group effects. There are many methods for eliciting expert knowledge that may help improve engagement such as the Delphi technique for consensus among a group (e.g. Hasson et al. 2000) and the Critical Decision Method, which is used in naturalist environments such as fire management (e.g. Hoffman and Lintern 2006).
An alternative to emulating expert preference is using analytical models (e.g. Martell 1982; Minas et al. 2012). These models usually have mechanistic submodels that link alternative actions to outcomes of interest, given influencing factors such as burning conditions and RAs. Decision-makers specify their objectives or preferences on the outcomes. Example objectives may be to minimise discovery size, maximise initial attack success probability or – more comprehensively – minimise a surrogate measure of expected cost plus net loss (e.g. Simard 1976). The model identifies the action that leads to the best outcome according to the decision-makers’ stated preferences.
Stated concisely, models that emulate experts directly connect influencing factor conditions to what experts would like to do under those conditions. In contrast, for each alternative action, analytical models directly connect influencing factor conditions to outcomes of interest and then evaluate the outcomes according to elicited preferences, thereby identifying the best alternative action.
An advantage of analytical models is that they do not just reproduce experts’ behaviour, but may reveal alternative actions that may have some advantages. Maguire and Albright (2005) suggest that the use of analytical models may help overcome expert bias. Thompson et al. (2018) advocate the use analytical models as one of several means to increase the use of unplanned ignitions to help meet land-management objectives, especially the reduction of hazardous fuel and resulting future risks.
A sometimes presumed advantage of analytical models is that they are objective compared with models that emulate expert decision-making. We would argue that this can be true only to a degree. At least some of the components (influencing factors, outcomes of interest, objectives, and preferences) that are included or excluded from analytical models of complex systems implicitly reflect culture, values and practices. These model components are necessarily elicited from experts at some level, e.g. Clemen and Reilly (2014).
Disadvantages of analytical models include the difficulties of designing sufficiently accurate mechanistic submodels, eliciting objectives and preferences, explicitly measuring certain outcomes and trading off multiple conflicting preferences (e.g. Clemen and Reilly 2014). Furthermore, such complex models may be seen as being too abstract or overly simplistic relative to the real-world practicalities and complexities of wildland fire decision-making, thus limiting user acceptance.
The benefits of including experts in model design is that their domain knowledge should filter out unimportant cues (Elliott 2005) and focus researcher attention on what is important. The experience and knowledge of those involved can be retained within the model and assist less-experienced staff in the future. This can support maintaining institutional memory, especially in a high-turn-over workforce such as with seasonal fire management staff. Inclusion of experts also greatly assists in model acceptance when experts see their own influence at work.
The pros and cons of expertise v. analytical modelling for decision-making is an ongoing debate, e.g. Kahneman and Klein (2009), who give examples and counter-examples of the performance of each approach in various settings. We believe aerial detection decision-making meets the conditions where Kahneman and Klein would agree that expertise-based decision-making is suitable.
Nonetheless, we are actively working on analytical approaches to support many areas of wildland fire decision-making (e.g. McFayden et al. 2019). Although we are not motivated to increase or decrease the amount of aerial detection, we believe that analytical modelling is also a viable approach to support detection decision-making. We are planning an analytical model for detection that represents uncertain fire occurrence, detection and behaviour, and that accounts for impacts and cost.
Anecdotal feedback received by the authors from Detection Leaders during operational use indicated that the ADDI performed well under average conditions. However, there were situations where their preference or weighting of the factors would likely be different than those we elicited for the ADDI. The DDI and ADDI are not meant to prescribe decisions or to be the sole input for the decision-makers for planning detection aircraft patrols. There are always other factors and considerations that fire management personnel use when planning aerial detection efforts in real-world conditions in real time. Expert staff are always necessary in detection planning.
The ADDI is currently the only automated daily spatial fire risk product for assisting in wildland fire detection in Canada. To our knowledge, there are no other similar models or products in use by other fire management agencies. The value of the ADDI is its automated and spatial nature that consistently synthesises the main factors considered when planning detection efforts. We believe the ADDI may be a valuable decision support tool for fire management staff to consider when planning detection.
Conflicts of interest
The authors declare no conflicts of interest.
Acknowledgements
We acknowledge the significant contributions from Jason Robinson and Tom Ball from OMNRF who provided the support and direction for the development of this model. We recognise Jordan Evens (OMNRF) for important contributions in the development of several submodels. We thank the OMNRF and several staff for support including Bill Cole, Matt Coyle, Randal Kuyvenhoven, Dan Leonard, Gerry Leroux, Rob McAlpine, Darren McLarty, Benito Russo, Al Tithecott and Fred Welch; any omissions are unintentional. The authors also specifically thank Jim Caputo, Darrell Pajunen and Trevor Salinas for technical support. Thanks also to Mike Wotton with the Canadian Forest Service for helpful conversations regarding the lightning-caused fire prediction model. Jonathan Boucher of the Société de Protection des Forêts Contre le Feu (SOPFEU) provided helpful insights and edits. We also thank the anonymous reviewers and the associate editor for helpful comments. A very special thank you to the cadre of OMNRF Detection Leaders and those staff who participated in the elicitation and model testing. We acknowledge the support of the Natural Sciences and Engineering Research Council of Canada (NSERC) to Douglas Woolford (funding reference number: RGPIN-2015–04221) and David Martell (funding reference number: RGPIN-2015–04936).
References
Ager AA, Buonopane M, Reger A, Finney MA (2013) Wildfire exposure analysis on the national forests in the Pacific Northwest, USA. Risk Analysis 33, 1000–1020.| Wildfire exposure analysis on the national forests in the Pacific Northwest, USA.Crossref | GoogleScholarGoogle Scholar | 23078351PubMed |
Alexander ME (1982) Calculating and interpreting forest fire intensities. Canadian Journal of Botany 60, 349–357.
| Calculating and interpreting forest fire intensities.Crossref | GoogleScholarGoogle Scholar |
Alexander ME, Cole FV (1995) Predicting and interpreting fire intensities in Alaskan black spruce forests using the Canadian system of fire danger rating. (Natural Resources Canada: Ottawa, ON, Canada) Available at http://cfs.nrcan.gc.ca/pubwarehouse/pdfs/24358.pdf [Verified 6 August 2019]
Alkhatib AA (2014) A review on forest fire detection techniques. International Journal of Distributed Sensor Networks 10, 597368
| A review on forest fire detection techniques.Crossref | GoogleScholarGoogle Scholar |
Allison RS, Johnston JM, Craig G, Jennings S (2016) Airborne optical and thermal remote sensing for wildfire detection and monitoring. Sensors 16, 1310
| Airborne optical and thermal remote sensing for wildfire detection and monitoring.Crossref | GoogleScholarGoogle Scholar |
Arienti MC, Cumming SG, Boutin S (2006) Empirical models of forest fire initial attack success probabilities: the effects of fuels, anthropogenic linear features, fire weather, and management. Canadian Journal of Forest Research 36, 3155–3166.
| Empirical models of forest fire initial attack success probabilities: the effects of fuels, anthropogenic linear features, fire weather, and management.Crossref | GoogleScholarGoogle Scholar |
Boychuk D, McFayden C (2017) Appropriate response – Ontario’s strategic approach to wildland fire. Canadian Wildland Fire and Smoke Newsletter (Fall 2017). (Canada Wildfire: Edmonton, AB, Canada) Available at https://docs.wixstatic.com/ugd/90df79_bfcc500b532a4e38abaa78e1ecfdd26b.pdf [Verified 19 June 2019]
Brillinger DR, Preisler HK, Benoit JW (2003) Risk assessment: a forest fire example. In ‘Statistics and science: a festschrift for Terry Speed’. (Ed DR Goldstein) pp. 177–196. (Institute for Mathematical Statistics: Beachwood, OH, USA)
Byram GM (1959) Combustion of forest fuels. In ‘Forest fire: control and use’. (Ed KP Davis) pp. 61–89. (McGraw-Hill Book Company, Inc: New York, NY, USA)
Calkin DE, Thompson MP, Finney MA, Hyde KD (2011) A real-time risk assessment tool supporting wildland fire decision-making. Journal of Forestry 109, 274–280.
Clemen RT, Reilly T (2014) ‘Making hard decisions, 3rd edn.’ (South-Western, Cengage Learning: Mason, OH, USA)
Crichton D (1999) The risk triangle. In ‘Natural disaster management’. (Ed J Ingleton) pp. 102–103. (Tudor Rose: London, UK)
Cumming SG (2005) Effective fire suppression in boreal forests. Canadian Journal of Forest Research 35, 772–786.
| Effective fire suppression in boreal forests.Crossref | GoogleScholarGoogle Scholar |
Dreyfus SE (2004) The five-stage model of adult skill acquisition. Bulletin of Science, Technology & Society 24, 177–181.
| The five-stage model of adult skill acquisition.Crossref | GoogleScholarGoogle Scholar |
Duff TJ, Tolhurst KG (2015) Operational wildfire suppression modelling: a review evaluating development, state of the art and future directions. International Journal of Wildland Fire 24, 735–748.
| Operational wildfire suppression modelling: a review evaluating development, state of the art and future directions.Crossref | GoogleScholarGoogle Scholar |
Elliott T (2005) Expert decision-making in naturalistic environments: a summary of research. (Defence Science and Technology Organisation Systems Sciences Laboratory: Edinburgh, SA, Australia) Available at https://apps.dtic.mil/dtic/tr/fulltext/u2/a434061.pdf [Verified 9 August 2019]
Eno R (n.d.) Exhibits: fire towers. Available at http://www.bushplane.com/exhibits/fire-towers/ [Verified 6 August 2019]
Finney MA (2005) The challenge of quantitative risk analysis for wildland fire. Forest Ecology and Management 211, 97–108.
| The challenge of quantitative risk analysis for wildland fire.Crossref | GoogleScholarGoogle Scholar |
Forestry Canada Fire Danger Group (1992) Development and structure of the Canadian Forest Fire Behavior Prediction System. Forestry Canada, Science and Sustainable Development Directorate, Information Report ST-X-3. (Ottawa, ON, Canada)
Foster WT (1962) Aircraft in forest fire control in Ontario. Forestry Chronicle 38, 38–48.
| Aircraft in forest fire control in Ontario.Crossref | GoogleScholarGoogle Scholar |
Halle W, Asam S, Borg E, Fischer C, Frauenberger O, Lorenz E, Richter R (2018) Firebird – small satellites for wildfire assessment. In ‘2018 IGARSS international geoscience and remote sensing symposium’ 22–27 July 2018, Valencia, Spain. (Ed J Moreno) pp. 8609–8612. (IEEE: New York, NY, USA)
Hand MS, Wibbenmeyer MJ, Calkin DE, Thompson MP (2015) Risk preferences, probability weighting, and strategy trade-offs in wildfire management. Risk Analysis 35, 1876–1891.
| Risk preferences, probability weighting, and strategy trade-offs in wildfire management.Crossref | GoogleScholarGoogle Scholar | 26269258PubMed |
Hardy CC (2005) Wildland fire hazard and risk: problems, definitions, and context. Forest Ecology and Management 211, 73–82.
| Wildland fire hazard and risk: problems, definitions, and context.Crossref | GoogleScholarGoogle Scholar |
Hasson F, Keeney S, McKenna H (2000) Research guidelines for the Delphi survey technique. Journal of Advanced Nursing 32, 1008–1015.
Hickey AM, Davis AM (2003) Elicitation technique selection: how do experts do it? In ‘Proceedings 11th IEEE international requirements engineering conference’, 8–12 September 2003, Monterey, CA, USA. pp. 169–178. (IEEE: New York, NY, USA)
Hirsch KG, Martell DL (1996) A review of initial attack fire crew productivity and effectiveness. International Journal of Wildland Fire 6, 199–215.
| A review of initial attack fire crew productivity and effectiveness.Crossref | GoogleScholarGoogle Scholar |
Hirsch KG, Corey PN, Martell DL (1998) Using expert judgment to model initial attack fire crew effectiveness. Forest Science 44, 539–549.
Hirsch KG, Podur JJ, Janser RF, McAlpine RS, Martell DL (2004) Productivity of Ontario initial-attack fire crews: results of an expert-judgement elicitation study. Canadian Journal of Forest Research 34, 705–715.
| Productivity of Ontario initial-attack fire crews: results of an expert-judgement elicitation study.Crossref | GoogleScholarGoogle Scholar |
Hoffman RR, Lintern G (2006) Eliciting and representing the knowledge of experts. In ‘Cambridge handbook of expertise and expert performance’. (Eds KA Ericsson, N Charness, P Feltovich, R Hoffman) pp. 203–222. (Cambridge University Press: New York, NY, USA)
Hoffman RR, Shadbolt NR, Burton AM, Klein G (1995) Eliciting knowledge from experts: a methodological analysis. Organizational Behavior and Human Decision Processes 62, 129–158.
| Eliciting knowledge from experts: a methodological analysis.Crossref | GoogleScholarGoogle Scholar |
Hutton RJ, Klein G (1999) Expert decision-making. Systems Engineering 2, 32–45.
| Expert decision-making.Crossref | GoogleScholarGoogle Scholar |
Johnston J, Johnston L, Wooster M, Brookes A, McFayden C, Cantin A (2018) Satellite detection limitations of sub-canopy smouldering wildfires in the North American Boreal Forest. Fire 1, 28
| Satellite detection limitations of sub-canopy smouldering wildfires in the North American Boreal Forest.Crossref | GoogleScholarGoogle Scholar |
Johnston LM, Flannigan MD (2018) Mapping Canadian wildland fire interface areas. International Journal of Wildland Fire 27, 1–14.
| Mapping Canadian wildland fire interface areas.Crossref | GoogleScholarGoogle Scholar |
Kahneman D, Klein G (2009) Conditions for intuitive expertise: a failure to disagree. The American Psychologist 64, 515–526.
| Conditions for intuitive expertise: a failure to disagree.Crossref | GoogleScholarGoogle Scholar | 19739881PubMed |
Kaplan S, Garrick BJ (1981) On the quantitative definition of risk. Risk Analysis 1, 11–27.
| On the quantitative definition of risk.Crossref | GoogleScholarGoogle Scholar |
Kourtz PH (1973) A forest fire detection demand model-for scheduling and routing of airborne detection patrols. Departmental Publication no. 1322. (Environment Canada, Canadian Forestry Service Headquarters: Ottawa, ON, Canada) Available at https://cfs.nrcan.gc.ca/publications?id=24860 [Verified 8 August 2019]
Kourtz PH (1987) The need for improved forest fire detection. Forestry Chronicle 63, 272–277.
| The need for improved forest fire detection.Crossref | GoogleScholarGoogle Scholar |
Kourtz PH (1994) Advanced information systems in Canadian forest fire control. In ‘Proceedings of the AFAC conference’, 4 November 1994, Perth, WA, Australia. (Natural Resources Canada: Ottawa, ON, Canada) Available at http://cfs.nrcan.gc.ca/pubwarehouse/pdfs/33796.pdf [Verified 8 August 2019]
Maguire LA, Albright EA (2005) Can behavioral decision theory explain risk-averse fire management decisions? Forest Ecology and Management 211, 47–58.
| Can behavioral decision theory explain risk-averse fire management decisions?Crossref | GoogleScholarGoogle Scholar |
Martell DL (1982) A review of operational research studies in forest fire management. Canadian Journal of Forest Research 12, 119–140.
| A review of operational research studies in forest fire management.Crossref | GoogleScholarGoogle Scholar |
Martell DL (2011) The development and implementation of forest and wildland fire management decision support systems: reflections on past practices and emerging needs and challenges. Mathematical and Computational Forestry & Natural-Resource Sciences 3, 18–26.
Martell DL, Sun H (2008) The impact of fire suppression, vegetation, and weather on the area burned by lightning-caused forest fires in Ontario. Canadian Journal of Forest Research 38, 1547–1563.
| The impact of fire suppression, vegetation, and weather on the area burned by lightning-caused forest fires in Ontario.Crossref | GoogleScholarGoogle Scholar |
Martell DL, Kourtz PH, Tithecott A, Ward PC (1999) The development and implementation of forest fire management decision support systems in Ontario, Canada. In ‘Proceedings of the symposium on fire economics, planning and policy: bottom lines’, 5–9 April 1999, San Diego, CA, USA. USDA Forest Service, Pacific Southwest Research Station, General Technical Report PSWGTR-173. pp. 131–142. (Albany, CA, USA)
McFayden CB, Boychuk D, Woolford DG, Wheatley MJ, Johnston L (2019) Impacts of wildland fire effects on resources and assets through expert elicitation to support fire response decisions. International Journal of Wildland Fire
| Impacts of wildland fire effects on resources and assets through expert elicitation to support fire response decisions.Crossref | GoogleScholarGoogle Scholar |
Minas JP, Hearne JW, Handmer J (2012) A review of operations research methods applicable to wildfire management. International Journal of Wildland Fire 21, 189–196.
| A review of operations research methods applicable to wildfire management.Crossref | GoogleScholarGoogle Scholar |
National Defence, Fisheries and Oceans Canada (2014) Canadian aeronautical and maritime search and rescue manual. Combined Edn – Vols I, II and III. B-GA-209–001/FP-001 DFO 5449. (Sooke, BC, Canada) Available at https://ccga-pacific.org/training/manuals/CAMSAR-2014-english-signed.pdf [Verified 09 August 2019]
OMNRF (2014) ‘Wildland fire management strategy.’ (Queen’s Printer for Ontario: Toronto, ON, Canada)
OMNRF (2019) Land Information Ontario (LIO). Available at https://www.ontario.ca/page/land-information-ontario [Verified 19 June 2019]
Pacheco AP, Claro J, Fernandes PM, de Neufville R, Oliveira TM, Borges JG, Rodrigues JC (2015) Cohesive fire management within an uncertain environment: a review of risk handling and decision-support systems. Forest Ecology and Management 347, 1–17.
| Cohesive fire management within an uncertain environment: a review of risk handling and decision-support systems.Crossref | GoogleScholarGoogle Scholar |
Parks GM (1964) Development and application of a model for suppression of forest fires. Management Science 10, 760–766.
| Development and application of a model for suppression of forest fires.Crossref | GoogleScholarGoogle Scholar |
Paudel A, Martell DL, Woolford DG (2019) Factors that affect the timing of the dispatch of initial attack resources to forest fires in north-eastern Ontario, Canada. International Journal of Wildland Fire 28, 15–24.
| Factors that affect the timing of the dispatch of initial attack resources to forest fires in north-eastern Ontario, Canada.Crossref | GoogleScholarGoogle Scholar |
Podur J, Wotton BM (2010) Will climate change overwhelm fire management capacity? Ecological Modelling 221, 1301–1309.
| Will climate change overwhelm fire management capacity?Crossref | GoogleScholarGoogle Scholar |
Preisler HK, Brillinger DR, Burgan RE, Benoit J (2004) Probability-based models for estimation of wildfire risk. International Journal of Wildland Fire 13, 133–142.
| Probability-based models for estimation of wildfire risk.Crossref | GoogleScholarGoogle Scholar |
Schroeder D (2004) Evaluation of three wildfire smoke detection systems. Advantage, 524, 8
Scott JH (2006) An analytical framework for quantifying wildland fire risk and fuel treatment benefit. In ‘Fuels management – How to measure success: conference proceedings’, 28–30 March 2006, Portland, OR, USA. (Eds PL Andrews, BW Butler) pp. 169–184. (USDA Forest Service: Washington, DC, USA). Available at https://www.fs.usda.gov/treesearch/pubs/25944 [Verified 17 July 2019]
Scott JH, Thompson MP, Calkin DE (2013) A wildland fire risk assessment framework for land and resource management. USDA Forest Service, Rocky Mountain Research Station, General Technical Report RMRS-GTR-315. (Ogden, UT, USA)
Simard AJ (1976) Wildland fire management the economics of policy alternatives. Environment Canada, Canadian Forestry Service, Forest Fire Research Institute, Technical Report 15. (Ottawa, ON, Canada)
Taylor SW, Woolford DG, Dean CB, Martell DL (2013) Wildfire prediction to inform management: statistical science challenges. Statistical Science 28, 586–615.
| Wildfire prediction to inform management: statistical science challenges.Crossref | GoogleScholarGoogle Scholar |
Thomas PA, McAlpine RS (2010) ‘Fire in the forest.’ (Cambridge University Press: New York, NY, USA)
Thompson MP, Scott J, Helmbrecht D, Calkin DE (2013) Integrated wildland fire risk assessment: framework development and application on the Lewis and Clark National Forest in Montana, USA. Integrated Environmental Assessment and Management 9, 329–342.
| Integrated wildland fire risk assessment: framework development and application on the Lewis and Clark National Forest in Montana, USA.Crossref | GoogleScholarGoogle Scholar | 22987567PubMed |
Thompson MP, MacGregor DG, Dunn CJ, Calkin DE, Phipps J (2018) Rethinking the wildland fire management system. Journal of Forestry 116, 382–390.
| Rethinking the wildland fire management system.Crossref | GoogleScholarGoogle Scholar |
Tversky A, Kahneman D (1975) Judgment under uncertainty: heuristics and biases. In ‘Utility, probability, and human decision-making’. (Eds D Wendt, CA Vlek) pp. 141–162. (Springer: Dordrecht, The Netherlands)
Van Wagner CE (1987) Development and structure of the Canadian forest fire weather index system. Canadian Forestry Service, Forestry Technical Report 35. (Ottawa, ON, Canada)
Vilar L, Woolford DG, Martell DL, Martín MP (2010) A model for predicting human-caused wildfire occurrence in the region of Madrid, Spain. International Journal of Wildland Fire 19, 325–337.
| A model for predicting human-caused wildfire occurrence in the region of Madrid, Spain.Crossref | GoogleScholarGoogle Scholar |
Wilson RS, Winter PL, Maguire LA, Ascher T (2011) Managing wildfire events: risk‐based decision-making among a group of federal fire managers. Risk Analysis 31, 805–818.
| Managing wildfire events: risk‐based decision-making among a group of federal fire managers.Crossref | GoogleScholarGoogle Scholar | 21143258PubMed |
Wood SN (2017) ‘Generalized additive models: an introduction with R, 2nd edn.’ (Chapman and Hall/CRC: Boca Raton, FL, USA)
Woolford DG, Bellhouse DR, Braun WJ, Dean CB, Martell DL, Sun J (2011) A spatiotemporal model for people-caused forest fire occurrence in the Romeo Malette Forest. Journal of Environmental Statistics 2, 2–16.
Woolford DG, Dean CB, Martell DL, Cao J, Wotton BM (2014) Lightning‐caused forest fire risk in north-western Ontario, Canada, is increasing and associated with anomalies in fire weather. Environmetrics 25, 406–416.
| Lightning‐caused forest fire risk in north-western Ontario, Canada, is increasing and associated with anomalies in fire weather.Crossref | GoogleScholarGoogle Scholar |
Woolford DG, Wotton BM, Martell DL McFayden C, Stacey A (2016) Daily lightning- and person-caused fire prediction models used in Ontario. Poster presented at Wildland Fire Canada Conference, 24–26 October 2016, Kelowna, BC, Canada. Available at http://www.wildlandfire2016.ca/wp-content/uploads/2019/11/McFayden-Fire-Occurence-Prediction-Poster-Ontario-2016-10-17V2Final.pdf [Verified 14 November 2019]
Wotton BM, Martell DL (2005) A lightning fire occurrence model for Ontario. Canadian Journal of Forest Research 35, 1389–1401.
Wotton BM, Stocks BJ, Martell DL (2005) An index for tracking sheltered forest floor moisture within the Canadian Forest Fire Weather Index System. International Journal of Wildland Fire 14, 169–182.
| An index for tracking sheltered forest floor moisture within the Canadian Forest Fire Weather Index System.Crossref | GoogleScholarGoogle Scholar |
Xi DD, Taylor SW, Woolford DG, Dean CB (2019) Statistical models of key components of wildfire risk. Annual Review of Statistics and Its Application 6, 197–222.
| Statistical models of key components of wildfire risk.Crossref | GoogleScholarGoogle Scholar |
Yuan C, Zhang Y, Liu Z (2015) A survey on technologies for automatic forest fire monitoring, detection, and fighting using unmanned aerial vehicles and remote sensing techniques. Canadian Journal of Forest Research 45, 783–792.
| A survey on technologies for automatic forest fire monitoring, detection, and fighting using unmanned aerial vehicles and remote sensing techniques.Crossref | GoogleScholarGoogle Scholar |