

Fuel-aware forest fire danger rating system RISICO: a comparative study for Italy
Nicolò Perello A B * , Andrea Trucchia B , Mirko D’Andrea B , Giorgio Meschi B , Farzad Ghasemiazma A B , Silvia Degli Esposti B , Paolo Fiorucci B , Luca Ferraris A B , Andrea Gollini C and Dario Negro C
A
B
C
Abstract
Land use and climate changes are altering wildfire regimes globally, necessitating forest fire danger rating indices that can accurately identify spatio-temporal fire danger patterns for effective wildfire risk management.
Many existing models primarily rely on weather conditions, often overlooking fuel and providing daily information. This study introduces the latest version of the RISICO model, developed in the early 2000s and used operationally by the Italian Civil Protection system for decades. RISICO explicitly incorporates fuel into its computations, providing hourly outputs.
The fuel classification used by RISICO is based on a wildfire susceptibility model developed using machine learning techniques, reducing data requirements. The model’s performance was tested against various fire danger indices, considering the past 16 years of Italian wildfires.
Analysis of the RISICO outputs demonstrated improved performance in accurately identifying periods and locations of increased fire danger, more precisely narrowing the areas considered at risk compared with other models from the literature.
RISICO proves to be an effective tool for operational use in civil protection contexts, thanks to its ability to identify fire danger conditions accurately and with ease of implementation.
This study highlights the importance of including fuel characteristics within fire danger models to enhance their discrimination ability and improve wildfire risk management.
Keywords: civil protection, early warning system, fire danger, fire danger rating system, fire weather, fuel, fuel mapping, Italy, risk management, wildfire risk management.
Introduction
The deep connections between natural and anthropogenic factors are a key aspect in wildfires (Tedim et al. 2018; Carlucci et al. 2019; McWethy et al. 2019), shaping the fire regime. The latter results from complex interactions among weather conditions, fuel, topography and ignition sources operating on different temporal and spatial scales (Flannigan et al. 2005; Krebs et al. 2010; De Angelis et al. 2015). Humans shape fire regimes through land use, and fire and fuel management regulated by institutional and legal frameworks (Ganteaume et al. 2021; Wunder et al. 2021), and through intentional or accidental ignitions (Ganteaume et al. 2013). As a result, fire regimes constantly change in response to human actions, and are further intensified by ongoing human-caused climate change (Doerr and Santín 2016; Pausas and Keeley 2021).
These complex interconnections, and the changes in them that we are witnessing today, often result in disastrous impacts on human activities, highlighting the need for efficient Early Warning Systems (EWSs) to mitigate wildfire risks. EWSs aim to minimize the impacts of wildfires by offering critical tools for fire management decision-making to manage resources, reduce ignitions and improve initial attack plans, preventing fires from quickly spreading to become threatening wildfires (de Groot et al. 2015). EWSs leverage Forest Fire Danger Rating (FFDR) indices. They integrate scientific knowledge of fire–environment interactions to identify spatio-temporal fire danger patterns and to assess the likelihood of fire spread and control difficulty (Viegas et al. 1999; Di Giuseppe et al. 2016; Sirca et al. 2018; Zacharakis and Tsihrintzis 2023).
The use of FFDR indices presents ongoing challenges. Although numerous FFDR indices have been developed over the past decades, their effective and operational use within wildfire risk management remains a significant challenge. It is essential to provide appropriate information tailored to operational needs while avoiding information overload, and translate data into clear, actionable guidance that can be converted into procedures (Castellnou et al. 2019) – for example, the creation of fire danger bulletins used for resource management in preparedness and response phases (Baghino et al. 2024).
From a modeling standpoint, many indices primarily rely on meteorological inputs while overlooking key variables like fuel (Di Giuseppe 2023; PPRD East 3 2024), either owing to the difficulty of obtaining and maintaining fuel data (Ascoli et al. 2020), or because the goal is to provide uniform information across a territory, leaving the assessment of fuel impact to later stages of the wildfire risk management cycle (Van Wagner 1987). An example is the Canadian Forest Fire Danger Rating System (CFFDRS), which consists of a purely meteorological component, i.e. the Canadian Forest Fire Weather Index System, or FWI fire danger index commonly used worldwide (Van Wagner 1987), and the component that takes fuel into account, i.e. the Canadian Forest Fire Behavior Prediction System, or FBP (FCFDG 1992, Hirsch 1996). However, growing attention has recently been given to the fuel component, accounting for it directly in the calculation of indices to allow for greater differentiation within a territory (Di Giuseppe 2023). The inclusion of fuel in recent fire danger indices is also aided by technological advances (e.g. satellite products) that make it easier to obtain updated fuel-related information for large areas (Abdollahi and Yebra 2023; Di Giuseppe 2023).
Additionally, many indices operate on a daily resolution, following the operational needs for which they are used – a typical application is the production of fire danger bulletins, which are usually issued daily. However, other operational phases, such as prescribed fire planning or active wildfire management, may require sub-daily information. The temporal resolution is therefore closely tied to the specific operational requirement. For example, the FWI index – primarily known for its daily resolution, calculated using noon weather data – contains some adaptations to assess its diurnal cycle (Van Wagner 1977; Alexander et al. 1984). Nonetheless, a purely daily calculation may fail to capture sub-daily fluctuations in fire danger conditions, potentially overlooking extremes that could emerge in a subsequent daily assessment, whereas including these fluctuations would enhance operational effectiveness (Rodell et al. 2024).
Interpreting FFDR indices in various decision-making contexts necessitates calibration, validation and comparison procedures over different regions (Van Wagner 1987; Júnior et al. 2022), as frequently done in the literature (Viegas et al. 1999; Sirca et al. 2018; Eriksson et al. 2023) by comparing index outputs with historical fire activity (Viegas et al. 1999). However, their validation presents several ongoing challenges (Castel-Clavera et al. 2025). There is no recognized standard for validating these indices, leaving many decisions to the modeler, and underscoring the need for standardized datasets and robust calibration procedures (Eastaugh et al. 2012).
This paper introduces the RISICO model, developed and maintained by the authors for the Italian Civil Protection Department, which addresses key gaps in the literature, namely the inclusion of fuel and the hourly dynamics of fire danger. RISICO employs a simplified fuel classification derived without detailed ground-level data, which is presented in the paper. Finally, the results of a validation and comparison process across Italy with various FFDR indices are presented, adopting methodologies from existing literature to ensure simplicity in implementation and results interpretation.
Material and methods
RISICO system
The model’s development started in the late 1990s with research funded by the Liguria Region (Italy) to provide a regional FFDR system,1 subsequently extended at a national level and adopted by the Italian Civil Protection Department (Dipartimento di Protezione Civile - DPC) to support its activities.2 This research led to the development of the RISICO system (RISICO stands for RISchio Incendi e COordinamento, i.e. wildfire risk and coordination) (Fiorucci et al. 2008; Fiorucci et al. 2018), made available for the whole Italian territory in 2003, and for all the Italian regional Civil Protection (CP) authorities from 2011 through the MyDewetra platform (Italian Civil Protection Department and CIMA Research Foundation 2014). The system has been developed and maintained by CIMA Research Foundation,3 and updated over the years based on operational use feedback and technological advancements. This paper presents the latest version of the model.
The model’s objectives were identified thanks to interaction with the wildfire risk managers of the Liguria Region first, and at the national level later. The model aims to determine potential wildfire behavior through the whole territory and during the day, independently from possible ignition causes. From an operational perspective, it is of paramount importance to identify the areas and times of increased fire danger where eventual ignitions could lead to extreme wildfire behavior. This information can trigger early prevention actions such as patrolling and alerts to the population, and support the preparedness phase early, preparing firefighting teams for action, ready to start in case of emergency. Given the importance of the temporal component in scaling up wildfire behavior, it is a priority to reduce the time to intervention and make firefighting actions effective (Taylor et al. 2013). For the same reason, RISICO needed to provide a forecast of wildfire danger for the next 24–48 h, supporting the issuance of wildfire danger bulletins. During RISICO’s development, wildfire research focused on assessing fire danger via the FWI (Van Wagner and Pickett 1985; Van Wagner 1987) spatializing the FWI values computed at each weather station across the territory (Di Giuseppe et al. 2016). Italy’s early adoption of weather forecasts for flood prediction in the 1990s enabled RISICO to integrate from the beginning forecasts from Limited Area Models, allowing fire danger forecasts, now a standard practice.
Although born from independent research with respect to the FWI, the RISICO model has been modified over the years by adopting some concepts from it. However, some important particularities persist, such as the hourly resolution of the information, and the use of both topography and fuel cover. Any model is deeply bounded by the objectives for which it was developed, and so by the context in which it was conceptualized. These choices were driven by the Liguria Region particularities in terms of rapid changes in weather conditions, high vegetational variability and complex topography (Tonini et al. 2020), but similar conditions are found in many Italian and Mediterranean regions, making RISICO an interesting example.
Sub-daily resolution also enables better adaptability to diverse operational needs across the various phases of the wildfire risk management cycle, allowing the subsequent aggregation of information based on specific operational requirements. For instance, the hourly data provided by RISICO are aggregated into daily indices to avoid information overload, using statistical analysis of the hourly values. These daily indices are then used to produce fire danger bulletins. In particular, averages calculated over different percentiles are used to detect the persistence of fire danger patterns throughout the day – typically, the 75th percentile is used to capture persistence over a quarter of the day. However, daily extreme values are also provided for further assessment.
The RISICO system is composed of indices (see Fig. 1) related to different aspects of potential wildfire behavior: Dead Fuel Moisture Content (DFMC, %), Rate of Spread (ROS, m h−1) and Fire-Line Intensity (FLI, kW m−1). Neither the ROS nor FLI index aims to measure wildfire spread or intensity precisely but instead they offer tools to differentiate among potential wildfire behaviors. The indices are computed pixel by pixel by dividing the territory into cells, in which topography and fuel are considered homogeneous.

Dead Fuel Moisture Content (DFMC) index
The dead fuel moisture represents a crucial component in many FFDR systems (Nelson 2000), affecting both ignition probability and fire spread (Silva et al. 2010). It constitutes the dynamic component of RISICO, and is updated at each step of the model given previous fuel moisture status and weather.
The original empirical model was first proposed in Fiorucci et al. (2008). In the case of no rain, the fuel moisture tends toward an Equilibrium Moisture Content (EMC) with changing rate depending on fuel type through a standard response time T0 (h), which varies based on weather conditions. In the case of rain, the fuel moisture increases until it reaches a fuel-dependent saturation level sat (%), with a changing rate depending on the amount of rain.
The model proposed was able to differentiate between slow and fast fuel moisture dynamics in a single index, discriminating between faster (e.g. grasslands) and slower (e.g. broadleaf litter) responses to weather changes. Also, it adapted to different temporal steps given its explicit dependence on time in the equations.
The inclusion of different fuel-dependent moisture dynamics into a single index and the possibility to adapt to different time steps has been retained in the last release of the model (Perello et al. 2025), which has been modified and calibrated using fuel stick data. The model showed good performance, especially for low fuel moisture values. See Perello et al. (2025) for more details. The model’s implementation in RISICO adopts different T0 and sat parameters according to fuel maps, as presented in the next section (see Table 1). Also, snow cover can be considered by setting the fuel moisture values to the saturation level in the case of snow, letting DFMC evolve once it melts.
| Susceptibility | DFMC | FLI | ||||||||
|---|---|---|---|---|---|---|---|---|---|---|
| Low | Medium | High | ||||||||
| ROS | ||||||||||
| v0 (m h−1) | T0 (h) | sat (%) | d0 (kg m−2) | d1 (kg m−2) | hhv (kJ kg−1) | umb (%) | ||||
| Grasslands and croplands (G) | G1 | G2 | G3 | 12 | 40 | 0.5 | – | 17,000 | – | |
| 76 | 108 | 120 | ||||||||
| Broadleaves (B) | B1 | B2 | B3 | 60 | 60 | 1.5 | 3 | 20,000 | 60 | |
| 63 | 90 | 100 | ||||||||
| Shrubs (S) | S1 | S2 | S3 | 24 | 40 | 1 | 3 | 21,000 | 45 | |
| 88 | 126 | 140 | ||||||||
| Conifers (C) | C1 | C2 | C3 | 48 | 50 | 1 | 4 | 21,000 | 55 | |
| 113 | 162 | 180 | ||||||||
The fuel-specific parameters adopted in RISICO for each fuel type are reported: the nominal rate of spread v0 (m h-1); the standard response time T0 (h); the saturation level sat (%); the dead fuel load d0 (kg m-2); the live fuel load d1 (kg m-2); the higher heating value hhv (kJ kg-1); the live fuel moisture content umb (%).
Rate of Spread (ROS) index
The ROS index provides information on the fire’s potential to spread rapidly and, therefore, directly influences the timing and effectiveness of the response to the event. The ROS model modifies the fuel-specific nominal rate of spread v0 (m h−1) (see Table 1) according to the fuel moisture content, topography and wind:
where W and M are the wind–topography and fuel moisture effects, respectively.
The wind–topography interaction W was developed from the wildfire propagation model PROPAGATOR (Trucchia et al. 2020; Perello et al. 2024), testing the propagation process in any potential directions, and by selecting the maximum contribution as the worst-case scenario:
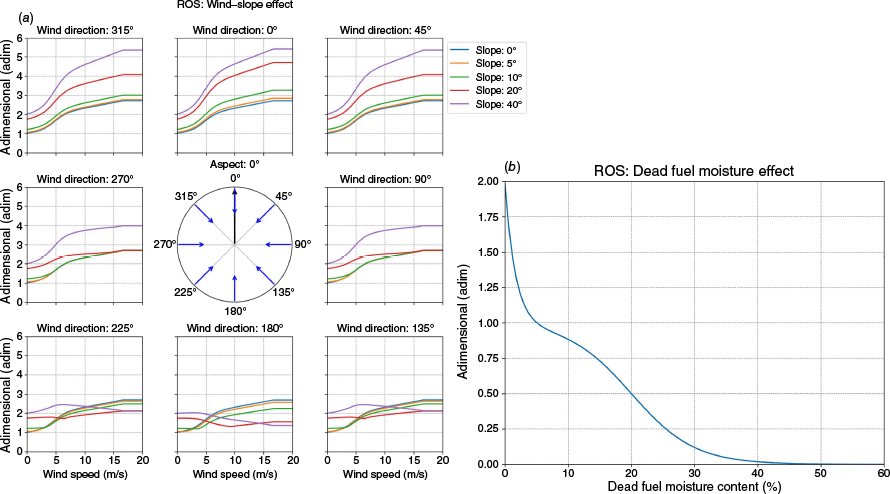
where Vs and Vw respectively are the adimensional slope and wind contributions, while is the propagation direction. See Trucchia et al. (2020) and the Supplementary material for more details – a graphic description of the W contribution can be found in Fig. 2a.
The wind–topography effect (a), and dead fuel moisture content effect (b) on the Rate of Spread index (ROS). In particular, in (a), the combined effect of wind direction and aspect is reported by fixing an aspect value (i.e. aspect 0°, black arrow in the central plot) and varying wind direction (blue arrows in the central plot) – the different plots represent different wind directions; in each, the combined effect of wind speed and slope contributions is highlighted.
The fuel moisture contribution is given by the formula:
where x is the DFMC expressed as a fraction between 0 and 1. The M index formulation has been tested over different settings, decreasing toward zero the ROS index for DFMC values greater than 40% (as tested in previous RISICO releases) and by increasing ν0 for very dry conditions (i.e. less than 5%) – see Fig. 2b.
Fire-Line Intensity (FLI) index
The FLI index highlights areas and times where fire intensity may hinder suppression efforts. It is computed based on the ROS and the fuel moisture content, as per Byram (1959):
where d (kg m−2) represents the fuel load and lhv the lower heating value (kJ kg−1). The model distinguishes two main fuel levels: the surface dead fuel component (identified by the index i = 0) and the live fuel and canopy component (identified by the index i = 1). This choice was driven by the need for simplification in the original development of the RISICO model and has been maintained; however, further subdivisions may be considered in future developments of the model. The lhv is computed according to the equation:
The higher heating value hhv (kJ kg−1) is defined for each fuel type, while ui refers respectively to the dead (i.e. the DFMC index) and the live fuel moisture content – the latter is considered fixed as the worst-case scenario for each fuel type. Despite this strong assumption, RISICO was designed to minimize data requirements, which were limited at the time. However, satellite-derived vegetation indices now offer proxies for live fuel moisture and will be integrated into future model updates. See Table 1 for parameter values.
RISICO fuel map
The complexity and heterogeneity of the fuel, the required spatial extent (e.g. regions or states) and data maintenance make data collection and management difficult, and this remains a major challenge in forest fire research (Abdollahi and Yebra 2023; Aragoneses et al. 2023). Therefore, the development and updates of the fuel map, crucial in RISICO, have been a key challenges. To support CP tasks, RISICO adopts a simplified fuel classification, assuming homogeneous fuel characteristics within types based on worst-case scenarios.
From the first release of the system, fuel classification was based on expert-based classification of land use classes, dividing them according to different expected wildfire behaviors as they have varying propensities for wildfire (see Fig. 3). This simplified and coarse fuel classification enhanced RISICO’s discrimination capabilities, as observed through many years of operational use.
The percentage of territory covered by different land use categories with respect to their percentage that experiences wildfires. The analysis covered the period 2007–2022. CORINE Land Cover maps were selected following their availability for the analyzed period (i.e. CORINE 2006; CORINE 2012; CORINE 2018 from SNPA (2024)). The burned areas considered correspond to the official burned areas presented in the paper (see Material and methods section). The land cover categories analyzed are limited to the burnable ones that cover more than 0.5% of the national territory.
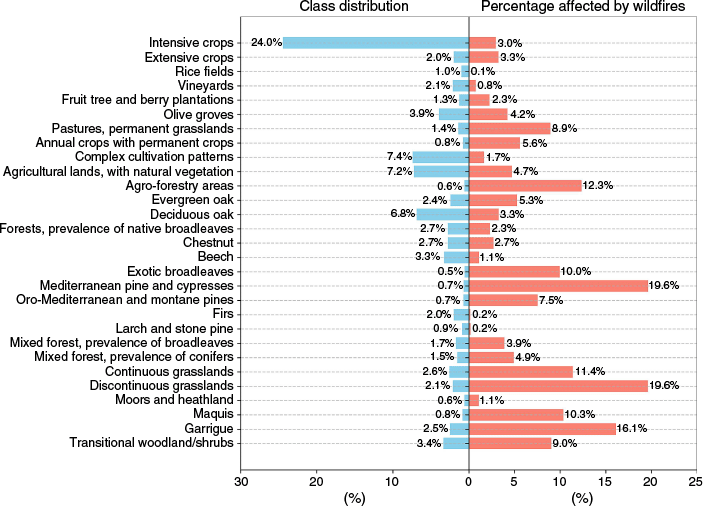
The same idea persists in the last release by dividing land cover categories into four general vegetation classes: Grassland and croplands (G), where surface fire behavior is expected; Broadleaves (B), where fire is less likely to turn into a crown fire; Shrubs (S), where bushfire can evolve into high-intensity behavior; and Conifers (C), where very high intensity fires can occur owing to crown fire transition and/or spotting. Class C can be also considered for species that exhibit similar extreme fire behavior to conifers, such as eucalyptus plantations – see the Discussion section (Ganteaume et al. 2021; Toy-Opazo et al. 2024). The map used for the present analysis was defined based on national CORINE 2018 IV level (SNPA 2024) – see Supplementary material for details. To reduce expert-based assessment, as done in previous releases, wildfire susceptibility (Tonini et al. 2020) has been added, intended as the ‘probability that fire occurs in a specific area without considering a temporal scale, assessed on the basis of predisposing factors related to terrain’s intrinsic characteristics’, from Leuenberger et al. (2018). Reflecting a territory’s predisposition to fire occurrence, it further enhances RISICO’s discrimination by dividing the four vegetation classes into low, medium and high susceptibility, resulting in 12 fuel classes (see Table 1).
The fuel types are finally converted into fuel models with specific parameters shown in Table 1. The DFMC and FLI fuel parameters depend mainly on four vegetation classes whereas susceptibility adjusts the v0 parameter, reducing it by 10% and further 30% for medium and low susceptibility classes, respectively.
The values associated with the different parameters come from years of optimization of the RISICO system, and so they were adopted in the latest RISICO release. The optimization of these parameters lies beyond the scope of this paper.
The susceptibility map was obtained through the methodology proposed by Tonini et al. (2020), Trucchia et al. (2022) and Trucchia et al. (2023), adopting the Machine Learning (ML) Random Forest (RF, Breiman 2001) algorithm. A 100 m resolution pan-European susceptibility map was produced exploiting the EFFIS (European Forest Fire Information System) (San-Miguel-Ayanz et al. 2012) wildfire database from 2008 to 2022 to overcome the limited extent of the time span for susceptibility analysis (https://forest-fire.emergency.copernicus.eu). Different explanatory variables were considered, namely land cover, topography and climatic information listed in Table 2. The procedure for susceptibility analysis is detailed in the Supplementary material.
| Susceptibility predisposing factors | ||
|---|---|---|
| Topographic variables | Elevation | |
| Slope | ||
| North and east direction (aspect) | ||
| Land cover variables | Vegetation type | |
| Tree cover density | ||
| Neighboring vegetation | ||
| Climatic variables | Annual average temperature (43-year average) | |
| Annual average maximum daily temperature (43-year average) | ||
| Annual cumulative precipitation (43-year average) | ||
| Annual average wind speed (43-year average) | ||
| Annual maximum consecutive dry days (43-year average) | ||
| Annual maximum consecutive wet days (43-year average) | ||
| Annual relative humidity (43-year average) | ||
To retrieve the susceptibility classes needed for fuel mapping in Italy, the 25th and 75th percentiles at the national level were adopted to identify low and high classes, respectively. This type of classification aims to narrow down the areas where resources should be prioritized for operational purposes at the national level, highlighting the differences between wildfire spreading potentials (see Results section).
Different modeling choices can be made for further differentiation within a territory – this aspect, however, lies beyond the scope of this paper.
Model performance assessment
RISICO was compared with FFDR indices from the literature (see Table 3) – a description of the different indices can be found in Swiss Federal Institute of Forest, Snow and Landscape Research WSL (2012), from which the indices were retrieved. The comparison analysis used the CHAPTER weather dataset, derived from ERA5 via Weather Research and Forecasting (WRF) model downscaling, considering ~3 km spatial and 1-h temporal resolution (Tartaglione et al. 2024). A reanalysis was used to reduce reliance of index performance on forecast skills (Di Giuseppe et al. 2016). RISICO incorporates topography and fuel, whereas most indices rely solely on weather data and possibly on some climate information calculated from CHAPTER. The analysis was conducted at a 1 km spatial resolution, consistent with RISICO’s operational implementation, rescaling the fuel map and adopting the most representative value in each cell. Topographic information (i.e. slope and aspect) was obtained from the Multi-Error-Removed Improved Terrain digital elevation model (MERIT DEM; Yamazaki et al. 2017), reported at 1 km resolution. The temporal resolution was daily, based on wildfire finer temporal information, i.e. ignition dates. Hourly indices were aggregated to a daily scale by averaging values above the 75th percentile or below the 25th percentile for low-value fire-related indices such as RISICO-DFMC, Angstrom, Sharples Fuel Moisture Index (FMI), Orieux Water Reserve (WR) – this method follows an established methodology from operational RISICO implementation (see RISICO system section). Although other percentiles could be used, this choice ensures consistency with standard RISICO practice across all hourly indices, leaving refinements for future studies.
| FFDR Index | Reference | Temporal resolution | With memory | Dynamic inputs | Static inputs | |||||||||
|---|---|---|---|---|---|---|---|---|---|---|---|---|---|---|
| T | RH | Ws | Wd | R | S | Top. | Fuel | MR | HI | |||||
| RISICO (DFMC, ROS, FLI, W) | Present paper | Hourly | Yes | ✓ | ✓ | ✓ | ✓ | ✓ | ✓ | ✓ | ✓ | |||
| FWI (FFMC, DMC, DC, ISI, BUI, FWI) | Van Wagner and Pickett (1985) | Daily | Yes | ✓ | ✓ | ✓ | ✓ | |||||||
| Mark5 FFDI | McArthur (1967) | Daily | Yes | ✓ | ✓ | ✓ | ✓ | ✓ | ||||||
| FFWI | Fosberg (1978) | Hourly | No | ✓ | ✓ | ✓ | ||||||||
| Sharples (FMI, F) | Sharples et al. (2009) | Hourly | No | ✓ | ✓ | ✓ | ||||||||
| HDW | Srock et al. (2018) | Hourly | No | ✓ | ✓ | ✓ | ||||||||
| Angstrom | Chandler et al. (1983) | Daily | No | ✓ | ✓ | |||||||||
| Orieux WR | Orieux (1974) | Daily | Yes | ✓ | ✓ | ✓ | ||||||||
| Nesterov | Nesterov (1949) | Daily | Yes | ✓ | ✓ | ✓ | ||||||||
The different dynamic (temperature T, relative humidity RH, wind speed Ws, wind direction Wd, rain R, snow S) and static (topography, fuel, mean annual rain MR, and heat index HI) inputs of the FFDR indices are presented, together with their characteristics in terms of time resolution, and presence of memory components.
All indices were implemented in Rust and made openly available on GitHub (see Data availability section). The indices were run starting from 2006 to allow for a 1-year transition period, conducting the analysis for 2007–2022 using Italian wildfire data.
Since the early 2000s, Italy has been collecting burned area data through ground-retrieved polygons at the regional level.4 A consistent dataset of 102,904 wildfires from 2007 to 2022, including ignition dates, was used for the analysis in this paper.
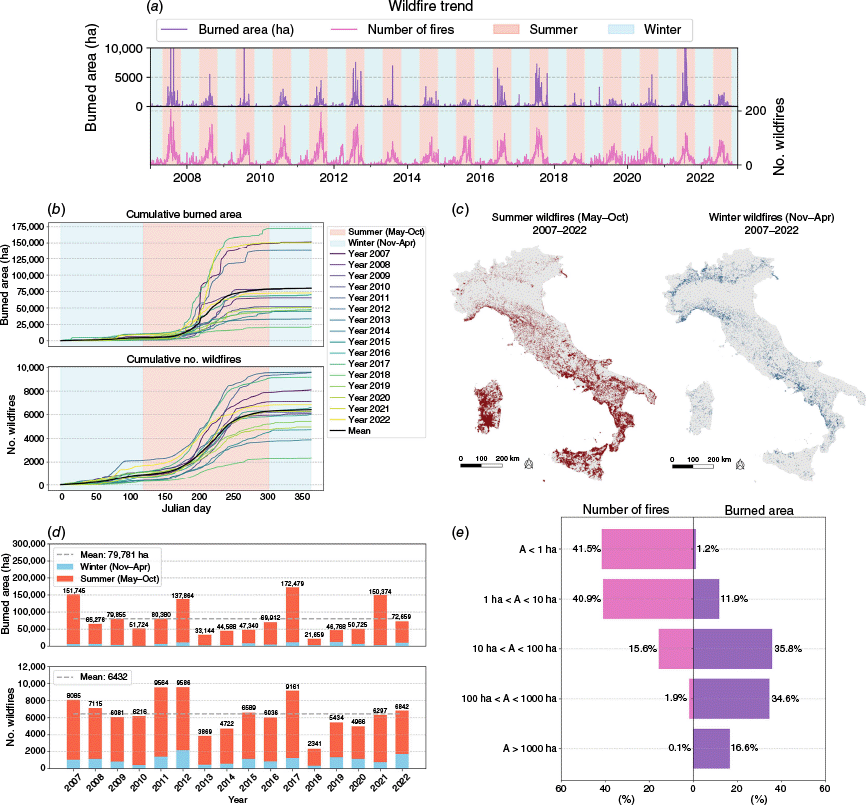
Italy experiences an average of 79,781 ha burned and 6432 wildfires annually, with extreme wildfire years occurring every 4–5 years (Fig. 4d). Wildfires peak in two seasons: winter (November–April) in the Temperate zone (Northern and Central Italy) and summer (May–October) in the Mediterranean zone (coastal and southern Italy), see Fig. 4c. Summer accounts for most fires (Fig. 4b). Although large fires (over 100 ha) represent just 2% of events, they account for 50% of the burned area and are the primary operational concern (Fig. 4e).
Summaries of burned area and number of wildfires occurring in Italy from 2007 to 2022. (a) Daily trend of total burned area and number of wildfires for the entire period 2007–2022 (note: the burned area y-scale has been set to a maximum of 10,000 ha for the sake of plotting; however, some years had values out of the range: 23,838 ha in 2007 (23 July 2007); 34,219 ha in 2009 (23 July 2009); 12,981 ha in 2021 (23 July 2021); the reference date corresponds to the wildfire ignition date). (b) Cumulative burned area and number of wildfires through the year for the whole period. (c) Burned areas locations are divided into the main wildfire seasons, namely, summer and winter. (d) Total burned area and number of fires per year, divided into summer and winter seasons. (e) Wildfire contributions to number of fires and burned area when classified into five size categories according to their extent: under 1 ha, 42,719 fires; 1–10 ha, 42,071; 10–100 ha, 16,097; 100–1000 ha, 1921; over 1000 ha, 96.
The FFDR indices were evaluated against past wildfire events by selecting pixels at least 70% burnt to ensure relevance and reduce edge effects. Values were taken on the wildfire ignition date, though this approach may not fully capture the duration of large, multi-day fires. Pixels classified as ‘non-fire’ were unaffected on that date, subsequently used for testing detection capability. Only wildfires larger than 70 ha were included owing to the 1 km resolution and selection criteria.
As noted by Di Giuseppe et al. (2016), FFDR indices should associate extreme values with wildfire activity. This was tested using the rank-percentile method (Eastaugh et al. 2012), which provides a non-parametric measure useful to compare fire indices considering their different distributions. It consists in fitting the ranked percentiles of the fire values with the Theil-Sen technique (Theil 1950; Sen 1968) to reduce outliers impact: a good index should be fitted by a zero-slope line with intercept equal to 100. Note that the percentiles were computed as inverse values from the complementary cumulative distribution function for indices where fire activity was associated with lower values. Along with their discrimination capability, Receiver Operating Characteristic (ROC) curves were generated together with the Area Under the Curve (AUC) to test indices detection capability (Mas et al. 2013; Richardson et al. 2024).
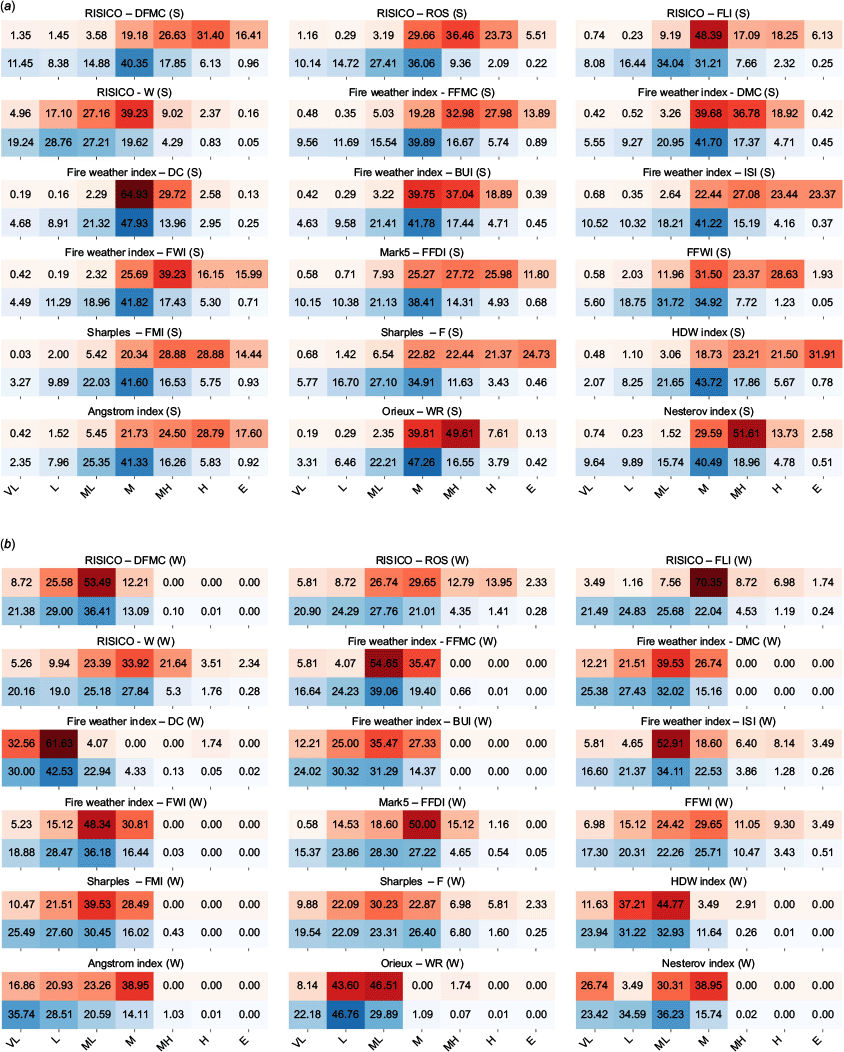
An important aspect of testing FFDR indices for operational use is comparing the percentage of territory classified into fire danger classes (Sirca et al. 2018) with wildfire classifications. A robust index should minimize large high-risk areas while accurately categorizing wildfire events. The analysis evaluated the territorial coverage of each class over time, examining the mean percentage of territory classified on wildfire days (i.e. when wildfires pixels were selected). This helps assess how well the index supports resource management, as too much high-risk territory complicates prioritization. Danger classes were defined using the same percentiles for all the indices, as commonly used (de Jong et al. 2016) (see Table 4) - the percentiles were based on RISICO’s operational implementation to carry out comparisons between FFDR indices.
| Danger classes | ||||||||
|---|---|---|---|---|---|---|---|---|
| Very low (VL) | Low (L) | Medium–low (ML) | Medium (M) | Medium–high (MH) | High (H) | Extreme (E) | ||
| Percentiles (higher fire-related values) | P0–P25 | P25–P50 | P50–P75 | P75–P95 | P95–P99 | P99–P99.9 | P99.9–P100 | |
| Percentiles (lower fire-related values) | P75–P100 | P50–P75 | P25–P50 | P5–P25 | P1–P5 | P0.1–P1 | P0–P0.1 | |
Most of the indices associate wildfire with higher values, then using the higher percentiles to define danger classes (first row), whereas others (i.e. RISICO-DFMC; Angstrom; Sharples-FMI; Orieux) associate lower values with wildfire (second row).
The proposed analysis differentiates between summer and winter wildfire seasons as defined above, based on Italian wildfire regimes.
Results
Fuel map analysis
The susceptibility model showed good performance at the European level with an AUC of 0.89, mean squared error (MSE) of 0.14 and accuracy of 0.81. The Gini impurity index (see Supplementary material) identified vegetation continuity as the most important variable, followed by temperature and relative humidity, consistent with similar studies (e.g. Trucchia et al. 2022). For Italy (see Fig. 5a), the susceptibility map was analyzed using the Italian wildfire dataset, observing wildfire occurrence (i.e. burned area locations) aligning with higher susceptibility areas as expected from the purpose of the map. The analysis also considered different wildfire size classes (see Fig. 5c), revealing a clear distinction resulting from susceptibility, with larger wildfires found in the highest quartile. This emphasized the discriminative capability of the susceptibility map not only in identifying fire-prone areas, but also in distinguishing between areas with higher or lower potential for fire spread, supporting its use in fire spread assessment using the ROS module.
Analysis of susceptibility and fuel maps for Italy. (a) Susceptibility map; (b) fuel map. (c) Distribution of susceptibility values compared with those obtained in the case of wildfire pixels (top plot). Also, the values distribution is shown with respect to wildfire extent classes (bottom plot - A refers to burned area). (d) Percentage of national coverage of each fuel class compared with their percentage affected by past wildfires.
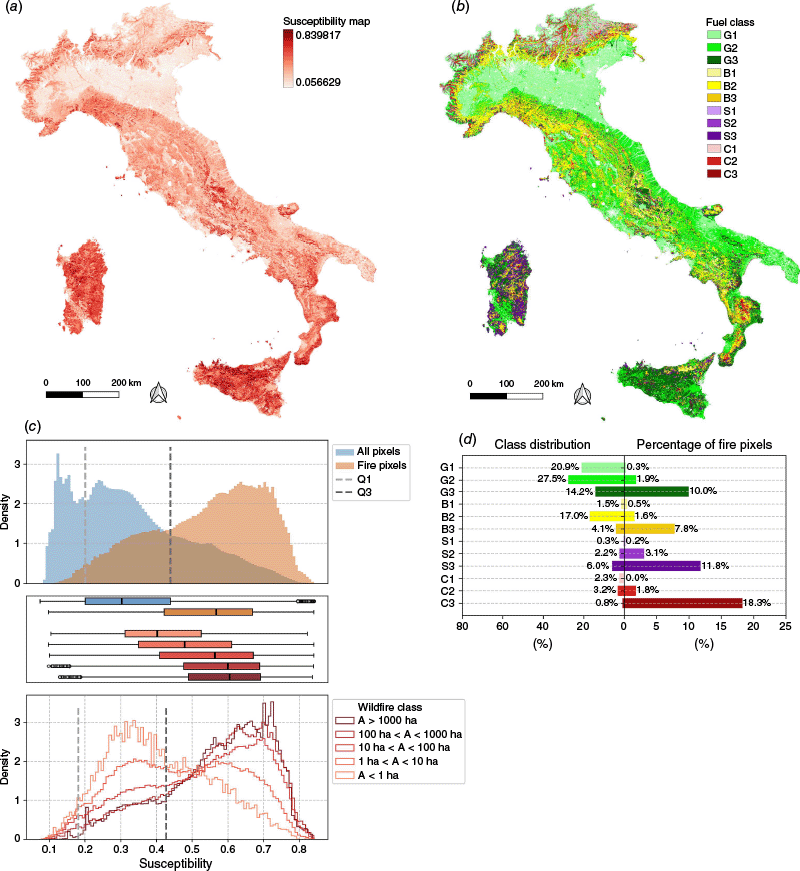
The final fuel map is then presented in Fig. 5b. A comparison between fuel class distribution and percentage burnt (Fig. 5d) highlights the map’s ability to prioritize areas: it identifies classes (i.e. highly susceptible shrublands and conifers) that account for a limited area but are most affected by wildfires.
Model performance
The rank-percentile analysis is shown in Fig. 6, with index distributions and discrimination diagrams shown in the Supplementary material. In the seasonal analysis, the ranking is computed with respect to seasonal indices distributions because indices may show strong seasonal variation. However, FFDR indices should maintain strong discrimination capability across seasons.
The rank-percentile points (solid lines) and fitted curves (dashed lines) for the whole dataset (in blue) and divided between summer (S - in orange) and winter (W - in purple) fire seasons. The slope and intercept of each curve are also reported in each plot (the couples of numbers reported in the bottom-right part of each plot).
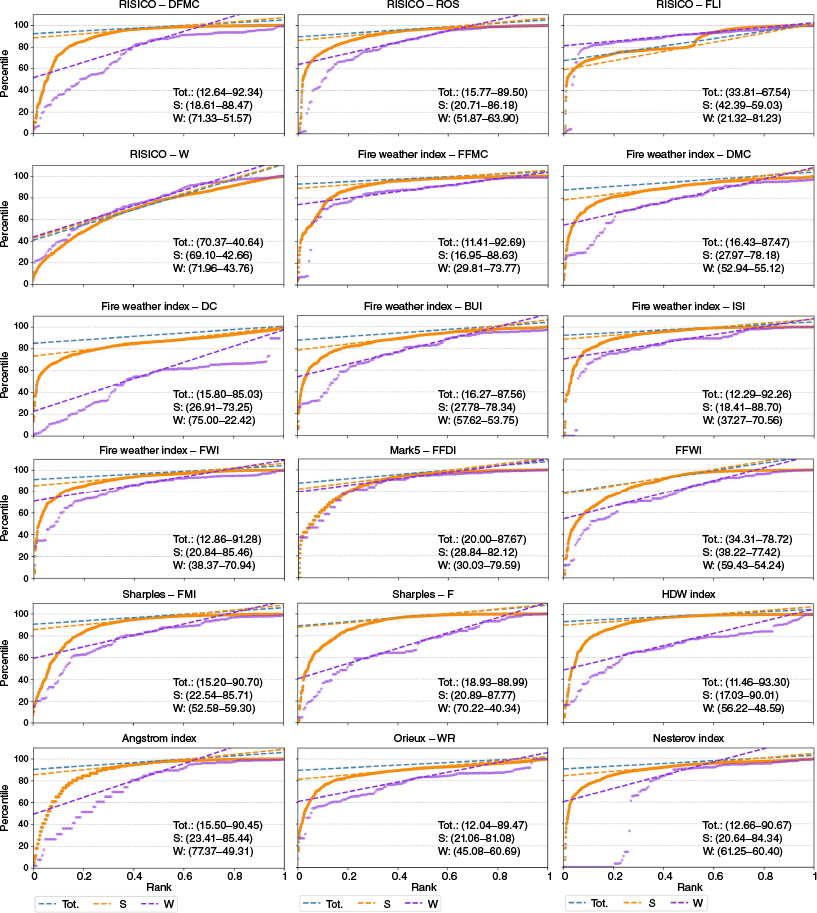
Among the RISICO indices, DFMC shows the best overall discrimination (see slopes and intercepts in Fig. 6), outperforming others like ROS. However, DFMC’s performance decreases in winter, whereas other indices, like FLI, remain more stable and even improve in winter. All indices, except FLI, show reduced discrimination in winter. The W index, as a sub-model of ROS, shows poor discrimination – it is intended to be useful operationally once a wildfire starts to assess wind impact. The ROS and FLI indices, commonly used in RISICO, perform well, comparable with other benchmarks like FWI and FFDI.
The ROC curves and AUC values are shown in Fig. 7 and summarized in Table 5. Among the RISICO indices, ROS has higher AUC values for the entire period and summer, whereas FLI performs better in winter. As noted, W has poor detection capability. All FFDR indices except FLI show decreased performance in winter. However, ROS outperforms other FFDR indices in both overall and seasonal cases, whereas DFMC and FLI have AUC values comparable with other benchmarks like FWI and FFDI.
The ROC curves for the different indices for the whole dataset (in blue), and divided between summer (S - in orange) and winter (W - in purple) fire periods. The AUC values of each curve are also reported in each plot (number in the bottom-right part of the plot). The dotted grey line represents the threshold above which the ROC curve should lie to indicate acceptable model performance.
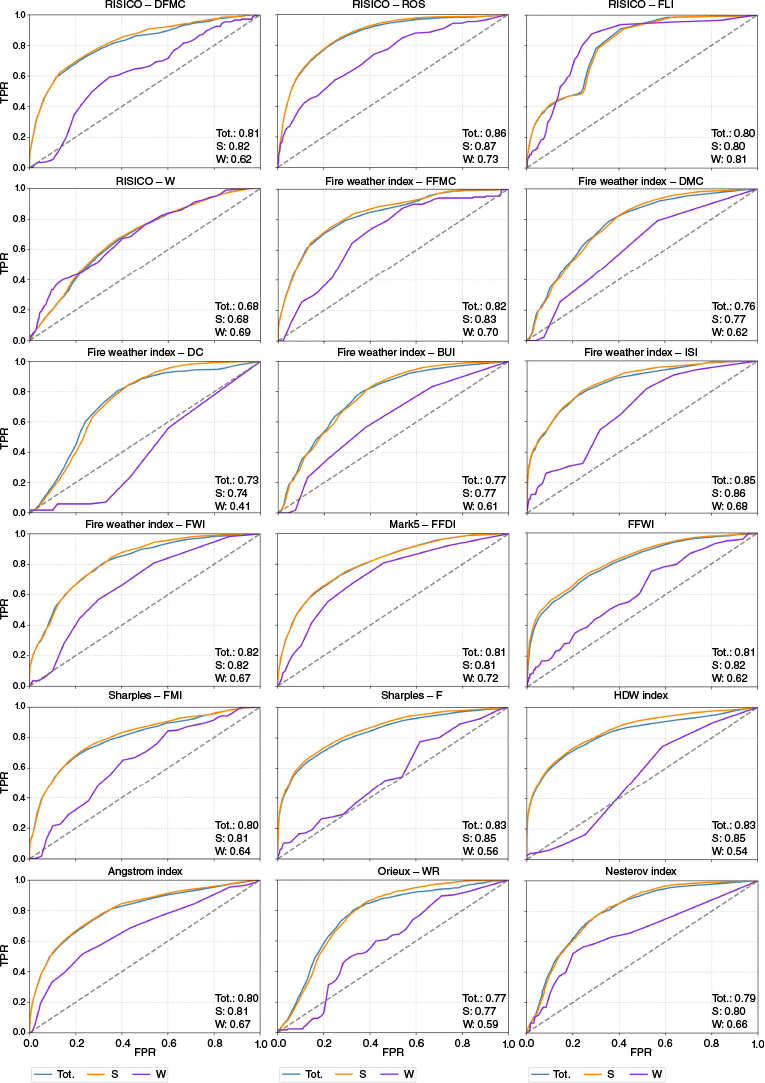
| Index | AUC | Area vs fire pixel classification (H + E) | ||||||||
|---|---|---|---|---|---|---|---|---|---|---|
| Tot | Summer | Winter | ||||||||
| Tot. | S | W | Area (%) | Fire (%) | Area (%) | Fire (%) | Area (%) | Fire (%) | ||
| RISICO – DFMC | 0.81 | 0.82 | 0.62 | 6.24 | 45.30 | 7.09 | 47.81 | 0.01 | 0.00 | |
| RISICO – ROS | 0.86 | 0.87 | 0.73 | 2.24 | 28.56 | 2.32 | 29.24 | 1.69 | 16.28 | |
| RISICO – FLI | 0.80 | 0.80 | 0.81 | 2.43 | 23.55 | 2.57 | 24.37 | 1.43 | 8.72 | |
| RISICO – W | 0.68 | 0.68 | 0.69 | 1.02 | 2.71 | 0.88 | 2.53 | 2.04 | 5.85 | |
| FWI – FFMC | 0.82 | 0.83 | 0.70 | 5.84 | 39.68 | 6.64 | 41.88 | 0.01 | 0.00 | |
| FWI – DMC | 0.76 | 0.77 | 0.62 | 4.55 | 18.33 | 5.17 | 19.34 | 0.00 | 0.00 | |
| FWI – DC | 0.73 | 0.74 | 0.41 | 2.82 | 2.66 | 3.20 | 2.71 | 0.07 | 1.74 | |
| FWI – BUI | 0.77 | 0.77 | 0.61 | 4.54 | 18.27 | 5.16 | 19.28 | 0.00 | 0.00 | |
| FWI – ISI | 0.85 | 0.86 | 0.68 | 4.17 | 44.96 | 4.53 | 46.81 | 1.54 | 11.63 | |
| FWI – FWI | 0.82 | 0.82 | 0.67 | 5.29 | 30.45 | 6.01 | 32.14 | 0.00 | 0.00 | |
| Mark5 – FFDI | 0.81 | 0.81 | 0.72 | 5.02 | 35.86 | 5.62 | 37.78 | 0.60 | 1.16 | |
| FFWI | 0.81 | 0.82 | 0.62 | 1.60 | 29.63 | 1.29 | 30.56 | 3.95 | 12.79 | |
| Sharples – FMI | 0.89 | 0.81 | 0.64 | 5.88 | 41.05 | 6.68 | 43.33 | 0.00 | 0.00 | |
| Sharples – F | 0.83 | 0.85 | 0.56 | 3.64 | 44.11 | 3.89 | 46.10 | 1.85 | 8.14 | |
| HDW | 0.83 | 0.85 | 0.54 | 5.68 | 50.61 | 6.45 | 53.42 | 0.01 | 0.00 | |
| Angstrom | 0.80 | 0.81 | 0.67 | 5.94 | 43.95 | 6.75 | 46.39 | 0.01 | 0.00 | |
| Orieux – WR | 0.77 | 0.77 | 0.59 | 3.70 | 7.33 | 4.20 | 7.74 | 0.01 | 0.00 | |
| Nesterov | 0.79 | 0.80 | 0.66 | 4.66 | 15.46 | 5.29 | 16.31 | 0.00 | 0.00 | |
The percentage area of Italy classified into different danger classes focuses on ROS, FWI and FFDI in the following figures, with additional analysis in the Supplementary material. Fig. 8 highlights the High (H) and Extreme (E) classes daily evolution, focusing on areas above the 99th percentile. ROS shows less seasonality than FWI and FFDI. ROS classifies a smaller area in higher classes (under 5% for High and 0.5% for Extreme) in summer compared with FWI and FFDI, which show peaks above 10% for High and 2% for Extreme classes. FLI shows similar behavior to ROS, whereas DFMC exhibits strong seasonality with a greater area classified in higher danger classes, like FWI. Analyzing the other indices, FFWI and Sharples-F show weak seasonality and behave similarly to ROS and FLI.
The daily areas classified into High (H - in red) and Extreme (E - in black) danger classes, resampled as average weekly values, are reported for the ROS, FWI and FFDI indices, highlighting summer (S - in orange) and winter (W - in purple) fire periods.
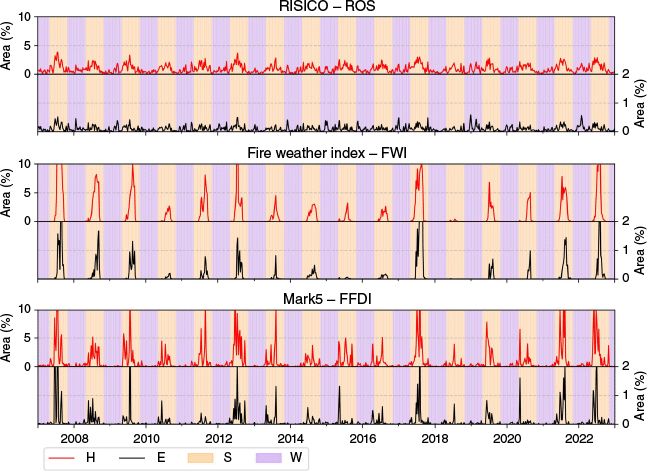
Fig. 9 summarizes the mean area classified into each danger class during wildfire days, comparing the percentage of Italian territory with how wildfires were classified in each danger class for summer and winter periods. The overall period is reported in the Supplementary material. The sum of High and Extreme classes is also reported in Table 5. ROS and FLI indices classify limited territory, especially in the Extreme class, but effectively categorize fire pixels in higher danger classes. For instance, in summer, ROS classifies 2.32% of the territory in High and Extreme classes, containing 29.24% of fire pixels, whereas FWI classifies 6.01% of the territory with 32.14% of fire pixels. ROS reduces the classified area by over 50% while maintaining similar fire pixel classification. Considering also the Medium-High (MH) class, ROS classified 11.68% of the area with 65.7% of fire pixels, while FWI classified 23.44% with 71.37%. FFWI shows better performance in summer compared with other indices, which instead present similar behavior to the FWI. In winter, ROS still performs well, classifying 1.69% of the territory with 16.28% of fire pixels. Most fire danger indices do not classify areas in higher classes, except for ISI, FDI and FFWI. Among these, ROS classifies more fire pixels in higher classes. DFMC shows weaker performance in winter, whereas FLI performs similarly to ISI.
Discussion
Fuel information, crucial for RISICO, posed a significant challenge during the model’s development. The latest approach evolved to use minimal data to enhance the model’s discrimination capability as is usually done in the CP context where models must balance simplicity, effectiveness and efficiency of information to enhance their implementation and usage. This is particularly important in fuel mapping, where data scarcity and the difficulty in obtaining consistent, up-to-date information present significant challenges (Abdollahi and Yebra 2023; Aragoneses et al. 2023).
The concept of fuel is naturally linked to fire behavior, but how this information is represented depends on the specific model used, with practical implications for the type of data required for fuel classification, as well as the methods and feasibility of collecting such data. In RISICO, information about wildfire susceptibility (Trucchia et al. 2023) combined with vegetation types was sufficient for fuel classification. This approach allows an economy of information required, as shown in the present research.
Among the proposed methods in the literature for susceptibility, the ML technique offers a good balance between model complexity, performance and data requirements – all data used for the proposed susceptibility analysis are open-source. The use of an ML model at the European scale addresses the challenge of limited burned area time series by expanding the spatial scope. However, more fire regime-specific susceptibility models could be considered – this will be explored in future studies.
The simplified fuel classification was also developed to facilitate easier generalization of the approach across different contexts, serving as a bridge between a data-driven approach and expert-based insights. On one hand, ML-based susceptibility allows the inclusion of local landscape characteristics that influence fire activity by analyzing past events within the study area. On the other hand, expert-based insights on vegetation classes make it possible to incorporate local characteristics of fire behavior. In Italy, for instance, distinguishing between conifers and broadleaves is essential, as they exhibit markedly different fire behaviors. In other contexts, this distinction may need to be modified– for example, eucalyptus, although a broadleaf species, shows fire behavior similar to that of Mediterranean conifers, being highly flammable (Ganteaume et al. 2021) and prone to crown fires. To better support the extension of the approach, it may be more effective to classify vegetation based on species flammability to better reflect the vegetation’s role in fire behavior (for instance, distinguish between ‘low’ and ‘highly’ flammable forests) rather than the division proposed. This aspect will be addressed in future studies. The main reason why expert-based insights are needed is the lack of observation of fire behavior during the events. Despite some information that can be retrieved from geostationary Earth Observations (EO) (Calle et al. 2006; Eumetsat 2019), the spatial resolution is not adapted to the scale of the present work. This is in general the area where technological development and harmonized approaches are needed to improve data collection, which can have a great effect on fuel mapping but also in the validation and calibration of simulation modeling. The use of unmanned aerial vehicles (UAVs) or other innovative geostationary platforms capable of collecting high spatial and temporal resolution data on fire behavior under different weather, topographical and fuel conditions will play a critical role in future research.
Finally, in RISICO, fuel information is encapsulated by assigning fuel-specific parameters. These were based on previous RISICO versions and refined through calibration during operational use. Optimizing these parameters, particularly for improving model performance, will be a focus for future studies.
After defining the model and fuel, RISICO performance was tested against well-known FFDR indices from the literature. This type of analysis is widely explored in the literature but lacks a standardized approach (Eastaugh et al. 2012). Various methods were tested, focusing on simplicity in both the methodology and the interpretation of results.
Many challenges arise in FFDR indices performance analysis, and further reflection would be required in future studies to propose possible standards. A fundamental aspect in FFDR performance analysis is defining an ‘event’ (i.e. true positive). Although FFDR indices indicate potential wildfire danger, wildfire occurrence depends on a stochastic process requiring an ignition source. Thus, a false positive may reflect observed danger conditions but lacking an ignition. This intrinsic aspect of wildfires raises conceptual challenges for validating these indices. Here, the analysis followed the common approach of comparing indices outputs with wildfire occurrences.
Having both the ignition date and wildfire location becomes crucial for analyzing spatialized FFDR indices. However, satellite-derived datasets, often used in wildfire research, may introduce biases due to mismatches between detection and ignition dates. Ground-retrieved data, as used in the present analysis, can help mitigate this issue.
Additionally, wildfire duration is often overlooked, which is critical for large fires lasting several days when the ignition date may not align with critical conditions. In this study, the ignition date was adopted based on data availability.
Furthermore, for RISICO and similar indices, the goal of indicating potential fire behavior, with consequent implications for wildfire management, often conflicts with the limited availability of detailed data. Although burned area databases are more accessible, dynamic data like daily burned area, propagation speed and intensity remain rare and region-specific (Benali et al. 2023). As a result, the present analysis focused on evaluating the model’s ability to detect and discriminate ignition dates without directly assessing fire dynamics or differentiating among wildfire events to focus on extreme events. This aspect should be further explored in future studies – for example, by considering a proxy of fire behavior such as the final burned area to differentiate wildfires based on their size, or by potentially considering firefighting efforts during the event.
RISICO indices, particularly the reference ROS index, along with DFMC and FLI, demonstrate detection capabilities comparable with or better than those of other indices in the literature. In contrast, the W index performs worst owing to its focus on a single component of potential fire behavior, being thus mostly a component of the ROS index.
Given Italy’s varied fire regimes, evaluating indices’ performance across wildfire seasons is essential. This analysis distinguishes between summer and winter seasons, revealing significant performance differences among indices. The month-based seasonal division was a simplification for the analysis.
Among RISICO indices, DFMC exhibits the greatest seasonal variation, reflecting its sensitivity to precipitation and air humidity. As noted by Perello et al. (2025), DFMC performance tends to decline in winter. To improve RISICO’s winter performance, incorporating factors like fuel and wind conditions is crucial, as demonstrated by ROS and especially FLI, which outperform DFMC and other analyzed indices.
To expand the analysis to different fire regimes, seasonality’s regional impact should also be considered in index evaluation, as will be done in future studies.
This paper also highlights the importance of indices in accurately classifying small high-risk areas, crucial for operational use. Overgeneralization complicates resource allocation and risk management, especially for strong seasonal indices like FWI, which may generate excessive alerts during fire seasons. RISICO’s ROS and FLI indices demonstrate good performance, effectively limiting alerted areas while maintaining strong detection and classification capabilities. The inclusion of a fuel map, based on susceptibility, helps in reducing alerts in areas and introduces territorial differentiation without relying on additional meteorological data. By combining all the fire-related factors, the model can discriminate spatial-temporal conditions where the interplay of fuel, weather and topography is likely to enhance fire activity. Furthermore, the hourly wildfire danger assessment provided by RISICO enables more precise identification of these conditions, also improving its usability for various wildfire risk management tasks, such as assessing wildfire danger during events or prescribed fires – this will be further tested in future studies.
Finally, certain aspects of the RISICO model can be further refined to improve its performance. One key area is the use of satellite data to estimate fuel moisture content, particularly for live fuel, shifting from a worst-case scenario approach to one that better reflects observed conditions. This aspect will be explored in future studies.
Conclusion
The growing awareness of human influence on fire regimes and the often disastrous consequences have driven the need for increasingly efficient EWSs. However, this demand must balance with the need for models requiring limited data, as data efficiency is crucial for EWS implementation in civil protection contexts. This study presents RISICO, an FFDR system originally developed for the Italian CP system supporting early warning. The balance between scientific accuracy and operational practicality in terms of usage and implementation represents the key feature of the model. After two decades of operational use, RISICO has been refined based on user feedback. This paper introduces its latest version, featuring the integration of a simplified fuel classification and an hourly temporal resolution, enhancing wildfire danger assessment.
Given the challenges of acquiring fuel data, RISICO adopts a tailored fuel classification approach, leveraging wildfire susceptibility derived using machine learning techniques applied to open datasets, as done in this study. This method enables fuel classification without impractical ground sampling, allowing easier model implementation for CP purposes and meanwhile improving the model’s ability to discriminate fire-prone conditions. Moreover, the classification allows for a reasonable degree of generalizability across different contexts. Comparative analysis with other FFDR indices highlights RISICO’s effectiveness.
Despite these strengths, challenges remain, especially in standardizing FFDR index validation and incorporating actual wildfire behaviors. Furthermore, additional developments in the model, particularly in estimating live fuel moisture conditions with satellite data and adopting more fire regime-specific ML models, could enhance its performance. The features introduced by the RISICO model present an improvement for wildfire EWSs, which can enhance preparedness and resource allocation, helping to mitigate future extreme wildfire events.
Data availability
The RISICO code and the other FFDR indices implementation in the Rust program language can be found at https://github.com/CIMAFoundation/risico-2023 (verified 29 January 2025). The data that support this study will be shared on reasonable request to the corresponding author.
Declaration of funding
This research was funded by the Italian Civil Protection Department Presidency of the Council of Ministers, through the convention with the CIMA Research Foundation for the development of knowledge, methodologies, technologies and training, useful for the implementation of national systems of monitoring, prevention and surveillance.
Acknowledgements
This publication was prepared using European Union’s Copernicus Land Monitoring Service information. Data have been obtained through the European Forest Fire Information System – EFFIS (https://forest-fire.emergency.copernicus.eu) of the European Commission Joint Research Centre. The authors acknowledge the Italian Civil Protection Department - Presidency of the Council of Ministers, who funded this research through the convention with the CIMA Research Foundation, for the development of knowledge, methodologies, technologies, and training, useful for the implementation of national wildfire systems of monitoring, prevention, and surveillance. We thank the reviewers for their constructive feedbacks which helped in increasing the readibility and completeness of this manuscript. Special thanks to all users - local, regional, national and international - for their insights and feedback on the model’s operational use, which helped identify gaps and areas for improvement. We sincerely thank Riccardo Minciardi and Francesco Gaetani for their invaluable support and insightful discussions throughout the development of the original model. We sincerely thank Lisa Bernini for her constructive discussions and technical support, which contributed to the development of this study.
References
Abdollahi A, Yebra M (2023) Forest fuel type classification: review of remote sensing techniques, constraints and future trends. Journal of Environmental Management 342, 118315.
| Crossref | Google Scholar | PubMed |
Alexander ME, Lee BS, Lee CY (1984) Hourly calculation of the Fine Fuel Moisture Code, Initial Spread Index, and Fire Weather Index with the Texas Instruments model 59 hand-held calculator. Study NOR-5-191, File Report 7. 19 p. (Department of Agriculture, Ministry of State for Forestry, Canadian Forestry Service, Northern Forest Research Centre: Edmonton, Alberta)
Aragoneses E, García M, Salis M, Ribeiro LM, Chuvieco E (2023) Classification and mapping of European fuels using a hierarchical, multipurpose fuel classification system. Earth Sysem Science Data 15, 1287-1315.
| Crossref | Google Scholar |
Ascoli D, Vacchiano G, Scarpa C, Arca B, Barbati A, Battipaglia G, Elia M, Esposito A, Garfì V, Lovreglio R, Mairota P, Marchetti M, Marchi E, Meytre S, Ottaviano M, Pellizzaro G, Rizzolo R, Sallustio L, Salis M, Sirca C, Valese E, Ventura A, Bacciu V (2020) Harmonized dataset of surface fuels under Alpine, temperate and Mediterranean conditions in Italy. A synthesis supporting fire management. iForest 13, 513-522.
| Crossref | Google Scholar |
Baghino F, Gissi E, Perello N, Fiorucci P (2024) Operational application of mathematical modeling for enhanced wildfire risk management in Liguria. IFAC-PapersOnLine 58(2), 61-66.
| Crossref | Google Scholar |
Benali A, Guiomar N, Gonçalves H, Mota B, Silva F, Fernandes PM, Mota C, Penha A, Santos J, Pereira JMC, Sá ACL (2023) The Portuguese Large Wildfire Spread database (PT-FireSprd). Earth System Science Data 15, 3791-3818.
| Crossref | Google Scholar |
Breiman L (2001) Random forests. Machine Learning 45, 5-32.
| Crossref | Google Scholar |
Calle A, Casanova JL, Romo A (2006) Fire detection and monitoring using MSG Spinning Enhanced Visible and Infrared Imager (SEVIRI) data. Journal of Geophysical Research Atmospheres 111(G4), G04S06.
| Crossref | Google Scholar |
Carlucci M, Zambon I, Colantoni A, Salvati L (2019) Socioeconomic development, demographic dynamics and forest fires in Italy, 1961–2017: a time-series analysis. Sustainability 11, 1305.
| Crossref | Google Scholar |
Castel-Clavera J, Pimont F, Opitz T, Ruffault J, Barbero R, Allard D, Dupuy J-L (2025) A comparative analysis of fire-weather indices for enhanced fire activity prediction with probabilistic approaches. Agricultural and Forest Meteorology 361, 110315.
| Crossref | Google Scholar |
Castellnou M, Prat-Guitart N, Arilla E, Larrañaga A, Nebot E, Castellarnau X, Vendrell J, Pallàs J, Herrera J, Monturiol M, Cespedes J, Pagès J, Gallardo C, Miralles M (2019) Empowering strategic decision-making for wildfire management: avoiding the fear trap and creating a resilient landscape. Fire Ecology 15, 31.
| Crossref | Google Scholar |
De Angelis A, Ricotta C, Conedera M, Pezzatti GB (2015) Modelling the meteorological forest fire niche in heterogeneous pyrologic conditions. PLoS One 10(2), e0116875.
| Crossref | Google Scholar | PubMed |
de Groot WJ, Wotton BM, Flannigan MD (2015) Wildland fire danger rating and early warning systems. In ‘Wildfire Hazards, Risks and Disasters’. (Eds JF Shroder, D Paton) pp. 207–228. (Elsevier) 10.1016/B978-0-12-410434-1.00011-7
de Jong MC, Wooster MJ, Kitchen K, Manley C, Gazzard R, McCall FF (2016) Calibration and evaluation of the Canadian Forest Fire Weather Index (FWI) System for improved wildland fire danger rating in the United Kingdom. Natural Hazards and Earth System Sciences 16, 1217-1237.
| Crossref | Google Scholar |
Di Giuseppe F (2023) Accounting for fuel in fire danger forecasts: the fire occurrence probability index (FOPI). Environmental Ressearch Letter 18, 064029.
| Crossref | Google Scholar |
Di Giuseppe F, Pappenberger F, Wetterhall F, Krzeminski B, Camia A, Libertá A, San Miguel J (2016) The potential predictability of fire danger provided by numerical weather prediction. Journal of Applied Meteorology and Climatology 55, 2469-2491.
| Crossref | Google Scholar |
Doerr SH, Santín C (2016) Global trends in wildfire and its impacts: perceptions versus realities in a changing world. Philosophical Transactions of the Royal Society B: Biological Sciences 371(1696), 20150345.
| Crossref | Google Scholar | PubMed |
Eastaugh CS, Arpaci A, Vacik H (2012) A cautionary note regarding comparisons of fire danger indices. Natural Hazards and Earth System Sciences 12, 927-934.
| Crossref | Google Scholar |
Eriksson CP, Johansson N, McNamee M (2023) The performance of wildfire danger indices: a Swedish case study. Safety Science 159, 106038.
| Crossref | Google Scholar |
Eumetsat (2019) MTG-FCI: ATBD for Active Fire Monitoring Product (Technical documentation). Available at https://user.eumetsat.int/s3/eup-strapi-media/pdf_active_fire_mon_prod_8d5feca41c.pdf [accessed on 9 June 2025].
FCFDG Forestry Canada Fire Danger Group (1992) Development and structure of the Canadian Forest Fire Behavior Prediction System. Forestry Canada, Headquarters, Fire Danger Group and Science and Sustainable Development Directorate, Ottawa. Information Report ST-X-3, 64.
| Google Scholar |
Fiorucci P, Gaetani F, Minciardi R (2008) Development and application of a system for dynamic wildfire risk assessment in Italy. Environmental Modelling & Software 23(6), 690-702.
| Crossref | Google Scholar |
Fiorucci P, D’Andrea M, Bastia S, Gollini A, Gualtieri S, Negro D, Severino M (2018) II Aggiornamento Del Manuale D’uso del Sistema Previsionale Della Pericolosità Potenziale Degli Incendi Boschivi RIS.I.CO. (Italian Civil Protection Department - Presidency of the Council of Ministers, and CIMA Research Foundation: Savona, Italy). Available at https://www.mydewetra.org/wiki/index.php/File:Manuale_RISICO_agg2018.pdf [verified 28 January 2025] [In Italian]
Flannigan MD, Logan KA, Amiro BD, Skinner WR, Stocks B (2005) Future area burned in Canada. Climatic Change 72, 1-16.
| Crossref | Google Scholar |
Ganteaume A, Camia A, Jappiot M, San Miguel-Ayanz J, Long-Fournel M, Lampin C (2013) A review of the main driving factors of forest fire ignition over Europe. Environmental Management 51(3), 651-662.
| Crossref | Google Scholar | PubMed |
Ganteaume A, Barbero R, Jappiot M, Maillé E (2021) Understanding future changes to fires in southern Europe and their impacts on the wildland–urban interface. Journal of Safety Science and Resilience 2(1), 20-29.
| Crossref | Google Scholar |
Italian Civil Protection Department and CIMA Research Foundation (2014) The Dewetra platform: a multi-perspective architecture for risk management during emergencies. In ‘Information Systems for Crisis Response and Management in Mediterranean Countries’. (Eds C Hanach, F Bénaben, F Charoy) pp. 165–177. (Springer International Publishing: Cham, Switzerland)
Júnior JS, Paulo JR, Mendes J, Alves D, Ribeiro LM, Viegas C (2022) Automatic forest fire danger rating calibration: exploring clustering techniques for regionally customizable fire danger classification. Expert Systems with Applications 193, 116380.
| Crossref | Google Scholar |
Krebs P, Pezzatti GB, Mazzoleni S, Talbot LM, Conedera M (2010) Fire regime: history and definition of a key concept in disturbance ecology. Theory of Biosciences 129, 53-69.
| Crossref | Google Scholar | PubMed |
Leuenberger M, Parente J, Tonini M, Pereira M G, Kanevski M (2018) Wildfire susceptibility mapping: deterministic vs. stochastic approaches. Environmental Modelling & Software 101, 194-203.
| Crossref | Google Scholar |
Mas J-F, Soares Filho B, Pontius RG, Farfán Gutiérrez M, Rodrigues H (2013) A suite of tools for ROC analysis of spatial models. ISPRS International Journal of Geo-Information 2(3), 869-887.
| Crossref | Google Scholar |
McWethy DB, Schoennagel T, Higuera PE, Krawchuk M, Harvey BJ, Metcalf EC, Schultz C, Miller C, Metcalf AL, Boma B, Virapongse A, Kulig JC, Stedman RC, Ratajczak Z, Nelson CR, Kolden C (2019) Rethinking resilience to wildfire. Nature Sustainability 2(9), 797-804.
| Crossref | Google Scholar |
Nelson RMJ (2000) Prediction of diurnal change in 10-h fuel stick moisture content. Canadian Journal of Forest Research 30(7), 1071-1087.
| Crossref | Google Scholar |
Orieux A (1974) Conditions météorologiques et incendies en région méditerranéenne. Revue forestière française no spécial Incendies de forêt 26, 122-129 https://hal.science/hal-03395671v1.
| Google Scholar |
Pausas JG, Keeley JE (2021) Wildfires and global change. Frontiers in Ecology and the Environment 19(7), 387-395.
| Crossref | Google Scholar |
Perello N, Trucchia A, Baghino F, Asif BS, Palmieri L, Rebora N, Fiorucci P (2024) Cellular automata-based simulators for the design of prescribed fire plans: the case study of Liguria, Italy. Fire Ecology 20, 7.
| Crossref | Google Scholar |
Perello N, Trucchia A, D’Andrea M, Degli Esposti S, Fiorucci P, Gollini A, Negro D (2025) An adaptable dead fuel moisture model for various fuel types and temporal scales tailored for wildfire danger assessment. Environmental Modelling & Software 183, 106254.
| Crossref | Google Scholar |
PPRD East 3 (2024) Guidelines for the Institution of a National Wildfire Early Warning System. Prevention, Preparedness and Response to natural and man-made disasters in Eastern Partnership countries - PPRD East 3. Published on 25 October 2024. Available at https://civil-protection-knowledge-network.europa.eu/media/guidelines-institution-national-wildfire-early-warning-system [verified 28 January 2025].
Richardson E, Trevizani R, Greenbaum JA, Carter H, Nielsen M, Peters B (2024) The receiver operating characteristic curve accurately assesses imbalanced datasets. Patterns 5(6), 100994.
| Crossref | Google Scholar | PubMed |
Rodell C, Howard R, Jain P, Moisseeva N, Chui T, Stull R (2024) Forecasting hourly wildfire risk: enhancing fire danger assessment using numerical weather prediction. Weather and Forecasting 39, 925-941.
| Crossref | Google Scholar |
San-Miguel-Ayanz J, Schulte E, Schmuck G, Camia A, Strobl P, Libertà G, Giovando C, Boca R, Sedano F, Kempeneers P, McInerney D, Withmore C, Santos de Oliveira S, Rodrigues M, Durrant T, Corti P, Oehler F, Vilar L, Amatulli G (2012) Comprehensive monitoring of wildfires in Europe: the European Forest Fire Information System (EFFIS). In ‘Approaches to Managing Disaster - Assessing Hazards, Emergencies and Disaster Impacts’. (Ed. J Tiefenbacher) pp. 87–105. (IntechOpen) 10.5772/28441
Sen PK (1968) Estimates of regression coefficient based on Kendall’s tau. Journal of the American Statistical Association 63, 1379-1389.
| Crossref | Google Scholar |
Sharples JJ, McRae RHD, Weber RO, Gill AM (2009) A simple index for assessing fire danger rating. Environmental Modelling & Software 24, 764-774.
| Crossref | Google Scholar |
Sirca C, Salis M, Arca B, Duce P, Spano D (2018) Assessing the performance of fire danger indexes in a Mediterranean area. iForest 11, 563-571.
| Crossref | Google Scholar |
SNPA (2024) Consumo di suolo, dinamiche territoriali e servizi ecosistemici. Sistema Nazionale Protezione Ambiente - SNPA. Report ambientali SNPA, 43/2024. ISPRA - Istituto Superiore per la Protezione e la Ricerca Ambientale, Via Vitaliano Brancati 48, 00144, Rome. Available at https://groupware.sinanet.isprambiente.it/uso-copertura-e-consumo-di-suolo/library/copertura-del-suolo/corine-land-cover/ [verified 28 January 2025].
Srock AF, Charney JJ, Potter BE, Goodrick SL (2018) The hot-dry-windy index: a new fire weather index. Atmosphere 9, 279.
| Crossref | Google Scholar |
Swiss Federal Institute of Forest, Snow and Landscape Research WSL (2012) Fire Weather Indices Wiki. Available at https://wikifire.wsl.ch/tiki-index515f.html?page=Introduction&structure=Fire [verified 28 January 2025].
Tartaglione N, Parodi A, Bernini L, Hachinger S, Kranzlmüller D (2024) CHAPTER: 3 × 3 km meteorological data 1981–2022 for Europe: 2D extracted fields [Data set]. Leibniz Supercomputing Centre (LRZ), Garching b.M. (Germany) 10.25927/0ppk7-znk14.
Taylor SW, Douglas GW, Dean CB, Martell DL (2013) Wildfire prediction to inform fire management: statistical science challenges. Statistical Science 28(4), 586-615.
| Crossref | Google Scholar |
Tedim F, Leone V, Amraoui M, Bouillon C, Coughlan MR, Delogu GM, Fernandes PM, Ferreira C, McCaffrey S, McGee TK, Parente J, Paton D, Pereira MG, Riberio LM, Viegas DX, Xanthopoulos G (2018) Defining extreme wildfire events: difficulties, challenges, and impacts. Fire 1(1), 9.
| Crossref | Google Scholar |
Tonini M, D’Andrea M, Biondi G, Degli Esposti S, Trucchia A, Fiorucci P (2020) A machine learning-based approach for wildfire susceptibility mapping. The case study of the Liguria region in Italy. Geosciences 10(3), 105.
| Crossref | Google Scholar |
Toy-Opazo O, Fuentes-Ramirez A, Palma-Soto V, Garcia RA, Moloney KA, Demarco R, Fuentes-Castillo A (2024) Flammability features of native and non-native woody species from the southernmost ecosystems: a review. Fire Ecology 20(1), 21.
| Crossref | Google Scholar |
Trucchia A, D’Andrea M, Baghino F, Fiorucci P, Ferraris L, Negro D, Gollini A, Severino M (2020) PROPAGATOR: an operational cellular-automata based wildfire simulator. Fire 3, 26.
| Crossref | Google Scholar |
Trucchia A, Meschi G, Fiorucci P, Gollini A, Negro D (2022) Defining wildfire susceptibility maps in Italy for understanding seasonal wildfire regimes at the national level. Fire 5, 30.
| Crossref | Google Scholar |
Trucchia A, Meschi G, Fiorucci P, Provenzale A, Tonini M, Pernice U (2023) Wildfire hazard mapping in the eastern Mediterranean landscape. International Journal of Wildland Fire 32, 417-434.
| Crossref | Google Scholar |
Viegas DX, Bovio G, Ferreira A, Nosenzo A, Sol B (1999) Comparative study of various methods of fire danger evaluation in southern Europe. International Journal of Wildland Fire 9(4), 235-246.
| Crossref | Google Scholar |
Wunder S, Calkin DE, Charlton V, Feder S, de Arano IM, Moore P, Rodriguez y Silva F, Tacconi L, Vega-Garcia C (2021) Resilient landscapes to prevent catastrophic forest fires: socioeconomic insights towards a new paradigm. Forest Policy and Economics 128, 102458.
| Crossref | Google Scholar |
Yamazaki D, Ikeshima D, Tawatari R, Yamaguchi T, O’Loughlin F, Neal JC, Sampson CC, Kanae S, Bates PD (2017) A high accuracy map of global terrain elevations. Geophysical Research Letters 44, 5844-5853.
| Crossref | Google Scholar |
Zacharakis I, Tsihrintzis VA (2023) Environmental Forest Fire Danger Rating Systems and Indices around the globe: a review. Land 12(1), 194.
| Crossref | Google Scholar |
Footnotes
1 From an administrative standpoint, Italy is divided into 20 regions, five of which have special statutes. Among the latter, one region is further subdivided into two Autonomous Provinces, as outlined in Article 116 of the Italian Constitution. National Law 353/2000 designates forest fire risk management as a regional responsibility, encouraging regions and autonomous provinces to implement forecasting and prevention measures aimed at minimizing both the extent of burned areas and the frequency of forest fires, also giving them the responsibility of the firefighting phase with regional resources.
2 The Italian Civil Protection department is responsible for the coordination of the national firefighting aerial fleet through the Centro Operativo Unificato Permanente (COAU) and for the issuance of the Daily National Forest Fire Forecast Bulletin (Directive of the Prime Minister of 1 July 2011 Direttiva in materia di lotta attiva agli incendi boschivi).
3 The CIMA Research Foundation is a research organization dedicated to disaster risk mitigation, with a particular focus on climate change-related hazards, including floods, wildfires, droughts, and the loss of terrestrial and marine biodiversity. Additionally, it serves as an operational structure within the National Civil Protection Service, as established by Italian Legislative Decree 1/2018 (Civil Protection Code).
4 In the ordinary Statute regions, the wildfire polygons data were initially collected by the Forestry Corps Corpo Forestale dello Stato until 2016 and then have been managed by the Carabinieri Forestali since 2017 (as per Article 7, Paragraph 2 of Legislative Decree 177/2016). The wildfire data for the regions with special statute and autonomous provinces were collected by the relevant regional and provincial authorities.