

Dragon detectives: citizen science confirms photo-ID as an effective tool for monitoring an endangered reptile
John Gould A B * , Chad Beranek A B C and George Madani A B
A Conservation Science Research Group, School of Environmental and Life Sciences, University of Newcastle, Callaghan, NSW, Australia.
B Grassland Earless Dragon Alliance, Cooma, NSW, Australia.
C FAUNA Research Alliance, Kahibah, NSW, Australia.
Abstract
Among amphibians and reptiles, traditional methods of capture–mark–recapture (CMR) have relied on artificial marking techniques (in particular, toe clipping), which has raised concerns because it may impact climbing ability, survival, and behaviour. A potential alternative involves the exploitation of natural biometric identifiers that are already present, including scale configuration or colour patterns. These natural markers can be applied in photo-based CMR, which has several advantages over artificial markers, including reduced costs, the reduction of harm or stress, and the potential for public participation in conservation and research.
Our aim was to test the feasibility of applying citizen science in the manual visual identification of the endangered Monaro grassland earless dragon (Tympanocryptis osbornei) using dorsal pattern as a natural marker.
We collected photographs of dorsal patterns of wild T. osbornei individuals using a smartphone device under field conditions. We subsequently recruited participants anonymously from the public using social media to complete an online survey, in which they were asked to correctly match these field-captured images of individuals from small image pools, mimicking the process of detecting recapture events.
Participants were able to successfully detect recapture events from small image pools based solely on a comparison of dorsal patterns. High consensus was reached on all matches included in the online survey, with the majority vote among participants representing the correct matching of individuals on all occasions.
Our results indicate that there is sufficient intra-specific variability and temporal stability in dorsal patterning for it to be used as a reliable natural marker for identifying T. osbornei at the individual level.
Our findings suggest that photo-CMR could be applied to other agamids with similar dorsal patterns, making it a potentially valuable tool and an alternative to artificial marking for monitoring wild populations of Australian lizards in the future.
Keywords: Agamidae, biometrics, capture–mark–recapture, citizen science, Monaro grassland earless dragon, population estimates, reptile, skin features, Tympanocryptis.
Introduction
Biometric identifiers are distinctive characteristics of an organism that can be used to detect and differentiate among species or individuals (Kühl and Burghardt 2013). Natural visual identifiers or ‘markers’, such as skin or fur patterns, have been used widely across animal groups and applied in photo-based capture–mark–recapture (CMR) studies to monitor populations (Karanth and Nichols 1998; Castro and Rosa 2005; Sacchi et al. 2010; Hohnen et al. 2013). There are several potential benefits of using natural rather than artificial markers, such as microchips, bands, and tags, which must be deliberately installed. These include a reduced need for specialised equipment and training, handling times, cost, pollution if markers are lost, and chances of inflicting harm or stress (Powell and Proulx 2003; May 2004; McCarthy and Parris 2004; Guimaraes et al. 2014; Zemanova 2020). With the advancement of cameras in smartphone devices and their accessibility, animals can be photographed under field conditions and differentiated with little cost or expertise (Gould et al. 2021a), offering a reliable alternative to artificial marking techniques. Although artificial markers continue to be used effectively in CMR, there are situations where natural markers could be a more suitable alternative for researchers. Biometric identifiers may be more favourable when there is limited funding available, or when targeting threatened species where there is a heightened risk of disturbance or life stages where traditional markers are ineffective (Gould et al. 2023). What must also be considered is the capacity for studies using natural markers to allow for public participation in conservation and research, including the benefits that come with the recruitment of citizen scientists (Dickinson et al. 2010; Gould et al. 2021b). The unique challenges and benefits that come with the use of natural markers must be weighed against those of other techniques (Börger 2016).
Although natural visual markers have been shown to be effective in the re-identification of individuals from photographs (Hohnen et al. 2013; Gould et al. 2021a), the technique must be validated for each target species or group. This includes selecting the focus marker and testing whether its information can be readily acquired and compared within a photo-database, the level of variability in the marker between individuals within the population, the temporal stability of the marker with respect to the projected length of the study period, and the capacity for observers to compare marks among images (Pennycuick 1978; Marshall and Pierce 2012). A natural marker may show high intra-specific variability yet be too visually complex for human comparison (Speed et al. 2007; Kenyon et al. 2009; Gould et al. 2021b), resulting in increased manual processing times and potential human error. Computer-assisted techniques have shown success in detecting image matches based on natural markers (Sreekar et al. 2013; Hoefer et al. 2021) and allow for the comparison of multiple, complex markers simultaneously. However, current automated systems may only provide a reduced candidate list of possible matches that still requires manual processing to some extent for a true match to be verified (Beekmans et al. 2005; Bendik et al. 2013; Town et al. 2013). The ability for human observers to manually match recapture images of individuals is thus likely to remain an important aspect of photo-matching techniques. With sufficient participant numbers, it is possible to validate manual matches based on a chosen level of consensus (Swanson et al. 2016).
Among amphibians and reptiles, traditional methods of CMR have relied on artificial marking techniques, such as toe clipping, branding, subcutaneous elastomer injection, and passive integrated transponder tagging (Gibbons and Andrews 2004; Winne et al. 2006; Schmidt and Schwarzkopf 2010). Toe clipping in particular has raised concerns for reptiles because it is a commonly applied technique yet may impact climbing ability, survival, and behaviour (McCarthy and Parris 2004; Bloch and Irschick 2005; Sreekar et al. 2013). Furthermore, the prevalence of natural toe loss in this group may prevent individuals being re-identifiable between capture events using this method (Middelburg and Strijbosch 1988; Hudson 1996). These potential limitations can impact recapture probability and the quality of data collected during surveys (McCarthy and Parris 2004).
Reptiles make excellent candidates for photo-identification (Carlström and Edelstam 1946; Shine et al. 1988; Sacchi et al. 2010; Bauwens et al. 2018), partly because they are covered in individual scales on a non-moist surface that prevents the formation of reflective spots when photographed. Potential natural markers in this group include scale patterns/anomalies (i.e. configuration of scales across the animal’s surface) and colour patterns (i.e. the difference in colour among scales, forming distinct patterns such as stripes or bands). Species can exhibit changes in overall colouring, such as during the breeding season (Castrucci et al. 1997; Cadena et al. 2018), but this does not necessarily impact either pattern type. Scale patterns are, however, more difficult to manually compare among individuals in contrast to colour patterns (Speed et al. 2007), which are larger, less complex, and more visually distinct and thus more conducive for manual processing. Although the process of photo-identifying individuals often requires their capture and handling as opposed to methods for identifying down to the species or sex level (Gardiner et al. 2014), it does allow for additional information such as morphometric measurements to be collected.
In this study, we tested the feasibility of applying citizen science in the visual identification of the Monaro grassland earless dragon (Tympanocryptis osbornei), an endangered and cryptic grassland specialist, using dorsal pattern shapes as a collective natural marker. Dragons in the Tympanocryptis genus are ideal candidates for the use of non-invasive, natural visual identifiers because they have distinct and unique patterns on their dorsum that do not change with age, across time, or with breeding season (Wilson and Swan 2010; Dimond et al. 2012; Melville et al. 2019). Dorsal patterning has been successfully used in the photo-identification of one species (Tympanocryptis lineata) (Dimond et al. 2012), supporting our hypothesis that it could be a candidate natural marker that eliminates the need for more invasive marking methods for the genus and reduces associated welfare concerns. We recruited participants anonymously from the public using social media to complete an online survey in which they were asked to correctly match field-captured photographs of individual T. osbornei from small image pools, mimicking the process of detecting recapture events. The main objectives of the study were to determine whether: (1) sufficient natural marker information could be collected using a smartphone device under field conditions; (2) there was sufficient variability in dorsal colour pattern among individuals and temporal stability to allow for recapture events to be manually detected; and (3) manual photo-matching by citizen scientists could be effective in future capture–recapture-based population monitoring of species in this genus.
Materials and methods
Study species
T. osbornei is a small agamid (approximately 9–12 cm total length) restricted to a small geographical area on the Monaro tablelands in NSW (Melville et al. 2019). This species has coarse, raised tubercular scales and a rounded squat body (Melville et al. 2019). All age classes and sexes post-hatching possess dark crossbars positioned across three predominant, pale longitudinal stripes that extend along the back dorsal surface, with additional bars over the head (Fig. 1). The bars that make up this pattern are a strong candidate marker for manual photo-identification of individuals due to their relatively large size, lack of complexity, and distinct outlines. Additionally, the bars show general symmetry on either side of the dorsum, with subtle asymmetries that are visually distinct. The entire dorsum was thus selected as our region of interest (ROI).
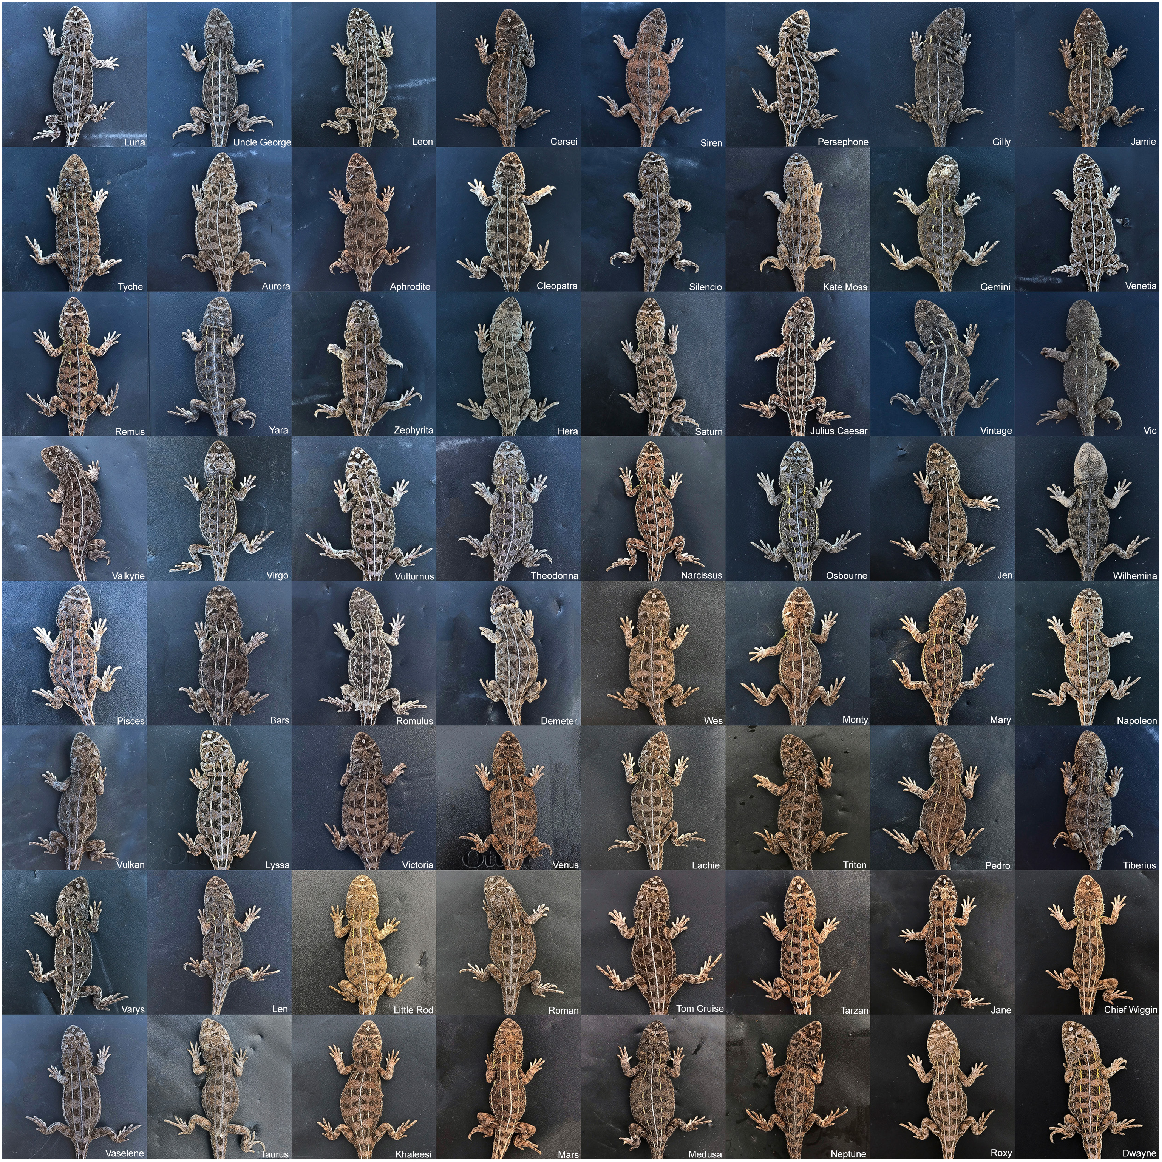
Photo-capture
This study was conducted in the southern tablelands of NSW within the Monaro Plains, comprising 1200 km2 of fragmented natural temperate grasslands. Surveys were conducted in autumn across 4 years from 2019 to 2022. Eighteen distinct sites consisting of 60-m long transects, fitted with artificial refugia (spider tubes and roof tiles) to enhance detectability, were checked five times per season (Madani et al. 2023). Individuals were captured by hand and had their snout–vent–length measured. Individuals below 40 mm were categorised as juveniles, 40–45 mm as subadult, and anything exceeding 45 mm as adult. Sex of individuals was determined by the presence of a hemipenal bulge below the cloaca and yellow colouration on the throat in males. Upon capture, individuals were placed onto a clipboard, and the dorsum of each individual was photographed using an iPhone 6s or 13 pro set to manual image capture without flash. Each lizard was held approximately 7 cm from the lens of the camera, making sure the phone was directly above and parallel to the mid-section of the dorsum. To avoid overexposure and for animal welfare, animals were placed on surfaces out of direct sunlight.
Each photograph was labelled with a unique animal identifier (name) for each newly captured individual, along with the individual’s sex and location of capture (site name, transect number, and object type/number). All images were stored within a single photo-database online (subdivided by site location) that was accessible in the field using a smartphone device. All individuals were visually cross-referenced to the labelled photo-database immediately upon capture by the lead field investigator (GM) to detect recapture events. Recapture events were further confirmed by crosschecking the sex, size, and locality data of the individual with all other capture events from the same site, taking into consideration the small home ranges of individuals. Although individuals were not marked with a secondary marker type, we are confident that recapture events were detectable based on an inspection of dorsal patterns because this has been shown to remain unchanging with age and across time periods greater than that used in the current study for Tympanocryptis dragons (Wilson and Swan 2010; Dimond et al. 2012; Melville et al. 2019). Photographs of recaptured individuals were provided with the same identifier as those of original capture, allowing us to track the capture history of these individuals over time. Individuals were released to their exact point of capture within a few minutes.
Analysis of pattern variability and stability
Variability in dorsal patterns among individuals was assessed by manually comparing the ROI of six males and six females randomly selected from the photo-database. Likewise, the temporal stability of dorsal patterns was assessed by manually comparing the ROI of three individuals with the longest time interval between first and last capture. Both assessments were performed on dorsal patterns that were extracted from photographs to remove colour, unwanted skin sections, and background features.
Online photo-identification survey
An online survey was developed using Facebook’s survey application (Code Rubik Inc, Montreal, Canada) to test how easily members of the public could detect recapture events of lizards based on photographs of their dorsal patterns. Our survey consisted of 20 closed, multiple-choice questions that were composed of images from our photo-database. Images were cropped to remove unwanted features, including tail and background, and scaled to remove information regarding lizard size. The survey was disseminated on various social media platforms, including Facebook, Twitter, and Instagram, which are freely available and accessible on any smartphone or computer device. Participants remained anonymous but were asked two preliminary questions to determine their experience level, including (1) whether they had participated in any prior animal photo-matching studies, and (2) their experience working with animals in a scientific capacity (level one: no experience; level two: some experience such as volunteering on animal-related projects; and level three: expert, such as studying animal-related courses at a tertiary level or completing animal-related research).
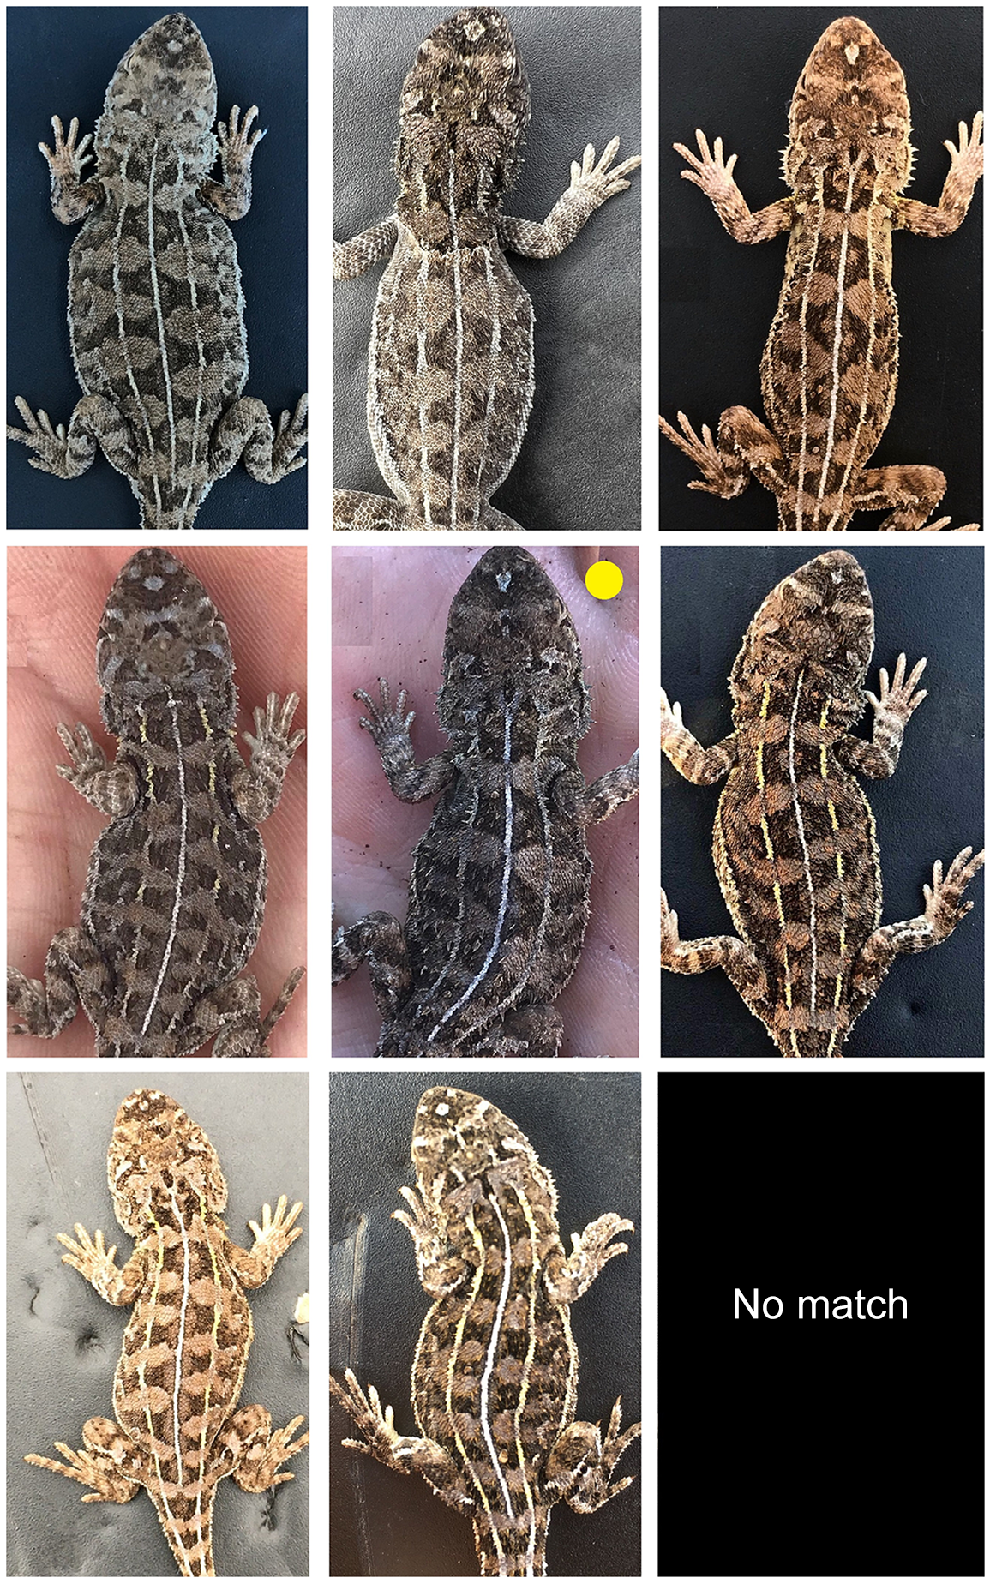
Each question consisted of a query image of the dorsal pattern of an individual, along with eight additional images that composed the answer pool (Fig. 2), following the methodology of Gould et al. (2023). Participants were asked to determine whether a lizard within the answer pool matched the lizard presented in the query by visually comparing dorsal patterns. Participants were allowed to select ‘no match’ if they deemed no match to be present.
Presentation of the Tympanocryptis osbornei query and answer pool images provided to participants as part of the online survey. The query individual is in the centre of the image array (noted by a yellow dot in the top right corner), with the eight answer images surrounding the query.
Three question types were included in the survey. Test Question: an image was included in the answer pool that was of the same individual shown in the query but photographed on a different occasion (N = 10), to measure the ability of participants to detect recapture events. Control Question Type A: an exact copy of the query image was included in the answer pool to measure how often participants selected an incorrect match due to human error (i.e. the false negative detection rate) (N = 5). Control Question Type B: no matching image of the query was included in the answer pool (N = 5), to measure the extent to which participants could easily differentiate among individuals (i.e. the false positive detection rate).
Query images for the Test Questions were selected randomly from the pool of individuals within the database that were captured on at least two occasions, with a different image of the query included as a match within the answer pool. Queries for the Control Questions, along with all non-matching images that made up the answer pools, were selected from the remaining images within the database and without replacement, so that no image was shown more than once across the entire survey. Each question was displayed separately, with all images within each answer pool presented together to reduce primacy effects. Question types were positioned randomly in the survey, with question order kept the same for all participants. Image labels were hidden from participants. Participants were only able to complete the survey once.
Analysis of survey results
We examined factors that influenced rates of successful matching among participants (i.e. how many questions they correctly answered) using a generalised linear mixed-effects model (GLMM) with a binomial distribution and logit-link function. The total number of queries correctly matched versus incorrectly matched by each participant was included as a binomial response variable using the cbind function in R, with prior photo-matching experience (categorical), animal experience (categorical), and time taken to complete the survey (continuous) included as predictor variables, along with participant ID as a random effect to account for differences among survey trials. Total survey time was rescaled using Z-score standardisation prior to inclusion in the model. Likewise, we examined factors that influenced successful matching of lizard queries in an additional binomial GLMM. For this model, the number of times a query was correctly versus incorrectly matched was included as the binomial response variable, with question type (categorical) and order (treated as continuous with linear effects) included as predictor variables, along with query name as a random effect to account for differences among queries. All statistical analyses were performed in R ver. 4.0.4 (R Core Team 2021) using the Lme4 package (Bates et al. 2015). Post hoc testing was performed by all pairwise comparisons using the emmeans package (Lenth et al. 2018).
Ethics approval
The fieldwork component of data collection was approved by the NSW Department of Planning and Environment Animal Ethics Committee (AEC210309/04). The online survey was approved by the University of Newcastle Human Research Ethics Committee (approval no. H-2019-0091). All experimental procedures were performed in accordance with the Australian code for the care and use of animals for scientific purposes.
Results
Marker variability
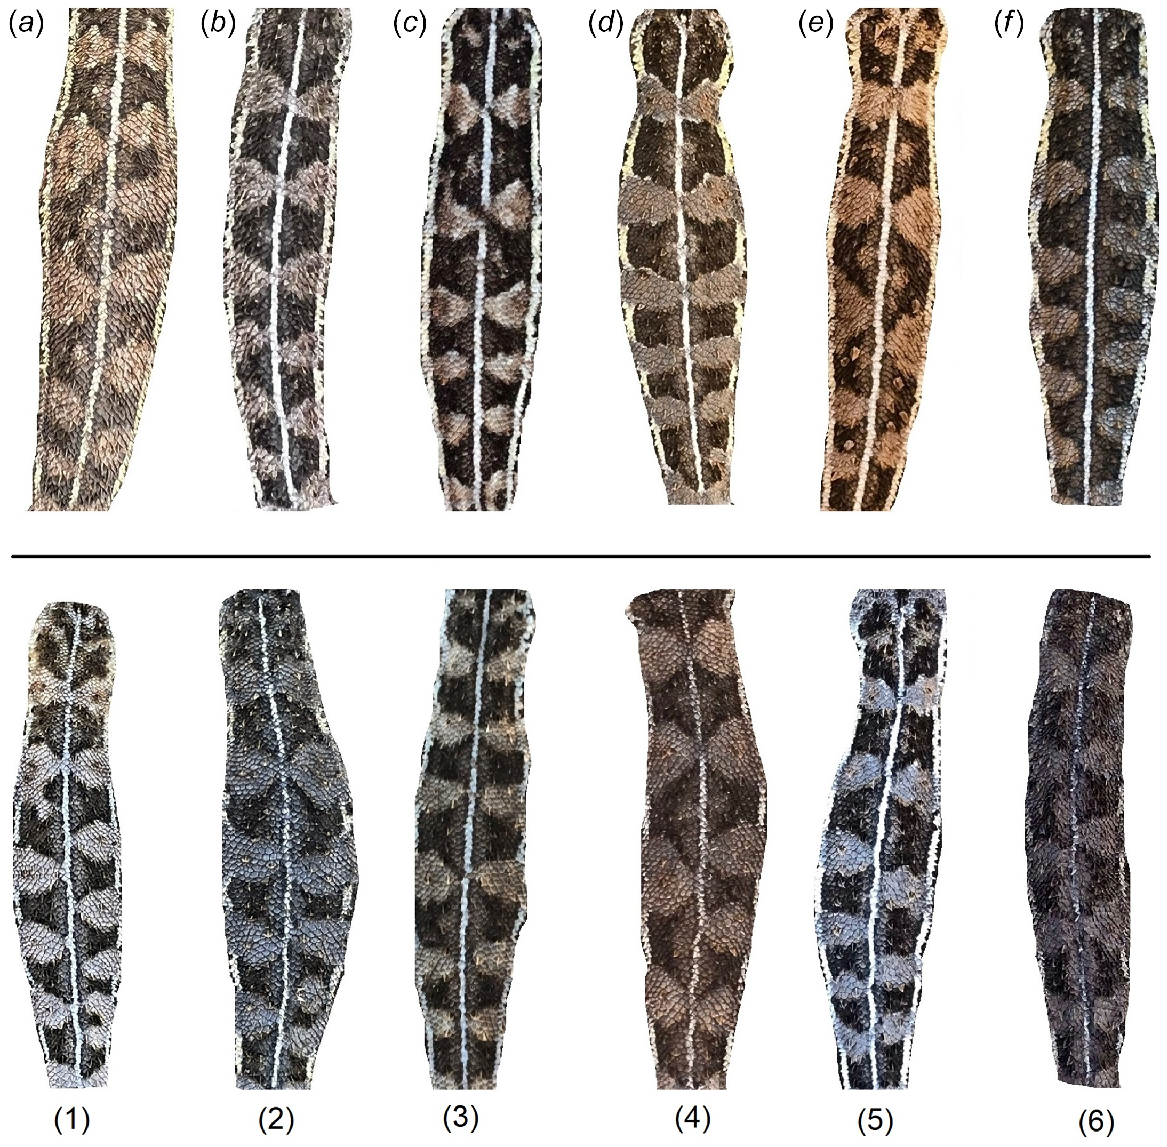
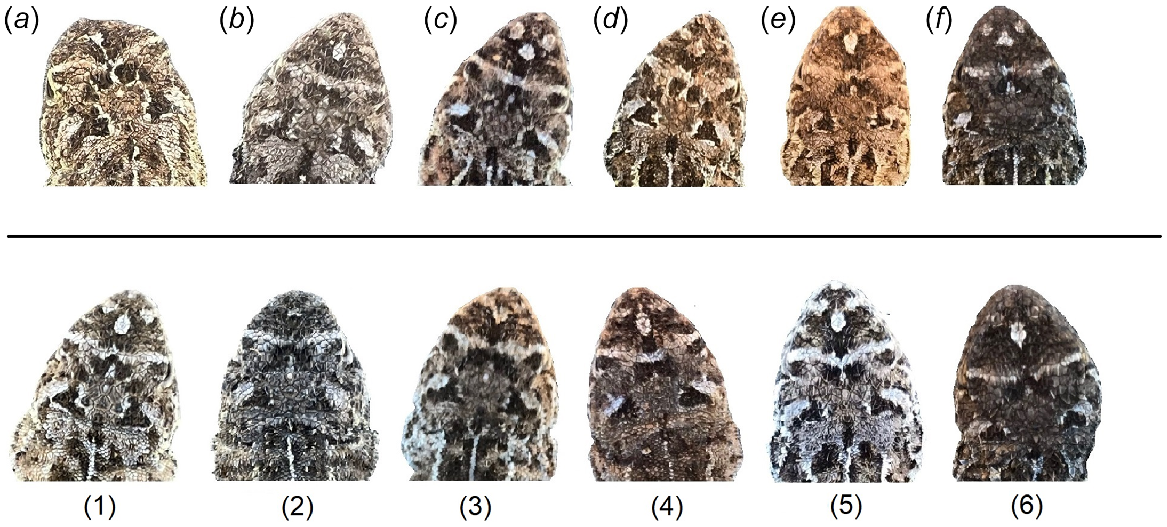
In total, 151 unique individuals were captured during the study period, with the majority being male (50%), followed by female (36%), juvenile or subadult (5%), and uncategorised (9%). All individuals showed strong banding patterns across both the head and back surfaces, with no difference in appearance between the sexes (Figs 3 and 4). The bands specific to the back showed defined edges, were uniform in colour, and were distinctly darker than the base colour of the skin, forming simple rectangular shapes that ran down the back in pairs on either side of the central line. Asymmetries in the bands, specifically those nearest to the central line were easily visible (Fig. 3). This contrasted with the bands specific to the head, which were smaller, with less defined edges, and formed more complex shapes and arrangements (Fig. 4).
Marker stability
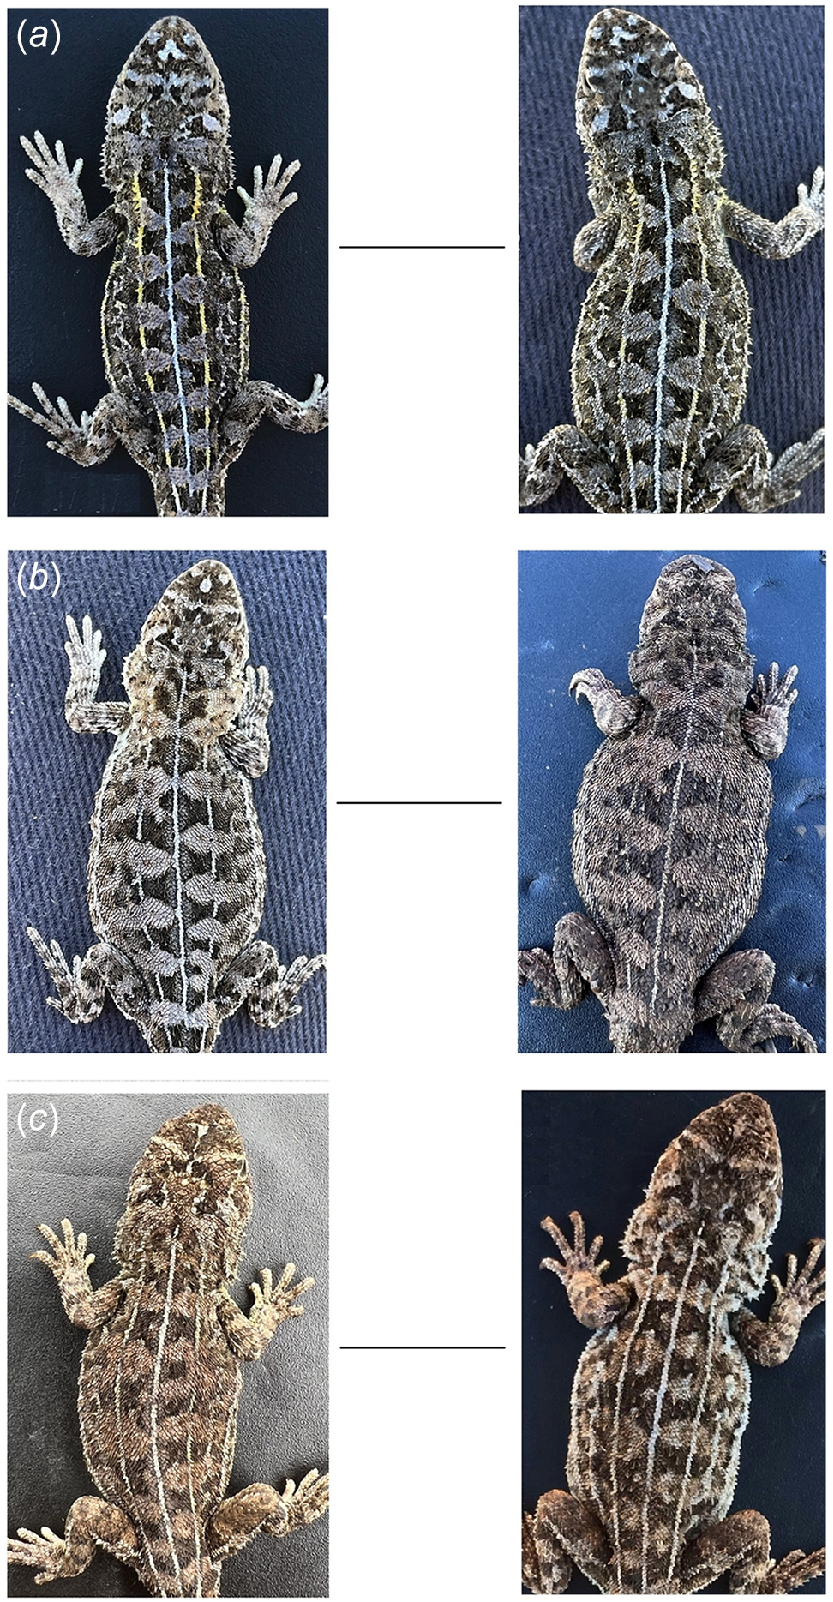
Thirteen individuals (9%) were captured on at least two occasions, including six females and seven males. The length of time between first and last capture of recaptured individuals ranged from 20 to 1106 days (mean = 343 days, s.d. = 337). Banding pattens for these recaptured individuals showed no temporal variation in terms of the size, shape, or position of dorsal banding (Fig. 5).
Lizard queries
Each query for the Control Type A set of questions (control – perfect match) was correctly matched to its copy within the answer pool by 96–99% of survey participants (mean = 98%, s.d. = 1), with incorrect matching to the wrong lizard or no lizard occurring at a rate of 1–2% and 0–1%, respectively. Each query for the Control Type B set of questions (control – no match) was correctly deemed to have no match present within its answer pool by 47–94% of participants (mean = 78%, s.d. = 18%), with incorrect matching to any lizard within the answer pool occurring at a rate of 6–52%.
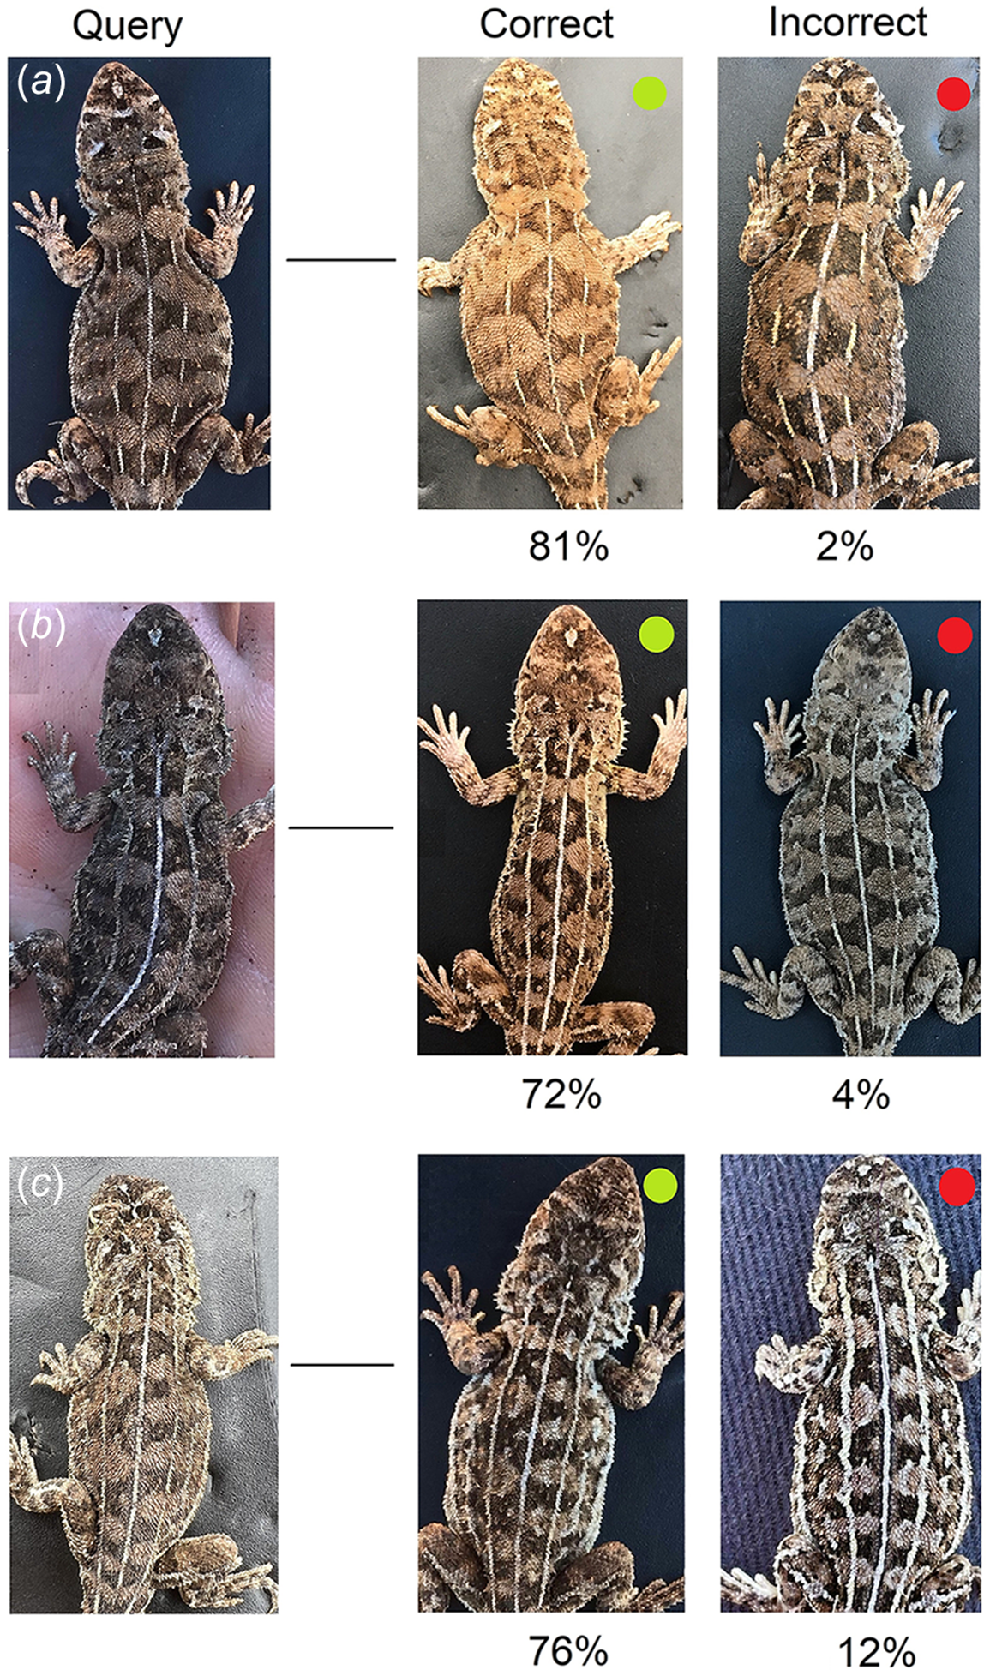
Each query for the Test set of questions (test – recap match) was correctly matched to its recapture image within the answer pool by 70–97% of participants (mean = 81%, s.d. = 8%). Test queries were incorrectly matched to an alternate ‘wrong’ lizard within the answer pool or deemed to have no match present at a rate of 1–11% and 1–21%, respectively. For each Test query, there were multiple lizards within the answer pool that were incorrectly selected as a match by a small number of participants. All of these ‘wrong’ lizards received only a small percentage of total votes (0.1–4.0%) each time, except for two lizards that were selected by 8.5% and 11.9% of participants for two separate queries. This means that queries were always matched to the correct lizard by at least 70% of participants on each occasion, and only matched incorrectly to an incorrect lizard by up to 12% of participants (Fig. 6).
Subset of photographs used in the adult Tympanocryptis osbornei online photo-matching survey. Participants were asked to determine whether a match for each query individual was present within a small answer pool containing potential matches. Shown are three Test query images (a, b, and c) alongside the correct match (i.e. the same individual but photographed on a different occasion; green dot) and the highest voted incorrect match (i.e. not the same individual as the query; red dot). The percentage of participants that voted for each correct and incorrect match is shown below each image.
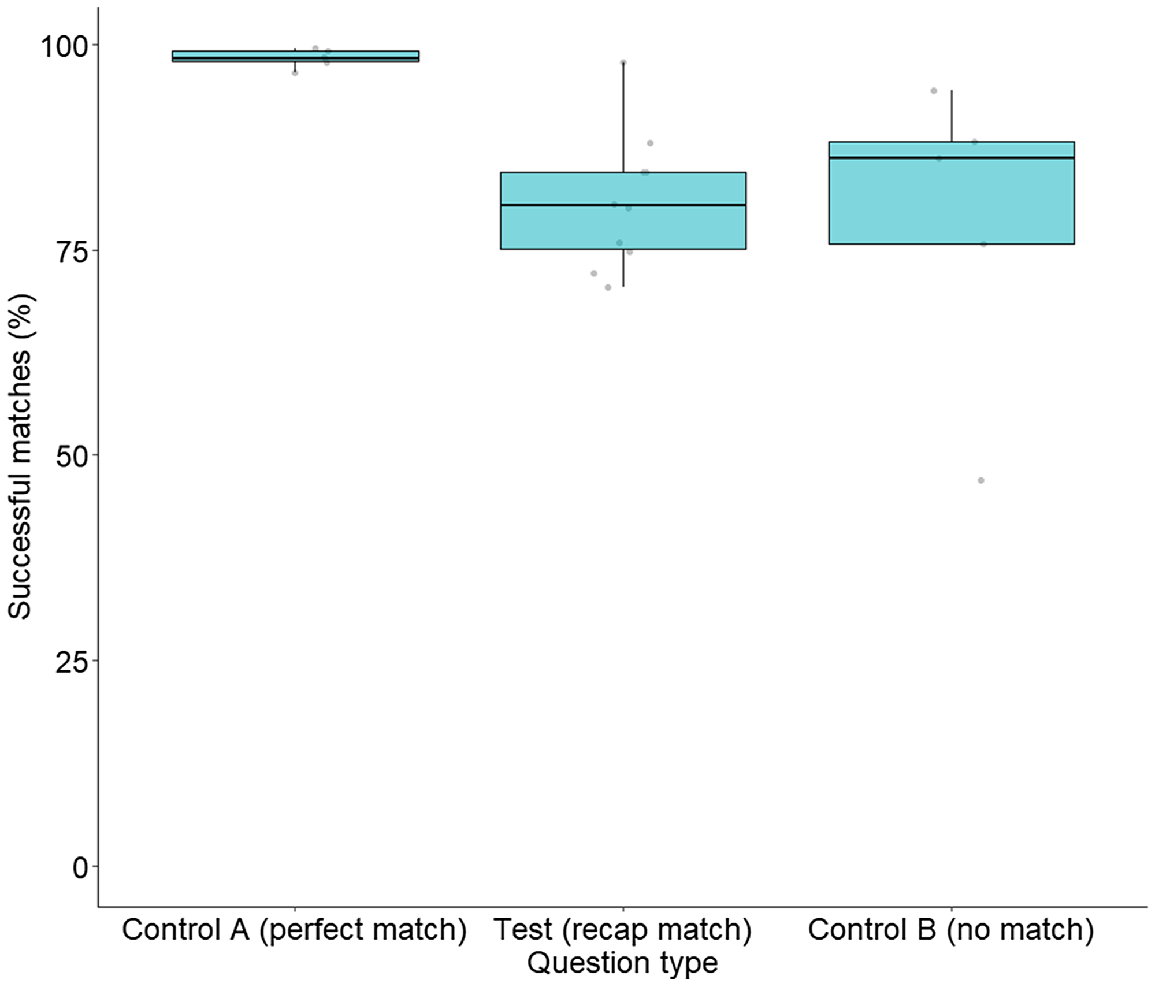
Control A queries were 14 times more likely to be correctly matched when compared with Test queries (Z = 5.54, P < 0.0001), and 18 times more likely when compared with Control B queries (Z = 6.00, P < 0.0001) (Fig. 7). There was no difference in the odds of Test and Control B queries being correctly matched (Z = −0.58, P = 0.83). There was also no decline in successful matching over the survey, with the odds of a query being correctly matched not related to its position within the survey line-up (Z = 1.39, P = 0.16).
Matching success rate of Tympanocryptis osbornei queries included in the online survey. Each dot represents the percentage of study participants that correctly answered each question, separated into three separate box and whisker plots for the three different survey question types, including those where a copy of the query image was included in the answer pool (Control Question Type A; N = 5), an image of the query individual photographed on a different survey occasion was included in the answer pool (Test Question; N = 10), and where no matching image for the query was included in the answer pool (Control Question Type B; N = 5).
Human participants
In total, 847 participants started the survey, of which 667 (79%) saw completion. Of these participants, most were from Australia (50%) or the USA (28%) and completed the survey on a phone/tablet (73%) versus a computer/laptop (27%). Approximately the same number of participants were science experts (38%) compared with non-experts who had some science experience (30%) and those with no experience (32%). Most participants had no prior photo-matching experience (79%). The total time taken to complete the survey ranged from 2 to 4436 min (mean = 53 min, s.d. = 294), with the majority (60%) completing the survey in under 20 min (equating to 1 min per query). Four individuals completed the survey within 6–7 min (equating to approximately 20 s per query) and correctly answered more than 90% of queries. We suspect that the 16 individuals who completed the survey very slowly (more than 2 h) left the survey running accidentally before submitting, or took breaks (both of which could not be ascertained from the data), with times that do not accurately reflect survey duration.
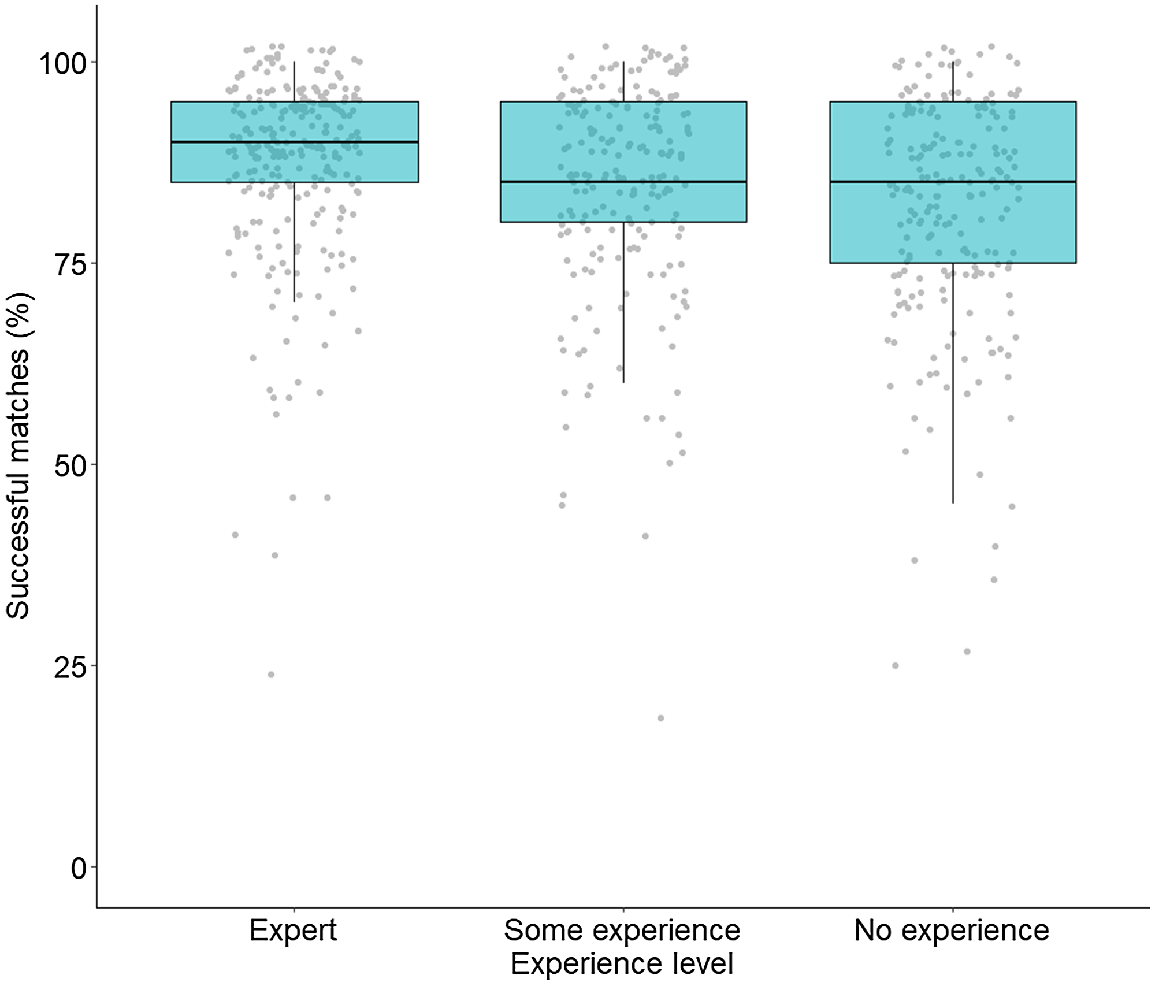
Participants with high levels of science experience were 1.5 times more likely to correctly match queries compared with those who had no science experience (Z = 4.26, P = 0.0001), and 1.2 times more likely than participants with some science experience (Z = 2.34, P = 0.05) (Fig. 8). There was no difference in the likelihood of participants with some or no science experience correctly matching query images (Z = −1.98, P = 0.12). The time participants took to complete the survey had no effect on matching success rate (Z = −0.49, P = 0.63). Those with prior animal matching experience also did not have better odds of correctly matching queries compared with those that did not (Z = 1.01, P = 0.31).
Matching success of study participants based on level of experience working with animals in a scientific capacity. Each dot represents the percentage of Tympanocryptis osbornei queries correctly matched by each participant, separated into three box and whisker plots based on the level of participant experience, including expert (e.g. completed animal related study or research), some experience (e.g. volunteered on animal-related projects), and no experience.
Discussion
We found that members of the public were able to successfully detect recapture events of T. osbornei individuals from small image pools based solely on their dorsal patterns. High consensus was reached on all queries included in the online survey, with the majority vote among participants representing the correct matching of individuals on all occasions. Our results indicate that visual information on dorsal patterns can be acquired using a mobile device under field conditions and that there is sufficient intra-specific variability in dorsal patterning within the population for manual identification down to the individual level. This is one of only a few studies that demonstrate the utility of natural markers in the identification of lizards from the Agamidae family (Dimond et al. 2012; Sreekar et al. 2013). We therefore suggest that this process can be used in the manual photo-identification of dragons for the purpose of monitoring wild populations, and that it can likely be applied to other agamids that share similar dorsal patterns.
The high matching success rate across all queries included in the survey is comparable to similar investigations and validates the use of photo-matching in conservation applications. A previous investigation on the closely related sister species T. lineata showed that photo-identification of individuals based on dorsal patterning was highly accurate (97% correct) (Dimond et al. 2012). This is compared with the current study, where all queries (100%) were matched correctly when taking into consideration the majority vote cast by participants. It must be noted that it is difficult to compare results between studies. Indeed, Dimond et al. (2012) provided reference and test photos together, whereas we provided participants queries that were compared with separate and small answer pools. All test queries used for the online part of the current study were correctly matched by at least 70% of participants. There was also no occasion where a test query was incorrectly matched based on the popular vote, which is comparable to the low rate of PIT tag loss that would result in misidentification reported in population monitoring studies of herpetofauna (Unger et al. 2012; Renet et al. 2021).
Although queries in the current study were only compared with a small subset of the total photo-database each time, we believe that this approach of data portioning realistically mimics future programs using citizen scientists. We envision each participant being presented a small number of images simultaneously (e.g. as little as two), to reduce the total amount of visual information that needs to be processed at any given time. Citizens could visually inspect as many image pairs online as they liked and come back to the circulating database multiple times over a defined period set by the project managers. Each participant would be presented images that were paired randomly, with the matching decisions made by multiple participants allowing all images in the entire database to be compared several times.
Of course, the feasibility of manually processing image libraries declines as they increase in size, with automated approaches becoming more essential for large populations due to labour constraints (Gamble et al. 2008). The benefits of manual photo-identification over automated approaches are thus likely to be restricted to small populations, such as those of T. osbornei, because there will be fewer individuals with images that need to be visually inspected. Furthermore, species that occur at low densities, with individuals that have low dispersal ability and minimal overlap in home ranges, are ideal for photo-identification because it allows for the photo-database to be further portioned prior to screening. This appears to be the case for T. osbornei; we found that densities and overlap in home ranges among survey sites were naturally low. The maximum recorded linear movement of a closely related species, T. lineata, has also been shown to be just 70 m, further suggesting that the likelihood of individuals moving between survey areas is possible but low (Stevens et al. 2010).
Despite consensus being achieved for all queries in the online survey, there was variability in the percentage of participants that correctly matched query individuals (i.e. the level of consensus). This suggests that some matching individuals were more difficult to distinguish from non-matching individuals within the answer pool, and that some individuals by chance share similar dorsal features despite there being intra-specific variability within the population. If photo-identification by citizen scientists is to be used in the future monitoring of this species, we suggest that images are kept in circulation to be matched by multiple participants until a satisfactory level of consensus is achieved, and/or matches undergo an additional verification step by an expert. To reduce the potential for error associated with using consensus analysis (Gollan et al. 2012), the threshold set for the acceptance of a match will need to be adjusted according to the level of variability and distinctiveness of the target feature within the population, the size of the database, the number of participants that have made each match, and after verification tests on at least a portion of total matches (Swanson et al. 2016). Once a match is accepted, the individual can be provided with a unique identifying name or code and at least one of its matched images removed from circulation because it no longer requires inspection. However, an image of the now identified individual will need to be made available as a reference for future matches in case the individual is re-encountered during repeat surveys.
Our study participants were not directed to compare a minimum number of unique banding points among T. osbornei individuals prior to confirming a potential match. This contrasts with the methodology of Dimond et al. (2012), where matches were made after a comparison of six banding points among T. lineata individuals. Because we did not ask participants to note the number of band comparisons made for each match, it is not possible to determine the minimal number required for a high level of matching success to be achieved. Even so, our findings suggest that setting a minimum number of feature comparisons for participants is not required prior to completing this visual task.
Additionally, participants were free to select matches based on a comparison of bands across both the back and head regions and were not asked to define whether banding from both regions were used to facilitate matching. It is apparent that the banding specific to the back may be more suitable for manual processing compared with the head, because the bands in this region have more defined edges, form fewer complex shapes, and run in parallel lines down the back and side-by-side across the central line, thereby allowing asymmetries to be used for rapid individual identification. Although the head bands may offer additional feature information to confirm potential matches, we suggest that cropping images to reveal only the back bands would reduce viewer fatigue and save time by removing excessive features within the ROI.
Our findings indicate that a participant’s prior participation in animal photo-matching studies did not affect matching ability but their experience working with animals in a scientific capacity did. Participants with a high level of experience, such as those who had completed animal related tertiary studies or research, were more likely to correctly match queries compared to those with some or no experience. While we cannot determine the reasons for this difference, it could suggest that individuals with a scientific background are better able to scrutinise animal images and detect even subtle differences in banding patterns between individuals. Perceptual expertise has been proposed as a factor in the accuracy of matching, enabling practitioners to identify differences quickly and accurately (Tanaka and Taylor 1991; Robbins and McKone 2007).
Contrary to our result, previous studies have found prior experience identifying individuals within populations to be a significant factor in the accuracy of matching success (Jones et al. 2020). However, natural features used for identification are vastly different between animals, including the size, shape, number, and complexity of feature components within the ROI. It is more likely that a participant would show improvement in repeat matching of the same feature type for the same species. Favour may thus be found in weighting the matches made by participants by their previous experience of matching the target species or animal type (e.g. reptile), as well as their level of experience working with animals in a scientific capacity, or screening participants post contribution (Dickinson et al. 2010). Even with the variability in matching ability among participants, our findings suggest that the matching process can be completed using citizen scientists, which is supported by previous photo matching studies targeting herpetofauna (Smith et al. 2018; Gould et al. 2021b).
Patterns for some reptiles show subtle changes over the life of the individual (Sacchi et al. 2007; Carretero et al. 2008), reducing the possibility of recognising recapture events over long-term studies and for long-lived species. Our results indicate that photo-matching of T. osbornei is suitable for periods of at least 3 years, which is the longest interval between capture events in our study. Individuals first captured as juveniles have been subsequently recaught and photo-matched as adults, and there was no discernible change in their dorsal pattern for adult individuals even after several years. Furthermore, the banding pattern of this species remains obvious regardless of whether the individual has recently shed or is in the process of sloughing its skin (G. Madani, pers. obs.). This complements a previous study with T. lineata, which reported that the back pattern remained consistent throughout an individual’s lifespan (Dimond et al. 2012).
We add to the growing list of reptiles that can be reliably identified using natural biometric identifiers and demonstrate the potential application of photo-identification as an alternative to artificial marking in population demographic studies using capture–recapture methods (Carlström and Edelstam 1946; Shine et al. 1988; Sacchi et al. 2010; O’Shea 2017; Bauwens et al. 2018; Taggart et al. 2021). We encourage this method to reduce stress, handling time, and avoid potential injury that can be associated with using invasive marking techniques, especially for T. osbornei and other species in the genus that are threatened with extinction (Melville et al. 2019). Because many of these species have small, isolated distributions (Melville et al. 2019), manual photo-CMR has the potential to be an effective method for monitoring these populations from a logistical standpoint, because the photo-databases produced are less likely to become impractical for processing (Sacchi et al. 2007). Additionally, image capture can be completed in the field by any practitioner with a mobile device with very little training required, with the reduced need for expensive equipment to mark individuals allowing limited management funds to be redirected. This technique may also be applied in captive husbandry for monitoring individuals within ex situ breeding programmes.
Acknowledgements
We thank Rod Pietsch and Rob Armstrong, threatened species officers from the NSW Department of Planning and Environment, for coordinating the logistics and management associated with the monitoring program. We also thank Jesse Campbell, Ryan Colley, Lachlan Hall, Bridget Roberts, and Elliot Webb, who assisted with the field collection of photographs used in this study, and we especially thank all the survey participants who took the time to delve into differentiating distinct dorsal patterns to determine discernible dragons.
References
Bates D, Mächler M, Bolker B, Walker S (2015) Fitting linear mixed-effects models using lme4. Journal of Statistical Software 67, 1-48.
| Crossref | Google Scholar |
Bauwens D, Claus K, Mergeay J (2018) Genotyping validates photo-identification by the head scale pattern in a large population of the European adder (Vipera berus). Ecology and Evolution 8, 2985-2992.
| Crossref | Google Scholar |
Beekmans BWPM, Whitehead H, Huele R, Steiner L, Steenbeek AG (2005) Comparison of two computer-assisted photo-identification methods applied to sperm whales (Physeter macrocephalus). Aquatic Mammals 31, 243-247.
| Crossref | Google Scholar |
Bendik NF, Morrison TA, Gluesenkamp AG, Sanders MS, O’Donnell LJ (2013) Computer-assisted photo identification outperforms visible implant elastomers in an endangered salamander, Eurycea tonkawae. PLoS ONE 8, e59424.
| Crossref | Google Scholar |
Bloch N, Irschick DJ (2005) Toe-clipping dramatically reduces clinging performance in a pad-bearing lizard (Anolis carolinensis). Journal of Herpetology 39, 288-293.
| Crossref | Google Scholar |
Börger L (2016) EDITORIAL: Stuck in motion? Reconnecting questions and tools in movement ecology. Journal of Animal Ecology 85, 5-10.
| Crossref | Google Scholar |
Cadena V, Rankin K, Smith KR, Endler JA, Stuart-Fox D (2018) Temperature-induced colour change varies seasonally in bearded dragon lizards. Biological Journal of the Linnean Society 123, 422-430.
| Crossref | Google Scholar |
Carlström D, Edelstam C (1946) Methods of marking reptiles for identification after recapture. Nature 158, 748-749.
| Crossref | Google Scholar |
Carretero MA, Ajtíc R, Tomović L, Crnobrnja-Isailovic J (2008) Evidence for post-natal instability of head scalation in the meadow viper (Vipera ursinii) – patterns and taxonomic implications. Amphibia-Reptilia 29, 61-70.
| Crossref | Google Scholar |
Castro ALF, Rosa RS (2005) Use of natural marks on population estimates of the nurse shark, Ginglymostoma cirratum, at Atol das Rocas Biological Reserve, Brazil. Environmental Biology of Fishes 72, 213-221.
| Crossref | Google Scholar |
Castrucci AMD, Sherbrooke WC, Zucker N (1997) Regulation of physiological color change in dorsal skin of male tree lizards Urosaurus ornatus. Herpetologica 53, 405-410.
| Google Scholar |
Dickinson JL, Zuckerberg B, Bonter DN (2010) Citizen science as an ecological research tool: challenges and benefits. Annual Review of Ecology, Evolution, and Systematics 41, 149-172.
| Crossref | Google Scholar |
Dimond WJ, Osborne WS, Evans MC, Gruber B, Sarre SD (2012) Back to the brink: population decline of the endangered grassland earless dragon (Tympanocryptis pinguicolla) following its rediscovery. Herpetological Conservation and Biology 7, 132-149.
| Google Scholar |
Gamble L, Ravela S, McGarigal K (2008) Multi-scale features for identifying individuals in large biological databases: an application of pattern recognition technology to the marbled salamander Ambystoma opacum. Journal of Applied Ecology 45, 170-180.
| Crossref | Google Scholar |
Gardiner RZ, Doran E, Strickland K, Carpenter-Bundhoo L, Frère C (2014) A face in the crowd: a non-invasive and cost effective photo-identification methodology to understand the fine scale movement of eastern water dragons. PLoS ONE 9, e96992.
| Crossref | Google Scholar |
Gibbons WJ, Andrews KM (2004) Pit tagging: simple technology at its best. Bioscience 54, 447-454.
| Crossref | Google Scholar |
Gollan J, de Bruyn LL, Reid N, Wilkie L (2012) Can volunteers collect data that are comparable to professional scientists? A study of variables used in monitoring the outcomes of ecosystem rehabilitation. Environmental Management 50, 969-978.
| Crossref | Google Scholar |
Gould J, Callen A, Maynard C, Knibb G, Mcgregor J, Gill L, Sanders S, Davies B, Schmahl K, Donelly R, Turner A, Mchenry C (2021a) Standing out in a crowd: intraspecific variability in dorsal patterning allows for photo-identification of a threatened anuran. Austral Ecology 46, 1383-1391.
| Crossref | Google Scholar |
Gould J, Clulow J, Clulow S (2021b) Using citizen science in the photo-identification of adult individuals of an amphibian based on two facial skin features. PeerJ 9, e11190.
| Crossref | Google Scholar |
Gould J, Taylor J, Davies B, Donelly R, Schmahl K, Bugir CK, Beranek CT, McGregor J, Mahony SV, Seeto R, Upton R, McHenry C, Callen A (2023) Tadpole fingerprinting: using tail venation patterns to photo-identify tadpole individuals of a threatened frog. Austral Ecology 48, 585-599.
| Crossref | Google Scholar |
Guimaraes M, Corrêa DT, Filho SS, Oliveira TAL, Doherty PF, Jr, Sawaya RJ (2014) One step forward: contrasting the effects of toe clipping and pit tagging on frog survival and recapture probability. Ecology and Evolution 4, 1480-1490.
| Crossref | Google Scholar |
Hoefer S, Rotger A, Mills S, Robinson NJ (2021) Semi-automated photo-identification of Bahamian racers (Cubophis vudii vudii). Acta Herpetologica 16, 133-136.
| Crossref | Google Scholar |
Hohnen R, Ashby J, Tuft K, McGregor H (2013) Individual identification of northern quolls (Dasyurus hallucatus) using remote cameras. Australian Mammalogy 35, 131-135.
| Crossref | Google Scholar |
Hudson S (1996) Natural toe loss in southeastern Australian skinks: implications for marking lizards by toe-clipping. Journal of Herpetology 30, 106-110.
| Crossref | Google Scholar |
Jones MD, Marshall BM, Smith SN, Christie JT, Waengsothorn S, Artchawakom T, Suwanwaree P, Strine CT (2020) Can post-capture photographic identification as a wildlife marking technique be undermined by observer error? A case study using king cobras in northeast Thailand. PLoS ONE 15, e0242826.
| Crossref | Google Scholar |
Karanth KU, Nichols JD (1998) Estimation of tiger densities in India using photographic captures and recaptures. Ecology 79, 2852-2862.
| Crossref | Google Scholar |
Kenyon N, Phillott AD, Alford RA (2009) Evaluation of the photographic identification method (pim) as a tool to identify adult Litoria genimaculata (anura: Hylidae). Herpetological Conservation and Biology 4, 403-410.
| Google Scholar |
Kühl HS, Burghardt T (2013) Animal biometrics: quantifying and detecting phenotypic appearance. Trends in Ecology & Evolution 28, 432-441.
| Crossref | Google Scholar |
Lenth R, Singmann H, Love J, Buerkner P, Herve M (2018) Package ‘emmeans’. Available at https://cran.r-project.org/web/packages/emmeans/index.html
Madani G, Pietsch R, Beranek CT (2023) Where are my dragons? Replicating refugia to enhance the detection probability of an endangered cryptic reptile. Acta Oecologica 119, 103910.
| Crossref | Google Scholar |
Marshall AD, Pierce SJ (2012) The use and abuse of photographic identification in sharks and rays. Journal of Fish Biology 80, 1361-1379.
| Crossref | Google Scholar |
May RM (2004) Ethics and amphibians. Nature 431, 403.
| Crossref | Google Scholar |
McCarthy MA, Parris KM (2004) Clarifying the effect of toe clipping on frogs with Bayesian statistics. Journal of Applied Ecology 41, 780-786.
| Crossref | Google Scholar |
Melville J, Chaplin K, Hutchinson M, Sumner J, Gruber B, MacDonald AJ, Sarre SD (2019) Taxonomy and conservation of grassland earless dragons: new species and an assessment of the first possible extinction of a reptile on mainland Australia. Royal Society Open Science 6, 190233.
| Crossref | Google Scholar |
Middelburg JJM, Strijbosch H (1988) The reliability of the toe clipping method with the common lizard (Lacerta vivipara). Herpetological Journal 1, 291-293.
| Google Scholar |
O’Shea M (2017) Identification of individual striped legless lizards Delma impar using the dorsal head scale pattern. The Victorian Naturalist 134, 177-186.
| Google Scholar |
Powell RA, Proulx G (2003) Trapping and marking terrestrial mammals for research: integrating ethics, performance criteria, techniques, and common sense. ILAR Journal 44, 259-276.
| Crossref | Google Scholar |
Renet J, Guillaud F, Xeres A, Brichard J, Baudat-Franceschi J, Rosa G (2021) Assessing reliability of pit-tagging in an endangered fossorial toad (Pelobates cultripes) and its effect on individual body mass. Herpetological Conservation and Biology 16, 584-593.
| Google Scholar |
Robbins R, McKone E (2007) No face-like processing for objects-of-expertise in three behavioural tasks. Cognition 103, 34-79.
| Crossref | Google Scholar |
Sacchi R, Scali S, Fasola M, Galeotti P (2007) The numerical encoding of scale morphology highly improves photographic identification in lizards. Acta Herpetologica 2, 27-35.
| Crossref | Google Scholar |
Sacchi R, Scali S, Pellitteri-Rosa D, Pupin F, Gentilli A, Tettamanti S, Cavigioli L, Racina L, Maiocchi V, Galeotti P, Fasola M (2010) Photographic identification in reptiles: a matter of scales. Amphibia-Reptilia 31, 489-502.
| Crossref | Google Scholar |
Schmidt K, Schwarzkopf L (2010) Visible implant elastomer tagging and toe-clipping: effects of marking on locomotor performance of frogs and skinks. The Herpetological Journal 20, 99-105.
| Google Scholar |
Shine C, Shine N, Shine R, Slip D (1988) Use of subcaudal scale anomalies as an aid in recognizing individual snakes. Herpetological Review 19, 79-80.
| Google Scholar |
Smith S, Young T, Skydmore D (2018) Effectiveness of the field identification of individual natterjack toads (Epidalea calamita) using comparisons of dorsal features through citizen science. Herpetological Journal 28, 31-38.
| Google Scholar |
Speed CW, Meekan MG, Bradshaw CJA (2007) Spot the match – wildlife photo-identification using information theory. Frontiers in Zoology 4, 2.
| Crossref | Google Scholar |
Sreekar R, Purushotham CB, Saini K, Rao SN, Pelletier S, Chaplod S (2013) Photographic capture–recapture sampling for assessing populations of the Indian gliding lizard Draco dussumieri. PLoS ONE 8, e55935.
| Crossref | Google Scholar |
Stevens TA, Evans MC, Osborne WS, Sarre SD (2010) Home ranges of, and habitat use by, the grassland earless dragon (Tympanocryptis pinguicolla) in remnant native grasslands near Canberra. Australian Journal of Zoology 58, 76-84.
| Crossref | Google Scholar |
Swanson A, Kosmala M, Lintott C, Packer C (2016) A generalized approach for producing, quantifying, and validating citizen science data from wildlife images. Conservation Biology 30, 520-531.
| Crossref | Google Scholar |
Taggart PL, Morris S, Caraguel CG (2021) The impact of PIT tags on the growth and survival of pythons is insignificant in randomised controlled trial. PeerJ 9, e11531.
| Crossref | Google Scholar |
Tanaka JW, Taylor M (1991) Object categories and expertise: is the basic level in the eye of the beholder? Cognitive Psychology 23, 457-482.
| Crossref | Google Scholar |
Town C, Marshall A, Sethasathien N (2013) Manta matcher: automated photographic identification of manta rays using keypoint features. Ecology and Evolution 3, 1902-1914.
| Crossref | Google Scholar |
Unger SD, Burgmeier NG, Williams RN (2012) Genetic markers reveal high PIT tag retention rates in giant salamanders (Cryptobranchus alleganiensis). Amphibia-Reptilia 33, 313-317.
| Crossref | Google Scholar |
Winne CT, Willson JD, Andrews KM, Reed RN (2006) Efficacy of marking snakes with disposable medical cautery units. Herpetological Review 37, 52-54.
| Google Scholar |
Zemanova MA (2020) Towards more compassionate wildlife research through the 3Rs principles: moving from invasive to non-invasive methods. Wildlife Biology 2020, 1-17.
| Crossref | Google Scholar |