

Estimating eastern wild turkey productivity using trail camera images
Hannah E. Butkiewicz A B , Jennifer L. Stenglein C , Jason D. Riddle A , Shelby A. Truckenbrod A D and Christopher D. Pollentier C *
C *
A
B Present address:
C
D Present address:
Abstract
Trail cameras provide researchers and managers with the ability to study and monitor animals remotely at large temporal and spatial scales and often with less effort than traditional surveys. Trail cameras have been used to identify eastern wild turkey (Meleagris gallopavo silvestris) roost sites and to investigate nest predators and parasitism, although no studies to date have attempted to estimate productivity at larger spatial scales using trail cameras alone.
We studied how a statewide network of >2000 trail cameras operated by community scientists could be used to estimate wild turkey productivity metrics in Wisconsin, USA, and explored the patterns in these metrics throughout the summer brood-rearing season and across Turkey Management Zones (TMZs).
Trail cameras from the Snapshot Wisconsin project generated 38,671 turkey triggers (bursts of three photos) in June–August 2016–2020. We classified each trigger into counts of hens (breeding-age females) and poults, and generated three productivity metrics: percentage of successful hens, poult-to-total-hen ratio and poult-to-successful-hen ratio. For each metric we modeled the effects of temporal and spatial covariates and included site and year random effects.
We found positive relationships between time (June–August) and percentage of successful hens and poult-to-total-hen ratio likely due to renesting hens becoming successful, and increased detection of wild turkey poults as they grow, and a negative relationship with poult-to-successful-hen ratio likely due to renest attempts resulting in fewer poults due to smaller clutch sizes and mortality of poults during the brood-rearing phase. We also found weak non-linear relationships between each productivity metric and different land cover proportions within 308-hectare buffers of camera sites. The percentage of successful hens was largest at sites with high proportions of coniferous forest, poult-to-total-hen ratio was highest and less variable at sites with higher grassland proportion, and poult-to-successful-hen ratio was greatest at sites with high proportion of oak forest. Productivity metrics varied across TMZs with generally higher values in northern and eastern versus southern and western TMZs. For an average year and across TMZs from our modeled results, we estimated 36.0% of hens were successful, a poult-to-total-hen ratio of 1.08, and poult-to-successful-hen ratio value of 2.59. These estimates were for the last time period in the model (i.e. the month of August or the last week in August) and represent our best understanding of Wisconsin wild turkey recruitment for poults that have survived summer and are recruited into the wild turkey population headed into autumn.
Our research demonstrated that trail cameras can be used to remotely index wild turkey productivity at spatial and temporal scales that would not otherwise be possible with traditional field methods. Our recruitment estimates were low compared to other wild turkey surveys in Wisconsin and surrounding states which could be due to lower detection rates of poults compared to hens on trail cameras.
We believe that the use of trail cameras warrants further investigation in conjunction with efforts to account for and model detection probability for hens and poults, separately, if trail camera-derived productivity metrics are to be considered for monitoring wild turkey populations.
Keywords: citizen science, community science, Eastern wild turkey, Meleagris gallopavo silvestris, mixed-effect modeling, poults, productivity, recruitment, remote camera, reproduction, Snapshot Wisconsin, trail camera, Wisconsin.
Introduction
The eastern wild turkey (Meleagris gallopavo silvestris; hereafter, wild turkey) is an economically and culturally important upland game bird (Keck and Langston 1992) with a widespread distribution across eastern United States of America (McRoberts et al. 2020). Once extirpated from many regions, the species was successfully recovered following extensive restoration efforts within and beyond their historical range (Chamberlain et al. 2022), including Wisconsin, USA. Wild turkey populations continued to prosper post-restoration (Tapley et al. 2005), and many state management agencies increased harvest opportunities in response to increased demand (Isabelle et al. 2018). However, by the mid-2000s, reports suggested potential regional declines in wild turkey abundance (Tapley et al. 2011; Casalena et al. 2016) and corresponding reductions in spring harvest (Ericksen et al. 2016; Parent et al. 2016). Furthermore, many wildlife managers reported declining trends in annual indices used to monitor wild turkey productivity (Byrne et al. 2016).
Annual production is an important parameter that affects abundance and can have a profound influence on population growth and sustainability in wild turkeys (Vangilder and Kurzejeski 1995; Roberts and Porter 1996; Pollentier et al. 2014a). Therefore, robust and reliable estimates of productivity (i.e. nest success, hatch rates), recruitment (i.e. rate at which individuals are added to a population) and population trends are helpful for establishing effective management objectives for wild turkey populations (Pollentier et al. 2014a; Tyl et al. 2020). For example, in Wisconsin, harvest authorization levels are reviewed by an advisory committee prior to spring and autumn harvest seasons, and adjustments to the allocation of harvest authorizations may be recommended based upon trends in harvest success rates in conjunction with indices to productivity, hunter densities, and information on population trends from local field staff, conservation partners and hunters (Wisconsin Department of Natural Resources 2015).
Radio telemetry and brood flush counts have been used to estimate wild turkey productivity metrics (Porter et al. 1983; Roberts et al. 1995; Vangilder and Kurzejeski 1995; Paisley et al. 1998; Pollentier et al. 2014b). However, such techniques are often reserved for short-term research projects and inferences are typically limited to the spatial scope of the study area. To monitor population trends and productivity at broader spatial and temporal scales, managers often rely on less intensive annual surveys to infer population dynamics in relation to management needs. For wild turkeys, brood surveys have been widely used by state wildlife managers to obtain annual indices of productivity (Johnson and Danks 2022; Oakley and Glick 2022; Backs and McCallen 2023).
Wild turkey productivity had been regularly monitored in Wisconsin via two statewide surveys: the wild turkey landowner brood survey (Dhuey 2012) and the 10-week brood observation survey (Rees Lohr 2018). The landowner brood survey was a mailed postcard survey of rural landowners of 40 or more acres; recipients were requested to record the number of wild turkey broods, poults per brood and adult hens (i.e. adult females) with or without a brood seen from June to August (Dhuey 2012). The 10-week brood observation survey was a Wisconsin Department of Natural Resources (WDNR) staff-only opportunistic statewide survey of upland game bird broods, including gray partridge (Perdix perdix), ring-necked pheasant (Phasianus colchicus), ruffed grouse (Bonasa umbellus) and wild turkey, observed during normal field operations during a 10-week period from June to August (Rees Lohr 2018). Even though both surveys were helpful for monitoring annual wild turkey productivity, multiple factors contributed to declines in survey participation including fewer staff, shifting work duties and waning interest from public participants (Dhuey et al. 2020). Reduction in survey participation eroded confidence that data reflected wild turkey productivity, and thus the landowner brood survey and 10-week brood observation survey were suspended in 2012 and 2019 respectively.
Since the discontinuation of the 10-week brood observation survey, wildlife managers in Wisconsin have sought alternative methods to monitor annual wild turkey productivity and recruitment such as the use of trail cameras. Trail cameras have emerged as a promising management tool to monitor wildlife continuously and noninvasively (Steenweg et al. 2017; Townsend et al. 2021). Advances in trail camera technology and increased interest in using wildlife images for community (or citizen) science and for outreach and education have contributed to rapid growth in the use of trail cameras (Burton et al. 2015). In contrast to traditional field methods, trail cameras provide researchers the ability to remotely study animals at increased temporal and spatial scales, and often with less effort. Trail cameras have been increasingly used in ecological studies to determine occupancy, habitat and activity patterns, species richness, distribution, population dynamics and abundance (O’Brien and Kinnaird 2008; O’Connell et al. 2011). Trail cameras have also been used to identify wild turkey roost sites and to investigate nest predators and nest parasitism (Pharris and Goetz 1980; Dreibelbis et al. 2008; Melville et al. 2014; Ruttinger et al. 2014; Brautigam et al. 2016), although none to our knowledge have attempted to estimate wild turkey productivity across large spatial scales.
Wild turkey recruitment is a dynamic process including nesting, nest depredation, renesting, formation of crèches (multiple hens with commingled poults) and poult mortality that we aimed to track throughout summer using trail camera photos. Trail camera photos provide a novel opportunity to monitor wild turkey recruitment. However, similar to in-person surveys, the complication that detection of poults changes as poults grow and become more mobile, is present. In late spring and early summer, many hens have made a first nesting attempt, and some have successfully hatched out the first broods that are seen on trail cameras. These poults are still very small and difficult to detect in trail camera photos. In early- to mid-summer time, hens that lost their first nest may renest and successfully hatch a brood, though smaller brood sizes may occur from renesting attempts given smaller average clutch sizes of renests (Vangilder and Kurzejeski 1995; Pollentier et al. 2014b). During this time, trail cameras are detecting more poults and poults of different ages, occasionally in the same photos, indicating the formation of crèches (Tyl et al. 2020). Throughout summer, more hens become successful, and broods often merge to form additional crèches. At the same time, individual poults experience mortality, thus reducing brood size, but become more detectable on trail cameras as their body size and mobility increase.
The WDNR launched Snapshot Wisconsin (SSWI), a community science trail camera wildlife monitoring project, in 2015 and by 2018 the program expanded statewide with >1500 volunteers placing WDNR-purchased SSWI trail cameras on their private land (Wisconsin Department of Natural Resources 2025). Currently, SSWI has >2000 trail cameras placed by volunteers on private and public land within SSWI survey blocks that evenly cover the state. SSWI trail cameras have been used to estimate male abundance at lek sites of greater prairie-chicken (Tympanuchus cupido) and sharp-tailed grouse (T. phasianellus; Stenglein et al. 2023). Annually, SSWI provides spatial and temporal trends for 11 Wisconsin species including black bear (Ursus americanus), bobcat (Lynx rufus) and fisher (Pekania pennati). SSWI provides an opportunity to develop novel techniques for acquiring robust estimates of wild turkey productivity metrics statewide. Our research objectives were to determine if SSWI trail camera data could be used to: (1) estimate wild turkey productivity metrics, (2) model the effects of temporal and spatial covariates on these metrics, and (3) provide regional wild turkey recruitment information that could be used by managers to inform wild turkey management decisions.
Materials and methods
Study area
The study area was the state of Wisconsin (~169,600 km2) located in the Upper Midwest, USA (Fig. 1). Glaciation has strongly influenced the state’s geology and natural communities. Much of northern Wisconsin was characterized by extensive forest cover composed of northern mesic hardwoods and mixed hardwood–coniferous forests with many freshwater glacial lakes connected by meandering streams, though portions of northwest Wisconsin consisted of dry-mesic pine (Pinus spp.) and oak (Quercus spp.) forests, barrens and grasslands, along with limited areas suitable for row-crop agriculture. Central Wisconsin landscapes were highly variable with a mosaic of pine–oak–aspen (Populus spp.) forest cover, grassland, open wetlands and agriculture. Much of central Wisconsin was influenced by the tension zone, an ecoclimatic transition region that crosses the state from northwest to southeast and represents a shift from southern to northern species assemblages (Attig et al. 2011). Southwest Wisconsin was characterized by highly eroded, unglaciated topography with a mix of oak–hickory (Carya spp.) and maple (Acer spp.)–basswood (Tilia spp.) forests, grasslands and herbaceous fields, as well as row-crop agriculture and dairy farming. Southeast Wisconsin was densely populated with many of the state’s residents residing in the region and the primary land use was agricultural cropland. Statewide, forests constituted ~40% of land cover and cropland–agriculture comprised ~25% of land cover (Fig. 1).
Primary land cover types of Wisconsin, USA, from Wiscland 2.0 and Wisconsin’s 7 turkey management zones (Wisconsin Department of Natural Resources 2016).
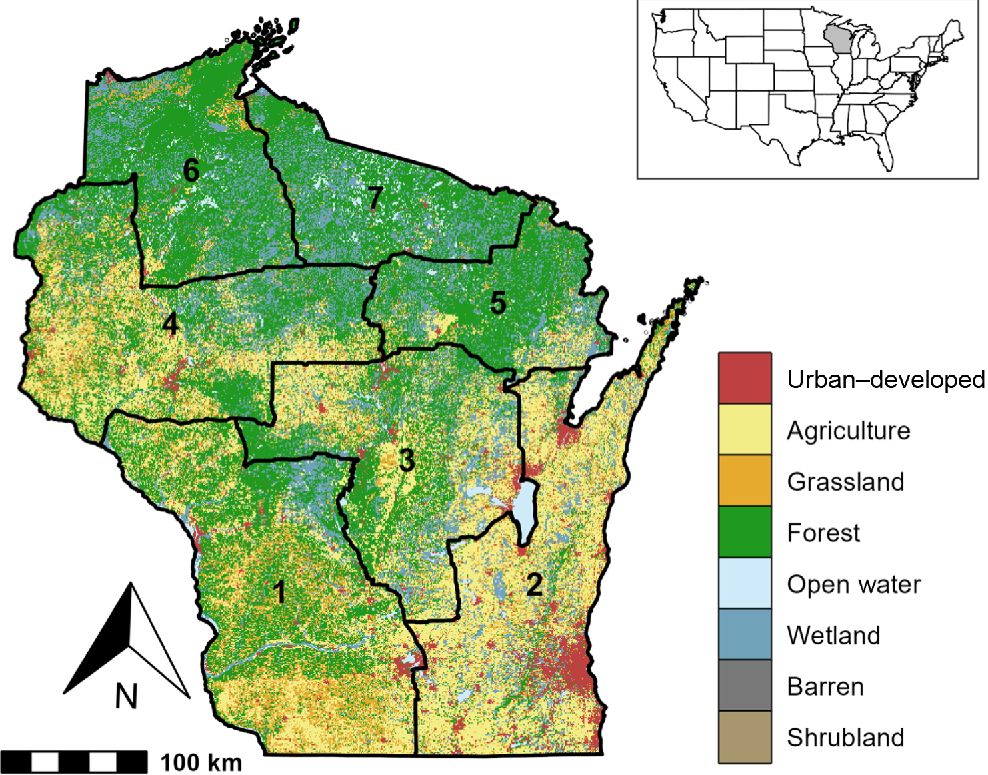
Most of Wisconsin had a continental climate; the average minimum temperature was −15.7°C in January and the average maximum temperature was 26.9°C in July. Annual precipitation varied across regions with a statewide mean of 794 mm. Winter snowfall totals vary along a latitudinal gradient and ranged from 78.7 to 421.6 cm in southern and northern Wisconsin respectively (Wisconsin State Climatology Office 2023). Turkey Management Zones (TMZs) have been implemented in Wisconsin to regulate harvest opportunities in accordance with wild turkey population status and habitat suitability in certain areas (Fig. 1; Wisconsin Department of Natural Resources 2015).
Camera deployment and trigger classification
The SSWI project divided the state into a grid of survey blocks which were delineated as US Public Land Survey System quarter-townships (Townsend et al. 2021). Each survey block encompassed ~2330 ha and was generally limited to the placement of a single motion-activated trail camera (Bushnell TrophyCam models 119636WI, 119836WI and 119837WI; Bushnell Outdoor Products, Overland Park, KS, USA) preset to take a burst of three photos (hereafter, trigger) anytime motion was detected with a 15-s delay before the next trigger. WDNR accepted volunteers into SSWI for empty survey blocks and provided them with all equipment and training to deploy the SSWI camera within their survey block, submit coordinates of camera location, and upload and classify photos from their SSWI camera. Trail cameras were required to be mounted 0.75–1.0 m off the ground on trees or posts, 3.0–5.0 m from a wildlife trail at a diagonal orientation with the lens parallel to the slope, facing north when possible, and >100 m from any structure, road or area used to bait wildlife (for additional details, please see Supplementary material).
Every 1–3 months, trail camera volunteers uploaded photos and classified the species and counts of wildlife in triggers. Some triggers were classified by other community scientists online on Zooniverse (see https://www.zooniverse.org/projects/zooniverse/snapshot-wisconsin, accessed 15 January 2022). For triggers with wild turkeys present, volunteers reported the number of adult turkeys and poults in the trigger, but did not further classify adults into counts of females, adult males and juvenile males. SSWI reports that volunteers correctly identified wild turkeys 99.7% of the time (see https://widnr-snapshotwisconsin.shinyapps.io/DataDashboard/). For this project, we expertly classified all triggers from June to August 2016–2020 that had wild turkey volunteer classification (from trail camera volunteers or Zooniverse classification) and we confirmed the presence of wild turkeys and provided counts of hens, adult males, juvenile males and poults. For triggers with poults present and no hen (12% of triggers with poults), we added a count of 1 hen assuming ≥1 hen was present but out-of-view of the camera.
Productivity metrics
We calculated commonly reported productivity metrics for wild turkeys using trail camera data: the percentage of successful hens and two versions of poult-to-hen ratio (i.e. poult-to-total-hen ratio and poult-to-successful-hen ratio) for each camera site by calendar week and year (Fig. 2). Generating productivity metrics from trail camera data is novel and therefore it was valuable to consider multiple manipulations of trail camera data that approximated productivity metrics from observation surveys (National Wild Turkey Federation Technical Committee 2018). Additionally, different metrics may capture separate components of the complex wild turkey behavior and reproduction process. For example, a poult-to-hen ratio that considers all hens (successful and unsuccessful) may best track the process of initially unsuccessful hens renesting and becoming successful and therefore adding more poults to the landscape. A poult-to-hen ratio that considers only successful hens may better track poult survival and changes within crèches (i.e. smaller broods in second nesting attempts) throughout the summer brood-rearing season.
Diagram of methods used to calculate three productivity metrics for eastern wild turkeys in Wisconsin, USA, from Snapshot Wisconsin trail camera data. Step 1 subset the turkey photo classifications into groups by each camera site, week, and year. Step 2 categorized photo classifications into three distinct categories based on whether there are only hens photographed, only poults photographed, or both hens and poults photographed. The hens photographed with poults are considered successful hens. Step 3 calculated three productivity metrics where the numerator and denominator consider different subsets of the photo categories.
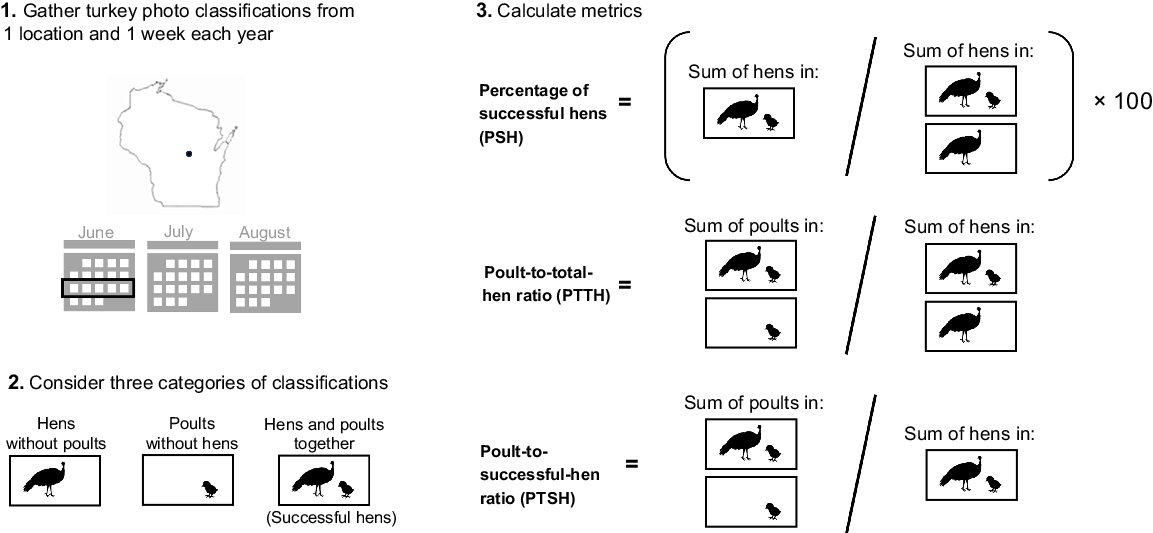
We calculated percentage of successful hens as the sum of hens in triggers that included ≥1 poult divided by the sum of hens in all triggers, poult-to-total-hen ratio as the sum of all poults divided by the sum of all hens, and poult-to-successful-hen ratio as the sum of all poults divided by the sum of hens in triggers that included ≥1 poult (Fig. 2, Table S1 of the Supplementary material). We calculated estimates for weeks within the months of June–August because few triggers of poults were captured prior to June, and after August it becomes difficult to distinguish poults from hens as poults have grown to nearly adult size.
Covariate modeling
We identified the proportion of agriculture, grassland, forest, deciduous hardwood, conifer and oak land cover types within a buffered area around each camera location to determine the effect of cover type on each productivity metric. The forest cover class was an aggregate of all forest cover (i.e. deciduous, coniferous, mixed and forested wetland). We used ArcGIS (ver. 10.7.1, Environmental Systems Research Institute, Redlands, CA, USA) to create 308-ha buffers around each camera location to represent the brood-rearing home range of female eastern wild turkeys (Pollentier 2012) and then used Wiscland 2.0 land cover data to identify the proportion of select cover types within the buffers (Wisconsin Department of Natural Resources 2016).
We estimated the effects of spatial and temporal covariates on percentage of successful hens, poult-to-total-hen ratio and poult-to-successful-hen ratio by creating 2 tiers of mixed-effect linear models for each productivity metric. We developed a suite of a priori models and conducted our analyses using an iterative approach by retaining the best-supported model within a model set for use as the base model for the subsequent model set (Burnham and Anderson 2002). All modeling was performed in R (ver. 4.1.1, R Foundation for Statistical Computing, Vienna, Austria, see https://www.r-project.org/) and mixed-effects models were run with package lme4 (ver. 1.1-35.2, see https://CRAN.R-project.org/package=lme4; Bates et al. 2015).
The first tier of models explored the effects of temporal covariates on each metric. This tier included the base model (site + year), site + year + week, site + year + week2 and site + year + month. We considered site and year (categorical) as random effects. We considered a quadratic effect of week to allow for a non-linear relationship between the metric and week. The second tier of models included the top-ranked tier 1 model for each metric and evaluated the effects of TMZ and the linear and quadratic (i.e. non-linear) effect of the proportion of land cover types. We only assessed single land cover types and quadratic relationships as this was largely an exploratory analysis of these spatial variables. We used Akaike’s Information Criterion with correction for small sample sizes (AICc) to assess models and retained the best-supported model (lowest AICc) for covariate interpretation and prediction. We report on models with high support (ΔAICc < 2) in each model set.
For our top-ranked tier 2 model of each metric, we calculated beta coefficients and associated upper and lower 95% confidence intervals (CI). We then used R package effects (ver. 4.2.2, https://cran.r-project.org/package=effects; Fox and Weisberg 2018, 2019) to calculate the predicted estimates for each covariate identified in the top model for each metric. We estimated and plotted wild turkey metrics by TMZ using the top model for an average year and site and with the average proportion of cover by TMZ for whichever land cover covariate was in the top model. We chose to predict metrics using the last time period (i.e. last week or last month) because it best reflected recruitment and the wild turkey population entering autumn, which is a time of great interest for wildlife managers and wild turkey management efforts.
Results
Productivity metrics
There was a large range in the number of cameras by TMZ with TMZ 7 having just 92 cameras and TMZ 1 having 441 cameras (mean number of cameras by TMZ = 197; Butkiewicz 2022). We classified 38,671 wild turkey triggers from June to August in 2016–2020. Hens were observed in 23,222 triggers and poults were observed in 6171. On average, 23.9% of the cameras captured ≥1 poult each year. Across all sites, years and weeks, we observed an average percentage of successful hens of 19.25% (range: 0–100%), poult-to-total-hen ratio of 0.56 (range: 0.00–11.00) and poult-to-successful-hen ratio of 2.79 (range: 0.25–11.00).
Covariate modeling
The top tier 1 model for percentage of successful hens included quadratic effect of week and random effects of year and site (wi = 0.81; Table 1). The top tier 2 model for percentage of successful hens included the top model from tier 1, TMZ, and the quadratic effect of proportion of conifer cover (wi = 0.56; Table 1). The model with a quadratic effect of grassland had some support as well (wi = 0.22; Table 1). Model results indicated that percentage of successful hens increased by 2.71% (Table 2) each week on average (Fig. 3a). The linear and quadratic effects of conifer cover were weak (Table 2), though the trend was positive (Fig. 3b, S1). The average percentage of successful hens by TMZ for the last week of August was 36.0% (range: 32.4–40.5%; Fig. 3c).
| Metric | Tier | Model structure | Model statistics | |||||
|---|---|---|---|---|---|---|---|---|
| K | AIC c | ΔAIC c | w i | Cum. w i | ||||
| PSH | 1 | week + week2 + year + site | 6 | 66,855.24 | 0.00 | 0.81 | 0.81 | |
| 2 | TMZ + conifer + conifer2 | 14 | 66,804.49 | 0.00 | 0.56 | 0.56 | ||
| 2 | TMZ + grassland + grassland2 | 14 | 66,806.33 | 1.84 | 0.22 | 0.78 | ||
| PTTH | 1 | week + year + site | 5 | 22,030.98 | 0.00 | 0.92 | 0.92 | |
| 2 | TMZ + grassland + grassland2 | 13 | 22,028.90 | 0.00 | 0.28 | 0.28 | ||
| 2 | TMZ + conifer | 12 | 22,029.61 | 0.72 | 0.20 | 0.48 | ||
| 2 | TMZ + conifer + conifer2 | 13 | 22,030.82 | 1.92 | 0.11 | 0.58 | ||
| PTSH | 1 | month + year + site | 5 | 7404.82 | 0.00 | 0.69 | 0.69 | |
| 2 | TMZ + oak + oak2 | 13 | 7398.55 | 0.00 | 0.36 | 0.36 | ||
Tier 1 models include the temporal covariates and tier 2 includes the spatial covariates. We included the top tier 1 model in each of the tier 2 models. For Model structure, the following represent the random effects: year, 2016–2020; site, trail camera location; and the following represent the fixed effects: week, calendar week 22–35; month, June–August; grassland, conifer, oak, proportion of land cover within 308-ha buffers around each camera location; Turkey Management Zone (TMZ). Furthermore, we only included models within 2 ΔAICc in the model set. The full model set is available in Table S2 of the Supplementary material. For Model statistics, model fit is described by the number of parameters (K), Akaike information criterion corrected for small sample sizes (AICc), change in AICc as compared with the top model (ΔAICc), AICc model weight (wi) and cumulative weight (Cum. wi).
| Metric | Covariate | Estimate | s.e. | Lower limit | Upper limit | |
|---|---|---|---|---|---|---|
| PSH | week | 2.71 | 0.10 | 2.52 | 2.90 | |
| week2 | −0.09 | 0.03 | −0.14 | −0.03 | ||
| conifer | 3.02 | 9.62 | −15.84 | 21.89 | ||
| conifer2 | 11.54 | 13.03 | −14.00 | 37.08 | ||
| PTTH | week | 0.07 | 0.00 | 0.06 | 0.08 | |
| grassland | −1.02 | 0.44 | −1.88 | −0.16 | ||
| grassland2 | 1.41 | 0.88 | −0.33 | 3.14 | ||
| PTSH | month | −0.34 | 0.06 | −0.45 | −0.22 | |
| oak | −1.13 | 1.00 | −3.08 | 0.83 | ||
| oak2 | 3.18 | 1.85 | −0.45 | 6.81 |
For covariates, week, calendar week 22–35; month, June–August; grassland, conifer, oak, proportion of land cover within 308-ha buffers around each camera location. All random and fixed effects from top models are available in Table S3 of the Supplementary material.
Patterns in eastern wild turkey productivity metrics as percentage of successful hens (row 1: panels a–c), poult-to-total-hen ratios (row 2: panels d–f) and poult-to-successful-hen ratios (row 3: panels g–i) in Wisconsin, USA, using Snapshot Wisconsin trail camera data from June to August 2016–2020. Each metric is shown varying through time in column 1 and with proportion of landcover in column 2 with other variables held at their average values (shaded light blue areas are 95% confidence intervals). Column 3 shows predicted metrics at an average site and year for the last time period (week for panels c and f, or month for panel i) and using each turkey management zone’s average proportion of coniferous forest (panel c), grassland (panel f) or oak (panel i). The time and landcover predictors were selected from each metric’s top tier 2 model (see text for model details).
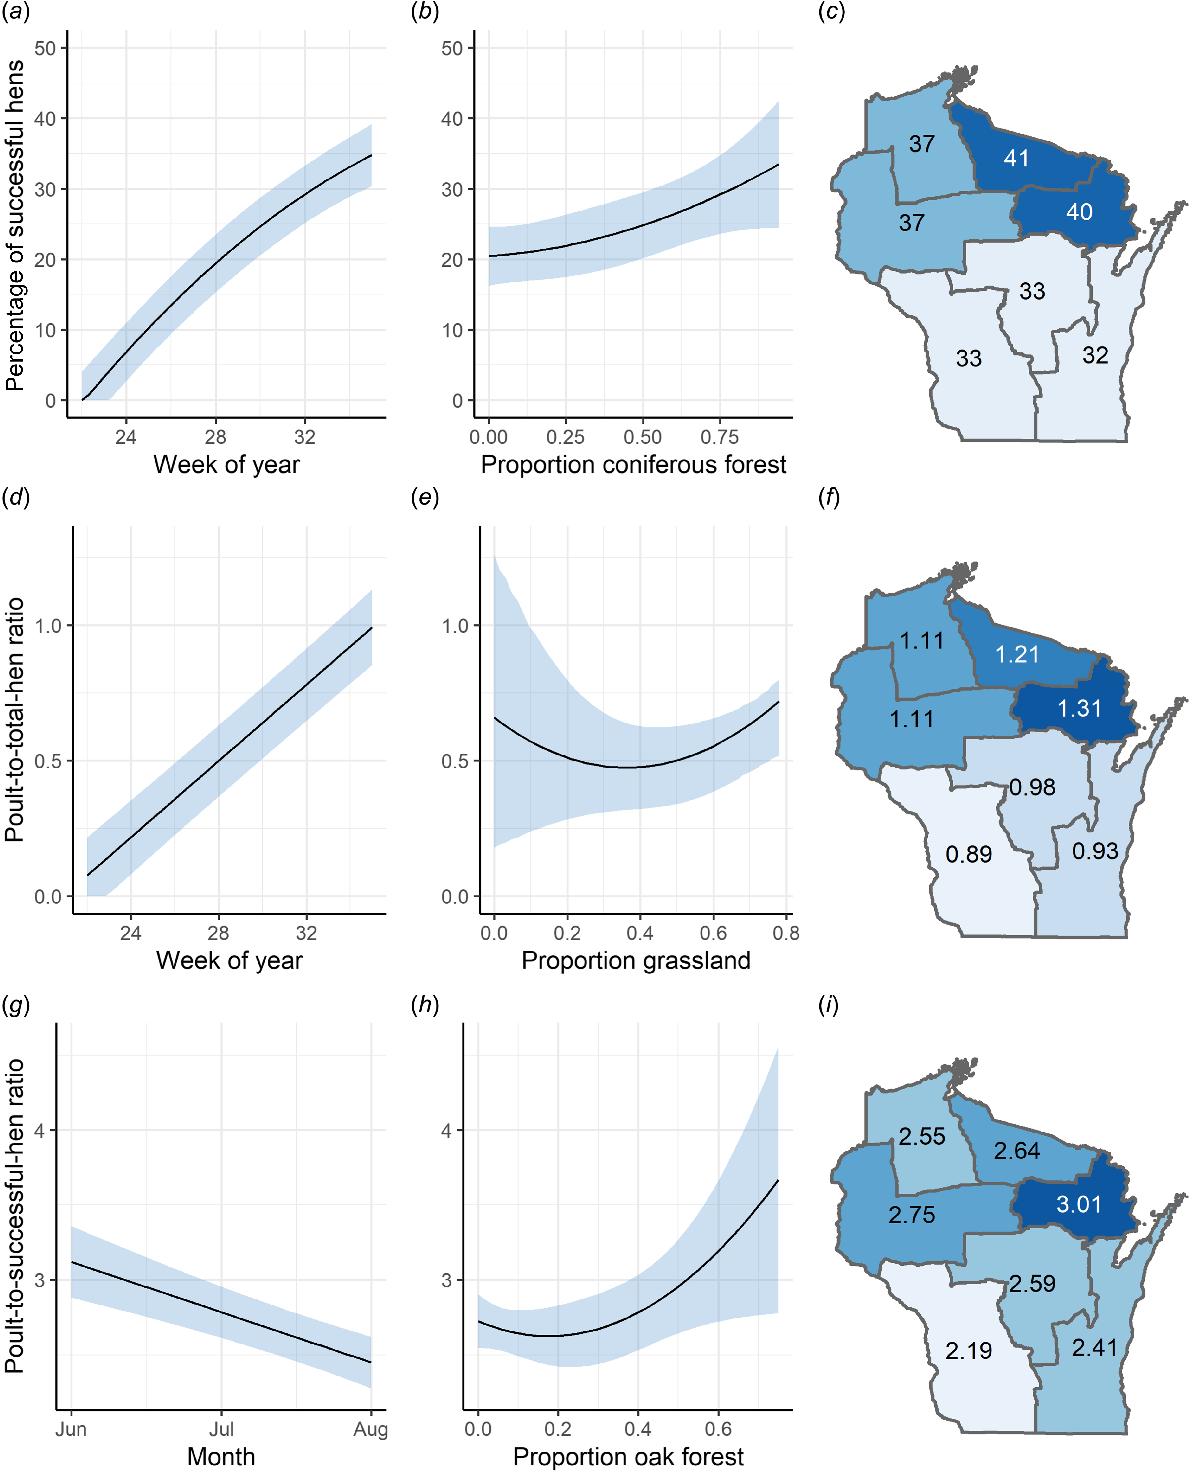
The top tier 1 model for poult-to-total-hen ratio included week and random effects of year and site (wi = 0.92; Table 1). The top tier 2 model for poult-to-total-hen ratio included the top model from tier 1, TMZ, and the quadratic effect of proportion of grassland cover (wi = 0.28; Table 1). Models with linear (wi = 0.20; Table 1) and quadratic effect (wi = 0.11; Table 1) of conifer cover were competing models. In the top tier 2 model, poult-to-total-hen ratio increased by 0.07 poults-per-hen each week on average (Table 2; Fig. 3d). Linear and quadratic effects of grassland (Table 2) were weak and poult-to-total-hen ratio was highest with less variability at higher grassland proportion (Fig. 3e, Fig. S1). Average poult-to-total-hen ratio by TMZ for the last week of August was 1.08 (range: 0.89–1.31; Fig. 3f).
The top tier 1 model for poult-to-successful-hen ratio included month and random effects of year and site (wi = 0.69; Table 1). The top tier 2 model for poult-to-successful-hen ratio included the top model from tier 1, TMZ, and the quadratic effect of proportion of oak cover (wi = 0.36; Table 1). From the top model, poult-to-successful-hen ratio decreased by 0.34 poults each month on average (Table 2; Fig. 3g). The linear and quadratic effects of oak (Table 2) were weak, though the trend was for higher poult-to-successful-hen ratios at sites with a higher proportion of oak cover (Fig. 3h, S1). The average predicted poult-to-successful-hen ratio by TMZ for August was 2.59 (range: 2.19–3.01; Fig. 3i).
Discussion
Our research demonstrates that SSWI provides a novel and viable technique for monitoring wild turkey productivity and recruitment. Through the review of 5 years of SSWI wild turkey trail camera triggers, we estimated the percentage of successful hens, poult-to-total-hen ratios, and poult-to-successful-hen ratios and explored temporal and spatial factors affecting these metrics. We also estimated wild turkey recruitment metrics for each TMZ as wild turkeys enter autumn, a time of year where practitioners are interested in population trends for informing harvest recommendations for the upcoming spring season. A timeline, where decision-makers meet in autumn to make decisions for spring turkey management (e.g. number of available harvest authorizations per TMZ), aligns well with the trail camera methods we outlined here. Further, the focus on August-only data decreases the photo classification task significantly. It is possible that wild turkey productivity estimates from this research are biased low, primarily due to poults being more difficult to detect and moving less than hens. If these metrics are biased low, they can still be useful indices of wild turkey productivity for wildlife managers, especially for considering trends in these metrics across TMZs and years.
Our productivity metrics were lower than those from brood observation survey reports from other Midwestern states, including Indiana, Iowa and Nebraska (Backs 2020; Coffey 2021; Meduna 2021). We are cautious to assume that Wisconsin’s wild turkey population has lower productivity because brood observation surveys and trail cameras use different data collection methods, even though both rely on opportunistic interactions with broods. Both methods can be affected by several sources of variation, including repeat counts and observations of crèches, and observation surveys can further be influenced by surveyor bias (i.e. skill or experience of the observer; Healy and Powell 1999; Wakeling et al. 2022). We believe the use of trail cameras reduces this observational bias (i.e. inaccurate counts which can result in over- or under-estimation) because trail cameras record observations when motion is detected irrespective of whether there is a single or multiple hens or a hen with or without a brood. Moreover, if an observer has previously encountered birds at a particular location (or even has prior knowledge of birds at a site from another source), then they may be more likely to record birds at subsequent surveys in a repeated counts framework. This phenomenon has been demonstrated in several species at a variety of locations and can lead to biased estimates of detection probability, occupancy and abundance (Riddle et al. 2010). This bias is minimized in the Snapshot Wisconsin approach because the triggers are randomized, and observers are not provided information about the location from which the triggers were taken. However, trail cameras may not be detecting hens and poults with equal probability as poults are smaller and more difficult to observe in the trail camera photos, especially young poults, potentially leading to lower productivity metrics from trail cameras. Ideally, future projects should evaluate SSWI trail camera detection rates for hens and poults throughout the summer brood-rearing season and pair trail camera photos of marked hens and broods with in-person flush counts and GPS tracking.
We observed strong positive relationships between a week and percentage of successful hens as well as poult-to-total-hen ratio. The denominator of total hens is the same for both metrics and there is high hen survival in summer (Pollentier et al. 2014b). As such, there is little reason to expect much change in total hens throughout summer. Therefore, the biological processes that increase the numerators of these metrics are what is most likely driving the positive trend through time. First, hens who have lost their first nest can have a successful renest attempt, adding poults to the landscape (i.e. increasing poult-to-total-hen ratios) and transitioning hens from unsuccessful to successful throughout summer (i.e. increasing percentage of successful hens). An additional reason for an increase in poult-to-total-hen ratio is explained by increased movement and detection of poults as they grow, become more mobile and expand their home range (Porter 1980; Anderson et al. 2011; Chamberlain et al. 2020). Initially, it may seem counterintuitive that we observed a strong negative relationship between month and poults-per-successful-hen ratios. However, the decrease in this metric through time becomes clearer when we understand what is happening both mathematically and biologically. First, the denominator is successful hens, and successful hens are increasing throughout summer because of successful renesting attempts. Also, the numerator (i.e. the total number of poults) is increasing through time because successful renest attempts are adding poults and all poults grow and become more detectable. So, although both the numerator and denominator are increasing, a decrease in this metric means that the proportional increase in poults is slower than the proportional increase in successful hens. We expect this could be due to a couple of factors. First, it is established that successful renest attempts typically result in fewer poults within a brood compared to initial nesting attempts. Therefore, later nests may be adding proportionally fewer poults compared to earlier nests (Vangilder and Kurzejeski 1995, Pollentier et al. 2014b). Also, poults experience high mortality until they reach near-adult size in late summer or early autumn (Pollentier et al. 2014b). It is not possible with the methods that we used to disentangle whether smaller broods later in summer or poult mortality was more important for the decline in poult-to-successful-hen ratio over summer. Seemingly, wild turkey productivity metrics from trail camera photos were able to capture the detection and survival process of poults throughout the summer brood-rearing period, thereby highlighting the utility of trail cameras to understand and monitor wild turkey populations. Our formulas for calculating productivity metrics from trail camera data appear to reflect productivity processes that we would expect for wild turkeys in summer.
In addition to exploring temporal covariate relationships, the SSWI data set was robust enough to support land cover modeling efforts. Our findings suggest that land cover has some effect on productivity metrics because models were stronger with the addition of land cover covariates. Both conifer and grassland cover appear to be important factors for predicting hen success and poult-to-total-hen ratios. Grassland and herbaceous vegetation provide nesting cover for hens to avoid ground predators and consistent foraging opportunities for growing poults (Pollentier et al. 2014b; Tyl et al. 2020), and conifers typically offer abundant overnight roosting opportunities and thermoregulation (Adey et al. 2024). Conversely, oak cover was more important for predicting the size of broods, or the recruitment potential of the population, and oak woodlands are regularly associated with numerous benefits for wildlife including wild turkeys (Steffen et al. 2002). While our research shows a relationship between single cover types and productivity metrics, the relationship is likely more complex. We did not explore interactions or other covariates as part of our research because the goal of our project was to explore the efficacy of trail camera data to generate wild turkey productivity metrics rather than a detailed assessment of the patterns in these metrics across the landscape. Future research could consider interactions between land cover types, spatial pattern and fragmentation of land cover types, and more detailed forest characteristics such as age class, tree density, stand size and canopy cover.
We observed variation in each productivity metric across TMZs with, in general, larger estimates in northern Wisconsin (TMZs 4–7) compared to southern portions of the state (TMZs 1–3), and larger estimates in eastern Wisconsin (TMZs 2, 3, 5 and 7) compared with western Wisconsin (TMZs 1, 4 and 6). Higher productivity indices in northern TMZs support anecdotal reports that the wild turkey population may be increasing in northern portions of Wisconsin where wild turkeys were more recently reestablished (Pollentier et al. 2021, 2023), whereas wild turkey populations in southern Wisconsin may be at a later stage of population growth and closer to carrying capacity. Alternatively, wild turkey populations in southern Wisconsin may have a different (i.e. lower) growth rate compared to northern Wisconsin. Similar observations in productivity metrics across TMZs have been made in Wisconsin upland game bird brood observation surveys (Pollentier et al. 2022, 2023).
Statewide trail camera networks can be used as a tool by wildlife managers to monitor wild turkey productivity and recruitment across time and space. SSWI uses community-based efforts to increase data input and reduce agency staff workloads to ultimately provide wildlife data at spatial and temporal scales that would be challenging to acquire otherwise. SSWI maintains high volunteer retention with >90% of volunteers staying with the program for ≥1 year, which is promising for considering collection of community-based wild turkey productivity metrics into the future. Improving efficiency by reducing the number of photos that need to be classified, and especially by volunteers, could further promote long-term sustainability for trail camera-based metrics. Based on this work, WDNR staff now use SSWI trail camera detections of turkeys in August (instead of June, July and August) to generate annual trail camera-based productivity and recruitment metrics. Further, future work should explore the relationship between productivity metrics determined from classifications of photos made by trained observer(s), as was the case for our research, and those identified from community-based classifications of photos. A strong predictive relationship would suggest that volunteer-classified wild turkey data could be effectively used to monitor wild turkey productivity, thereby saving costs associated with photo classification by paid staff. SSWI’s potential will continue to grow with additional years of data collection so that wildlife trends and productivity metrics can be tracked across years. We encourage other states to consider using statewide trail camera data to monitor wild turkeys and wildlife in general. If other states implemented programs like SSWI, these efforts could evolve into regional monitoring for more robust trend information and productivity metrics for wild turkeys and other wildlife.
Data availability
The data and code associated with this study are available in the Supplementary material.
Declaration of funding
Financial support was provided by US Fish and Wildlife Service Wildlife Restoration Grant to the Wisconsin Department of Natural Resources (Project W-160-P awarded to Christopher D. Pollentier and Jennifer L. Stenglein), Wisconsin Department of Natural Resources Wild Turkey Stamp Program (Project 370WMAS-WKOS awarded to Christopher D. Pollentier, Jennifer L. Stenglein and Jason D. Riddle), and University of Wisconsin—Stevens Point (award number STP100166, Gerald and Helen Stephens Professorship Endowment, and the Doug Stephens Boone and Crockett Undergraduate Research Fellowship, awarded to Jason D. Riddle).
Acknowledgements
Thanks to everyone who made this research possible. We thank the Wisconsin Department of Natural Resource’s Snapshot Wisconsin team and the Office of Applied Science, including C. Anhalt-Depies, E. Donovan, S. Hull, D. MacFarland, G. Stauffer and E. Wildey. A special thanks to the thousands of Snapshot Wisconsin volunteers who were essential to data collection and processing, including trail camera hosts and Zooniverse photo classifiers. We are grateful for the guidance and support offered by C. Sartini and B. Sedinger throughout this project.
References
Adey EA, Baici JE, Bowman J (2024) Seasonal roost selection of wild turkeys at their northern range edge. Wildlife Biology 2024, e01133.
| Crossref | Google Scholar |
Anderson RG, Pelren E, Redding T (2011) A guide for field-aging wild turkey poults during summer brood production surveys. In ‘Proceedings of the Tenth National Wild Turkey Symposium: Managing Wild Turkeys in the Face of Uncertainty’, 11–13 January 2011, Shepherdstown, WV, USA. (Ed. GW Norman) pp. 93–99. (National Wild Turkey Federation: Edgefield, SC, USA)
Attig JW, Bricknell M, Carson EC, Clayton L, Johnson MD, Mickelson DM, Syverson KM (2011) Glaciation of Wisconsin. (Wisconsin Geological and Natural History Survey: Madison, WI, USA) Available at https://wgnhs.wisc.edu/catalog/publication/000185/resource/es0362011 [Verified 17 July 2025]
Backs SE (2020) Wild turkey summer brood production indices – 2020. Wildlife Management and Research Notes number 2067. (Indiana Department of Natural Resources: Indianapolis, IN, USA) Available at https://www.in.gov/dnr/fish-and-wildlife/files/wmr/fw-MR_2067_Wild_Turkey_Brood_Production_2020.pdf [Verified 17 July 2025]
Backs SE, McCallen EB (2023) Wild turkey summer brood production indices – 2022. Wildlife Management and Research Notes number 2078. (Indiana Department of Natural Resources: Indianapolis, IN, USA) Available at https://www.in.gov/dnr/fish-and-wildlife/files/wmr/fw-MR_2078_Wild_Turkey_Brood_Survey_2022.pdf [Verified 17 July 2025]
Bates D, Mächler M, Bolker B, Walker S (2015) Fitting linear mixed-effects models using lme4. Journal of Statistical Software 67(1), 1-48.
| Crossref | Google Scholar |
Brautigam KJ, Osborne DC, White D, Jr (2016) Photographic evidence and chronology of nest parasitism by a wild turkey (Meleagris gallopavo). The Wilson Journal of Ornithology 128, 204-207.
| Crossref | Google Scholar |
Burton AC, Neilson E, Moreira D, Ladle A, Steenweg R, Fisher JT, Bayne E, Boutin S (2015) Wildlife camera trapping: a review and recommendations for linking surveys to ecological processes. Journal of Applied Ecology 52, 675-685.
| Crossref | Google Scholar |
Byrne ME, Chamberlain MJ, Collier BA (2016) Potential density dependence in wild turkey productivity in the southeastern United States. In ‘Proceedings of the Eleventh National Wild Turkey Symposium’, 5–7 January 2016, Tucson, AZ, USA. (Ed. D Miller) pp. 329–351. (National Wild Turkey Federation: Edgefield, SC, USA)
Casalena MJ, Schiavone MV, Bowling AC, Gregg ID, Brown J (2016) Understanding the new normal: wild turkeys in a changing northeastern landscape. In ‘Proceedings of the Eleventh National Wild Turkey Symposium’, 5–7 January 2016, Tucson, AZ, USA. (Ed. D Miller) pp. 45–57. (National Wild Turkey Federation: Edgefield, SC, USA)
Chamberlain MJ, Cohen BS, Bakner NW, Collier BA (2020) Behavior and movement of wild turkey broods. Journal of Wildlife Management 84, 1139-1152.
| Crossref | Google Scholar |
Chamberlain MJ, Hatfield M, Collier BA (2022) Status and distribution of wild turkeys in the United States in 2019. Wildlife Society Bulletin 46, e1287.
| Crossref | Google Scholar |
Dreibelbis JZ, Melton KB, Aguirre R, Collier BA, Hardin J, Silvy NJ, Peterson MJ (2008) Predation of Rio Grande wild turkey nests on the Edwards Plateau, Texas. The Wilson Journal of Ornithology 120, 906-910.
| Crossref | Google Scholar |
Ericksen RE, Hughes TW, Brown TA, Akridge MD, Scott KB, Penner CS (2016) Status and distribution of wild turkey in the United States: 2014 status. In ‘Proceedings of the Eleventh National Wild Turkey Symposium’, 5–7 January 2016, Tucson, AZ, USA. (Ed. D Miller) pp. 7–18. (National Wild Turkey Federation: Edgefield, SC, USA)
Fox J, Weisberg S (2018) Visualizing fit and lack of fit in complex regression models with predictor effect plots and partial residuals. Journal of Statistical Software 87(9), 1-27.
| Crossref | Google Scholar |
Isabelle JL, Butler AB, Ruth C, Lowery DK (2018) Considerations for timing of spring wild turkey hunting seasons in the southeastern United States. Journal of the Southeastern Association of Fish and Wildlife Agencies 5, 106-113.
| Google Scholar |
Johnson E, Danks Z (2022) 2022 Kentucky wild turkey brood survey report. (Kentucky Department of Fish and Wildlife Resources: Frankfort, KY, USA) Available at https://fw.ky.gov/Hunt/Documents/ky_brood_2020_report.pdf [Verified 12 September 2023]
McRoberts JT, Wallace MC, Eaton SW (2020) Wild turkeys (Meleagris gallopavo) (version 1.0). In ‘Birds of the world’. (Ed. AF Poole) (Cornell Lab of Ornithology: Ithaca, NY, USA) 10.2173/bow.wiltur.01
Meduna L (2021) 2020 Nebraska turkey brood survey report. (Nebraska Game and Parks Commission: Lincoln, NB, USA) Available at https://outdoornebraska.gov/wp-content/uploads/2023/03/2020-Nebraska-Turkey-Survey-Report.pdf [Verified 17 July 2025]
Melville HIAS, Conway WC, Morrison ML, Comer CE, Hardin JB (2014) Artificial nests identify possible nest predators of eastern wild turkeys. Southeastern Naturalist 13, 80-91.
| Crossref | Google Scholar |
Oakley N, Glick C (2022) 2022 Missouri wild turkey brood survey results. (Missouri Department of Conservation: Jefferson City, MO, USA) Available at https://archive.org/details/2022WildTurkeyBroodSrvy [Verified 17 July 2025]
O’Brien TG, Kinnaird MF (2008) A picture is worth a thousand words: the application of camera trapping to the study of birds. Bird Conservation International 18, S144-S162.
| Crossref | Google Scholar |
Paisley RN, Wright RG, Kubisiak JF, Rolley RE (1998) Reproductive ecology of eastern wild turkeys in southwestern Wisconsin. Journal of Wildlife Management 62, 911-916.
| Crossref | Google Scholar |
Parent CJ, Stevens BS, Bowling AC, Porter WF (2016) Wild turkey harvest trends across the Midwest in the 21st Century. In ‘Proceedings of the Eleventh National Wild Turkey Symposium’, 5–7 January 2016, Tucson, AZ, USA. (Ed. D Miller) pp. 211–223. (National Wild Turkey Federation: Edgefield, SC, USA)
Pollentier CD, Hull SD, Lutz RS (2014a) Eastern wild turkey demography: sensitivity of vital rates between landscapes. Journal of Wildlife Management 78, 1372-1382.
| Crossref | Google Scholar |
Pollentier CD, Lutz RS, Hull SD (2014b) Survival and productivity of eastern wild turkey females in contrasting landscapes in Wisconsin. Journal of Wildlife Management 78, 985-996.
| Crossref | Google Scholar |
Pollentier CD, Hardy MA, Lutz RS, Hull SD, Zuckerberg B (2021) Gobbling across landscapes: eastern wild turkey distribution and occupancy-habitat associations. Ecology and Evolution 11, 18248-18270.
| Crossref | Google Scholar | PubMed |
Pollentier CD, Rees Lohr J, Dhuey B (2022) Upland game bird brood observation survey, 2022. Wisconsin Wildlife Surveys. (Wisconsin Department of Natural Resources: Madison, WI, USA) Available at https://dnr.wisconsin.gov/topic/WildlifeHabitat/reports.html [Verified 13 March 2023]
Pollentier CD, Rees Lohr J, Finger T (2023) Upland game bird brood observation survey, 2023. Wisconsin Wildlife Surveys. (Wisconsin Department of Natural Resources: Madison, WI, USA) Available at https://dnr.wisconsin.gov/topic/WildlifeHabitat/reports.html [Verified 8 November 2023]
Porter WF, Nelson GC, Mattson K (1983) Effects of winter conditions on reproduction in a northern wild turkey population. Journal of Wildlife Management 47, 281-290.
| Crossref | Google Scholar |
Rees Lohr J (2018) Ten-week brood observations, 2018. (Wisconsin Department of Natural Resources: Madison, WI, USA) Available at https://p.widencdn.net/osiekv/tenwkbrood2 [Verified 17 July 2025]
Riddle JD, Mordecai RS, Pollock KH, Simons TR (2010) Effects of prior detections on estimates of detection probability, abundance, and occupancy. Auk 127, 94-99.
| Crossref | Google Scholar |
Roberts SD, Coffey JM, Porter WF (1995) Survival and reproduction of female wild turkeys in New York. Journal of Wildlife Management 59, 437-447.
| Crossref | Google Scholar |
Ruttinger JA, Colbert DS, Warren RJ, Conner LM, Chamberlain MJ (2014) Using thermal imaging cameras with radiotelemetry to locate roost sites of male wild turkeys. Wildlife Society Bulletin 38, 884-886.
| Crossref | Google Scholar |
Steenweg R, Hebblewhite M, Kays R, Ahunada J, Fisher JT, Burton C, Townsend SE, Carbone C, Rowcliffe JM, Whittington J, Brodie J, Royle JA, Switalski A, Clevenger AP, Heim N, Rich LN (2017) Scaling up camera traps: monitoring the planet’s biodiversity with networks of remote sensors. Frontiers in Ecology and the Environment 15, 26-34.
| Crossref | Google Scholar |
Stenglein JL, Donovan EB, Pollentier CD, Peltier TR, Lee SM, McDonnell AB, Kardash LH, MacFarland DM, Hull SD (2023) Comparison of in-person and remote camera lek surveys for prairie grouse (Tympanuchus spp.). Wildlife Society Bulletin 47(4), e1499.
| Crossref | Google Scholar |
Tapley JL, Hatfield MA, Abernethy RK, Kennamer JE (2005) Status and distribution of the wild turkey in 2004. In ‘Proceedings of the Ninth National Wild Turkey Symposium: Wild Turkey Management: Accomplishments, Strategies, and Opportunities’, 10–14 December 2000, Grand Rapids, MI, USA. (Eds CA Stewart, VR Frawley) pp. 21–31. (National Wild Turkey Federation: Edgefield, SC, USA)
Tapley JL, Abernethy RK, Hatfield M, Kennamer JE (2011) Status and distribution of the wild turkey in 2009. In ‘Proceedings of the Tenth National Wild Turkey Symposium: Managing Wild Turkeys in the Face of Uncertainty’, 11–13 January 2011, Shepherdstown, WV, USA. (Ed. GW Norman) pp. 19–30. (National Wild Turkey Federation: Edgefield, SC, USA)
Townsend PA, Clare JDJ, Liu N, Stenglein JL, Anhalt-Depies C, Van Deelen TR, Gilbert NA, Singh A, Martin KJ, Zuckerberg B (2021) Snapshot Wisconsin: networking community scientists and remote sensing to improve ecological monitoring and management. Ecological Applications 31, e02436.
| Crossref | Google Scholar | PubMed |
Tyl RM, Rota CT, Lehman CP (2020) Factors influencing productivity of eastern wild turkeys in northeastern South Dakota. Ecology and Evolution 10, 8838-8854.
| Crossref | Google Scholar | PubMed |
Vangilder LD, Kurzejeski EW (1995) Population ecology of the eastern wild turkey in northern Missouri. Wildlife Monographs 130, 1-50.
| Google Scholar |
Wakeling BF, Sandrini JM, Lerich SP, Cardinal C (2022) A review of harvest and population monitoring methods for western wild turkeys. Wildlife Society Bulletin 46, e1281.
| Crossref | Google Scholar |
Wisconsin Department of Natural Resources (2016) Wiscland. Version 2.0. (Wisconsin Department of Natural Resources: Madison, WI, USA) Available at https://dnr.wisconsin.gov/maps/WISCLAND [Dataset]
Wisconsin Department of Natural Resources (2025) Snapshot Wisconsin: a volunteer-based project for wildlife monitoring. (Wisconsin Department of Natural Resources: Madison, WI, USA) Available at https://dnr.wisconsin.gov/topic/research/projects/snapshot [Verified 6 March 2025]
Wisconsin State Climatology Office (2023) Past Wisconsin climate. Available at https://www.aos.wisc.edu/~sco/clim-history/index.html [Verified 12 December 2023]