

Improving the nutrition of Merino ewes during pregnancy and lactation increases weaning weight and survival of progeny but does not affect their mature size
A. N. Thompson A D E H , M. B. Ferguson A D E , A. J. D. Campbell B , D. J. Gordon A F , G. A. Kearney A G , C. M. Oldham C and B. L. Paganoni CA Department of Primary Industries Victoria, Private Bag 105, Hamilton, Vic. 3300, Australia.
B Faculty of Veterinary Science, University of Melbourne, 250 Princes Highway, Werribee, Vic. 3030, Australia.
C Department of Agriculture and Food Western Australia, 3 Baron-Hay Court, South Perth, WA 6151, Australia.
D Present address: Department of Agriculture and Food Western Australia, 3 Baron-Hay Court, South Perth, WA 6151, Australia.
E Present address: School of Veterinary and Biomedical Sciences, Murdoch University, 90 South Street, Murdoch, WA 6150, Australia.
F Present address: Rural Industries Skills Training, Private Bag 105, Hamilton, Vic. 3300, Australia.
G Present address: 36 Payne Road, Hamilton, Vic. 3300, Australia.
H Corresponding author. Email: andrew.thompson@agric.wa.gov.au
Animal Production Science 51(9) 784-793 https://doi.org/10.1071/AN09139
Submitted: 18 October 2009 Accepted: 25 January 2011 Published: 14 September 2011
Journal Compilation © CSIRO Publishing 2011 Open Access CC BY-NC-ND
Abstract
Lamb growth to weaning, and during the period immediately following weaning, influences post-weaning mortality and may affect mature size. The hypothesis tested in the experiments reported in this paper was that changes in the maternal liveweight of Merino ewes during pregnancy and lactation could predict the weight at weaning, post-weaning survival and mature size of their progeny. At two sites (Vic. and WA) in each of two years, a wide range in the liveweight profiles of ewes was generated during pregnancy and lactation by varying the amount of supplements fed and feed on offer grazed. Across the four experiments this resulted in progeny weights ranging from 13.8 to 28.3 kg just before weaning. Lamb growth was primarily related to the amount of feed on offer during lactation, but was also related to the liveweight change of the ewe during pregnancy. These relationships were consistent in both experiments at each site. Weaning weight was strongly associated with post-weaning survival at the Vic. site. Survival rates decreased significantly when weaning weights were below 20 kg. These results indicate that management of ewe and lamb nutrition to maximise growth of lambs before weaning and growing weaners at 30 g/day or more after weaning are important for optimal post-weaning survival. The findings also suggest that the mature size of offspring is unlikely to be adversely affected by pre-weaning nutrition within the range of nutritional scenarios during pregnancy and lactation that are likely to be experienced within the Australian sheep industry.
Introduction
Lamb growth to weaning and during the period immediately following weaning influences post-weaning mortality (Hatcher et al. 2008; Hocking-Edwards et al. 2008; Campbell et al. 2009). The lightest 20% of Merino weaners within a flock are ~3 times more likely to die than those from the middle 20% of weaning weights, and Campbell et al. (2009) reported that increasing growth rates from ~10 to 20 g/day during the 5 months after weaning reduced the risk of mortality by more than 70%. If restriction of growth of sheep before weaning is severe and prolonged the growth of muscle and bone may be limited (Greenwood et al. 1998, 2000; Tygesen et al. 2007) and ultimately mature size may or may not be reduced (Schinckel and Short 1961; Everitt 1967; Krausgrill et al. 1997; Kelly et al. 2006).
Lamb growth to weaning is largely determined by intake of milk (Doney and Peart 1976; Snowder and Glimp 1991) and increasing the dietary energy intake of ewes during lactation increases ewe milk production and lamb growth (Langlands 1977; Jordan and Mayer 1989). However, often the nutritional demands of lactation are not met from pasture alone, resulting in mobilisation of maternal fat reserves (Gibb and Treacher 1980; Vernon and Finley 1985). Under these conditions ewe milk production and lamb growth to weaning is greatest for ewes that have more fat to mobilise (Brand and Franck 2000; Lambe et al. 2005). Ewes in better condition at lambing due to improved nutrition during pregnancy have more fat to mobilise (McNeill et al. 1997) and it is reasonable to expect that they will produce more milk and have progeny with higher weaning weights, especially if pasture intake during lactation is limiting. Therefore, the weight of lambs at weaning represents the cumulative effects of maternal nutrition during pregnancy and lactation, although the effects of varying nutrition during lactation are likely to be greater than those due to varying nutrition during pregnancy.
Previous studies of the impacts of nutrition during pregnancy and lactation on postnatal development have often considered either extreme nutritional regimes that are beyond the limits experienced on most farms or have compared insufficient treatments to quantify the ewe and progeny production responses to changes in ewe nutrition (Schinckel and Short 1961; Everitt 1967; Allden 1968; Kelly et al. 2006). Furthermore, few studies have reported effects of varying the amounts of feed on offer and of liveweight or change in liveweight of ewes during different stages of pregnancy and lactation on progeny growth rates and subsequent survival and size at maturity. In this regard, the liveweight profile of individual Merino ewes during pregnancy and lactation can predict their fleece characteristics and reproductive performance (Ferguson et al. 2011) and the birthweight and survival of their lambs (Oldham et al. 2011). Therefore, in this study we tested the hypothesis that the liveweight profile of Merino ewes during pregnancy and lactation can also reliably predict the weight at weaning, post-weaning survival and mature size of their progeny.
Materials and methods
Experimental sites and design
Experiments were conducted in 2001 and 2002 at two sites located on commercial properties near Hamilton in Victoria (Vic.; 141.7°E/41′25″, –37.6°S/36′1″) and Kendenup in Western Australia (WA; 117.6°E/37′25″, –34.5°S/29′13″). Both sites experience predominantly winter/spring rainfall, and dry, hot summers, with a long-term average annual rainfall of 590 and 540 mm for the Vic. and WA sites. Actual rainfall received in 2001 and 2002 was 717 and 548 mm at the Vic. site and 522 and 466 mm at the WA site. The pastures at the Vic. and WA sites were based on perennial grasses (Lolium perenne and Phalaris aquatica) and annual grasses (Lolium rigidum), respectively, with a much higher proportion of subterranean clover in the pastures at the WA than Vic. site over the 2 years (46 versus 11%). Further details of experimental sites, nutritional treatments, pasture management and measurements, and ewe management and measurements are provided by Ferguson et al. (2011), and details on the management of progeny and their measurements and performance from birth to maturity are reported by Oldham et al. (2011) and Thompson et al. (2011).
In brief, a 2 by 5 factorial design was used in each experiment with three (Vic.) or two (WA) replicates of 10 treatments. Adult ewes in condition score 2.5–3.0 (Jefferies 1961) at artificial insemination (Day 0) were: (i) managed to achieve target condition scores of 2 or 3 at Day 100 of pregnancy; and then (ii) grazed on five target amounts of feed on offer (800, 1100, 1400, 2000 or 3000 kg DM/ha) from Day 100 of pregnancy until weaning (Vic.) or when pasture growth could no longer maintain feed on offer targets (WA). Feed on offer was defined as the total amount of green pasture available above ground (Thompson et al. 1994). The lambs at the WA site were weaned 20–30 days after removal from plots. The ewes were artificially inseminated using semen from four fine wool bloodlines and ~20 sires were used at each site each year.
Experimental sheep and management
Plots at the Vic. site were grazed with 303 single- and 375 twin-bearing Merino ewes in 2001 and 467 single- and 219 twin-bearing ewes in 2002. At the WA site 320 single-bearing ewes were used in each experiment. Feed on offer for each plot was maintained near target levels by adding and removing additional dry sheep (Vic.) or adjusting the area grazed by experimental sheep (WA). Feed on offer was assessed at 1- to 2-week intervals from the break of season until the end of the experimental period by calibrated visual assessment (Thompson et al. 1994), and pasture composition was estimated at 3–5 key times during pregnancy and lactation in each experiment using the ‘toe-cut’ method (Cayley and Bird 1996).
Ewe and progeny measurements
Ewes were weighed and condition scored approximately monthly at the Vic. site and every 2 weeks at the WA site during pregnancy and lactation, except for a 5–6-week period immediately following artificial insemination when ewes were not handled. They were weighed and condition scored every 1–2 months between weaning and the subsequent shearing. All ewe liveweights reported in this paper were adjusted for the predicted conceptus weight and the weight of greasy wool estimated using the dyeband technique as described by Ferguson et al. (2011).
Ewes lambed in the plots and ewes and lambs remained in the plots until weaning (Vic.) or 20–30 days prior to weaning (WA). Lambing commenced in late August at the Vic. site and late July at the WA site. All lambs were weighed and tagged within 24 h of birth and their weight, sex and dam identification recorded as reported by Oldham et al. (2011). Lambs were weighed every 2–4 weeks until weaning at ~11 weeks of age at the Vic. site and at 16 weeks of age at the WA site.
After weaning, all progeny at each site were grazed together until they were at least 2.5 years of age. They were weighed every 1–2 months until 12 months of age and then up to 3 times per year until 33 or 63 months of age at the WA and Vic. sites, respectively. Faecal samples were collected from a subsample of weaners at least monthly for measurement of the number of worm eggs, and from all progeny on one to four occasions during the first 12 months. All progeny were drenched if the average egg counts exceeded 200/g faeces. A weaner was recorded to have died if it was missing at consecutive weighings and shearing.
Statistical analyses
All statistical analyses except the survival analysis were performed using Genstat (Genstat Committee 2008). The method of restricted maximum likelihood was used to fit progeny liveweight data with target ewe condition score at Day 100 of pregnancy, target feed on offer during late pregnancy and lactation, ewe age, progeny sex and rear type as fixed effects where appropriate. Year, experimental blocking and sire were fitted as random effects.
Estimates of progeny survival were assessed by fitting General Linear Mixed Models using Genstat (Genstat Committee 2008). The approach used a logit-transformation and binomial distribution in additive models. Logits were predicted as a function of target ewe condition score at Day 100 of pregnancy and target feed on offer during late pregnancy and lactation. Progeny sex and rear type were fitted as fixed effects where appropriate and year, experimental blocking and sire were fitted as random effects.
Data generated from the four experiments were then utilised to determine whether liveweight or change in liveweight of individual ewes or average feed on offer during specific periods could predict progeny growth to mature size. Progeny growth and liveweight was predicted using restricted maximum likelihood where independent variables included ewe liveweight at joining, ewe liveweight change at joining until Day 100 of pregnancy, ewe liveweight change from Day 100 of pregnancy until lambing, and ewe liveweight change or average feed on offer from lambing until lamb weaning (or when removed from plots at the WA site). Ewe age, and rearing type and sex of progeny were fitted as fixed effects where appropriate, and year, experimental blocking and sire were fitted as random effects. All possible models were examined to define statistical significance of effects and interactions accepted at P < 0.05.
Analysis of duration of survival in the first year after weaning was performed using Stata Statistical Software for Windows version 8.2 (StataCorp LP 2005). Duration of survival was estimated from the dates when weaners were weighed, assuming death occurred at the midpoint of the interval between consecutive weighings. Multivariable survival analysis was performed on data from all four experiments using the Cox proportional hazards model (Cox 1972). This model describes the effects of a factor in terms of a hazard ratio, which is the relative change in mortality rate associated with a change in the covariate’s value. Factors included in the model were fleece-free liveweight at weaning, sex, rear type, and average treatment fleece-free growth rate over three time periods post-weaning, namely Day 0–150, Day 151–235 and Day 235 to ~370. These latter two average growth rates were expressed as ‘time-varying covariates’ (Hosmer and Lemeshow 1999) so that they could be properly accommodated in the analysis. Models were developed using purposeful forward selection of covariates, specifying clustering at the level of experiment.
Results
Ewe liveweight and condition score profiles
The average (±s.e.m) liveweight and condition score of the ewes at or just before artificial insemination in 2001 and 2002 were 46 ± 0.2 kg and condition score 2.7 ± 0.01 and 45 ± 0.2 kg and condition score 3.0 ± 0.01 at the Vic. site, and 46 ± 0.3 kg and condition score 2.9 ± 0.02 and 47 ± 0.3 kg and condition score 2.5 ± 0.03 at the WA site. On average across all experiments, the nutritional treatments which commenced following artificial insemination generated differences in ewe liveweight and condition score by Day 100 of pregnancy of 7.1 kg (range 5.5–8.7 kg) and 0.7 of a condition score (range 0.6–0.8). Grazing different feed on offer levels from Day 100 of pregnancy amplified the spread in ewe liveweight and condition score between treatments, such that the average differences between extreme treatments at lambing were 9.7 kg (range 4.9–14.3 kg) and 1.1 of a condition score (range 0.5–1.6) and at weaning 15.5 kg (range 12.5–22.7 kg) and 1.4 of a condition score (range 0.9–2.3).
Progeny growth rates to weaning
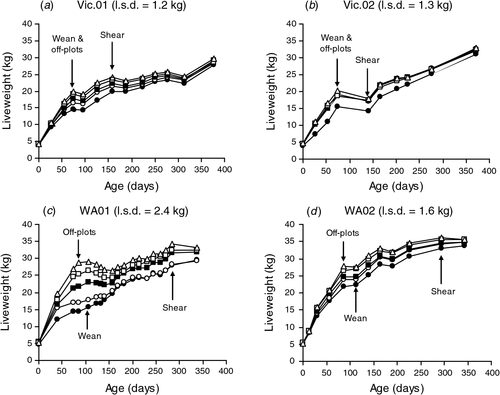
The nutritional treatments imposed generated different liveweight profiles for the progeny from birth to 1 year of age at the Vic. (Fig. 1a, b) and WA sites (Fig. 1c, d) in both experiments. At the WA site, there was no significant difference in the liveweight of progeny when they were removed from plots and when they were actually weaned 20–30 days later. Across all four experiments, there was no significant difference in average weaning weight of progeny from ewes managed to target condition score 2 or 3 at Day 100 of pregnancy, respectively (20.1 versus 20.3 kg; P > 0.05). The effects of feed on offer treatments from Day 100 of pregnancy on progeny growth were much greater; the range in liveweights at weaning between progeny from the 800 and 3000 kg DM/ha feed on offer treatment in 2001 and 2002 was 14.9–20.3 kg and 13.8–20.0 kg at the Vic. site and 15.4–28.3 kg and 22.4–27.7 kg at the WA site, respectively (Table 1).
At the Vic. site single-born and reared progeny were significantly heavier at weaning than those born as a twin and raised as a twin (19.1 versus 14.1 kg, P < 0.001). The weaning weight of single-born and reared progeny was similar to the weaning weight of progeny born as a twin and reared as a single. There was also no significant difference in weaning weights at the Vic. site between wether and ewe progeny (17.0 versus 16.6 kg; P > 0.05), but on average wethers were heavier than ewes at the WA site (24.5 versus 22.8 kg; P < 0.05). For progeny weaning weight, there were no significant interactions between target ewe condition score at Day 100 of pregnancy, target feed on offer during late pregnancy and lactation, ewe age, progeny sex and progeny rearing type.
|

|
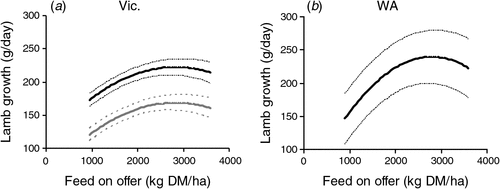
The growth rates of progeny from birth to when they were removed from plots at or near weaning increased curvilinearly (P < 0.001) with increasing feed on offer during lactation (Fig. 2). On average, across sites and years, ~40% of the variation in growth rates of individual progeny was explained by average feed on offer during lactation and no additional variance in growth rates of progeny was explained by including botanical composition of the pasture. The relationships between feed on offer and progeny growth rate were similar in both experiments at each site but differed between sites, progeny sex and rearing type at the Vic. site. The feed on offer needed to achieve progeny growth rates in excess of 90% of the maximum (achieved at 3000 kg DM/ha) was 1600–1700 kg DM/ha at the Vic. site and 1900–2000 kg DM/ha at the WA site (Fig. 2). On average, single-born and reared progeny at the Vic. site grew 7 and 51 g/day faster than those born as twins and reared as singles or twins, respectively. Wether progeny grew 5 and 12 g/day faster than ewe progeny at the Vic. and WA sites.
|
Progeny growth rate from birth to when they were removed from plots near weaning was also influenced by the liveweight profile of the ewe during pregnancy but not during lactation. Progeny from ewes which were heavier at joining or performed better between conception and Day 100 of pregnancy or during late pregnancy grew faster to weaning (Table 2). However, at both sites an extra kg of ewe liveweight at joining or liveweight gain during pregnancy increased growth of progeny to weaning by only 1–2 g/day. It was not possible to isolate the specific effects of changes in ewe liveweight during the different periods of pregnancy per se, but the effects on lamb growth rate of ewe liveweight during the different periods were additive. Consequently, the effects of poor nutrition before Day 100 of pregnancy could be completely overcome by improving nutrition during late pregnancy, but these effects of ewe liveweight profile during pregnancy on the growth rate of progeny were relatively small compared with the effects of feed on offer during lactation. None of the interactions between feed on offer during lactation or ewe liveweight parameters and progeny sex or rearing type were significant (all P > 0.05) for progeny growth rates to weaning.

|
Progeny growth from weaning to maturity
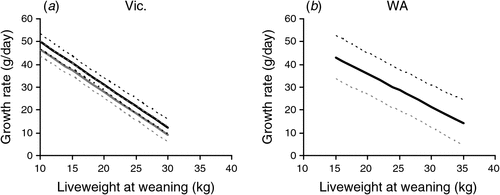
Progeny from low feed on offer treatments were lighter at weaning and grew more rapidly than heavier weaners after weaning when all progeny grazed together (Table 1). The growth rate responses to differences in weight at weaning were similar for both years at each site (Fig. 3a, b). At the Vic. site, growth rates during the first 5 months post-weaning declined by 1.9 g/day for each additional 1 kg of liveweight at weaning, and wether progeny grew marginally quicker (3 g/day; P < 0.05) than ewe progeny irrespective of weaning weight (Table 3). At the WA site, growth rates decreased by 1.4 g/day for each additional 1 kg of liveweight at weaning, which was not significantly different to the response at the Vic. site, and there was no significant effect of progeny sex on growth rates in either year.
|
|
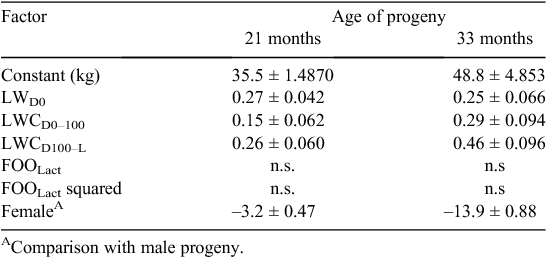
Despite this compensatory growth after weaning, the effects of nutritional treatment on progeny liveweight were still significant (P < 0.001) at 12 months of age in both experiments and at both sites (Fig. 1). Indeed, differences in progeny liveweight due to ewe nutrition during early and mid pregnancy or late pregnancy and lactation persisted beyond 39 months of age at the Vic. site (Table 4) and 33 months of age at the WA site (Table 5). When evident, the effects of ewe liveweight changes to Day 100 of pregnancy and between Day 100 of pregnancy and lambing on mature liveweight of the progeny were additive, and the effects of poor nutrition in early to mid pregnancy could be overcome by improving nutrition during late pregnancy. The liveweight of individual progeny during adulthood were not consistently related to changes in ewe liveweight or average feed on offer during lactation when these effects were added to the model that included ewe liveweight and liveweight change during pregnancy. These responses were consistent across sites and experiments within site, and at the Vic. site the effects of rearing type on progeny liveweight also disappeared at older ages.

|
|
Progeny survival to 12 months after weaning
Average survival of lambs weaned was ~87% in both years at the Vic. site and 77 and 98% in 2001 and 2002 at the WA site. In all cases, more than 80% of total deaths occurred in the first 5 months after weaning. There was no significant effect of target ewe condition score at Day 100 of pregnancy on survival of progeny after weaning. At the Vic. site survival was reduced for progeny from ewes that grazed lower feed on offer levels from Day 100 of pregnancy until weaning in both years (Table 1). This treatment effect on survival of progeny after weaning was also evident at the WA site in 2001 even though not significant, and there was no effect in 2002 when survival rates were all very high irrespective of treatment. At the Vic. site survival after weaning was significantly lower for progeny born and reared to weaning as twins compared with those reared as singles regardless of their birth type, and across all four cohorts there was a tendency for higher post-weaning survival in ewe compared with wether progeny.
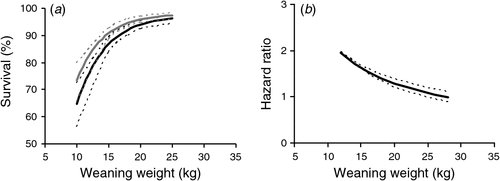
These significant effects of nutritional treatments on post-weaning survival at the Vic. site could largely be explained via their influence on weaning weight. Weaners that died were on average significantly lighter at weaning than those that survived (15.2 versus 17.8 kg; P < 0.001), and the lightest 20% of weaners were 4.6 times more likely to die than weaners from the middle quintile (P < 0.001). There was no significant difference in mortality between the other quintiles. Overall, there was a strong curvilinear relationship between weaning weight and post-weaning survival and the relationship was not significantly different between years. The survival of ewe progeny was greater than the survival of wether progeny even after adjusting for differences in weaning weight (Fig. 4a).
|
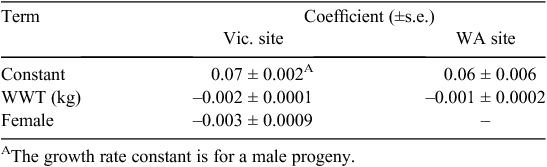
In the multivariate Cox survival analysis, a decrease in weaning weight was associated with a hazard ratio significantly greater than 1 for weaning weights less than 25 kg (P < 0.001). The hazard ratio was progressively greater as weaning weight decreased (Fig. 4b), especially below ~20 kg. Ewe progeny had a significantly lower mortality risk than wether progeny (hazard ratio = 0.7; P = 0.05) after accounting for differences in weaning weight, and twin-born progeny reared as twins had a lower mortality risk than single-born progeny reared as singles (hazard ratio = 0.7; P < 0.01). Average growth rates for different treatments during the 5 months after weaning, when most death occurred, were not associated with mortality risk.
The relative mortality risk for the lightest 20% of weaners was not statistically significantly different from the risk among other liveweight quintiles in either year at the WA site, and the relationship between weaning weight and post-weaning mortality was not evident. This result is surprising as the trends at the WA site in 2001 shown in Table 1 were consistent with the results from the Vic. site. Similar to the Vic. site, ewe progeny had lower mortality risk than wethers (hazard ratio = 0.5, P < 0.01) and this was not associated with differences in weaning weights. Average growth rates during the 5 months after weaning were also not associated with mortality risk.
Discussion
The amount of feed on offer during lactation had the largest impact on lamb growth to weaning and weaning weight. This is consistent with the findings of Coop et al. (1972) and Gibb and Treacher (1982). Nonetheless the liveweight change of the ewe during pregnancy was the next most important influence on weaning weight and more important than changes in ewe liveweight during lactation. This lesser impact of ewe liveweight change during lactation on weaning weight was expected as ewes preferentially partition nutrients to milk production rather than body reserves during lactation (Morgan et al. 2006). The prediction of growth rate and weaning weight of progeny from feed on offer during lactation and ewe liveweight profile to lambing were consistent across two seasons at each of two sites. The relative importance of nutrition during lactation versus pregnancy is reinforced by comparing the growth rates of progeny with different rearing rank. Lambs born and raised as twins grew ~50 g/day slower to weaning than those born as twins and reared as a single. By contrast, there was less than 10 g/day difference in growth rates between single-born and reared lambs and those born as twins and reared as a single, indicating that growth potential was not severely compromised by restricted fetal growth per se. We therefore conclude that lamb weaning weight can be reliably predicted from the ewe liveweight profile during pregnancy, and we accept this component of our hypothesis, but feed on offer during lactation must also be considered within this prediction.
Weaning weight was most strongly associated with post-weaning survival at the Vic. site. Progeny that were heavier at weaning remained heavier during the first summer and autumn when most deaths occurred and had higher survival rates to 12 months of age than those that were lighter at weaning. This is consistent with the findings of Denney (1990), Hatcher et al. (2008) and Campbell et al. (2009) and occurred despite evidence of compensatory growth by the lighter weaners. Survival rates were very sensitive to liveweight when weaning weight was below 20 kg, whereas the changes in weaner survival from increasing weaning weights above 20 kg were much smaller. The lightest 20% of weaners at the Vic. site were 4.6 times more likely to die than weaners from the middle quintile, which fits well with results reported by Campbell et al. (2009). It is well recognised that lighter weaners are less able to cope with nutritional or other stresses due to smaller energy stores than heavier weaners (Allden 1970; Doyle and Egan 1983). Our results support industry recommendations for southern Australia that Merino weaners should be managed to achieve ~45% of mature liveweight by pasture senescence and the lower weaning weight ‘tail’ should be drafted off and provided with extra nutrients to improve overall post-weaning survival.
Maximising growth to weaning was the most important factor influencing weaner survival at the Vic. site, and these results support the hypothesis that improved nutrition of Merino ewes during pregnancy and lactation increases weaning weights and therefore post-weaning survival. By contrast, at the WA site the relationship between weaning weight and post-weaning survival was not evident. At least 90% of the progeny at this site were more than 20 kg or 45% of mature liveweight at weaning in 2002 and subsequently rates of survival were very high irrespective of pre-weaning nutritional treatment. In 2001, weaning coincided with a significant weather event (130 mm of rainfall in the first week of December), which resulted in significant weaner mortality that was unrelated to liveweight. Hocking-Edwards et al. (2008) also found that absolute liveweight at weaning is not always a good predictor of survival, even though this conclusion was made from comparisons of different flocks rather than between individuals within a flock. Taken together, these results suggest that factors other than absolute liveweight at weaning influenced within-flock weaner survival at the WA site.
Most weaner mortalities occurred during the 5 months after weaning, which is consistent with the findings of Hatcher et al. (2008) and Campbell et al. (2009). The average growth rate during this period for weaners from different pre-weaning nutritional treatments was not significantly associated with mortality risk of individual progeny at either site. The reason for this could be that the average growth rates of progeny during the period were generally greater than the 25 g/day that Campbell et al. (2009) identified as a critical threshold. These authors found that a decrease in growth rate during this period was associated with substantially greater mortality risk if mean growth rate of the flock was less than ~25 g/day, but there was no further benefit in survival if weaner growth rates were higher than 25 g/day. Similarly, Hocking-Edwards et al. (2008) reported that growth rates were not useful indicators of weaner survival when they were above 30 g/day, and Hatcher et al. (2008) found that the average mortality of flocks was only 6% when weaners were supplemented to grow at 70 g/day during their first summer/autumn despite being weaned at light weights (15.3 kg on average). It is clear from the present study that weaner survival was less related to post-weaning growth rates than to liveweight at weaning when post-weaning growth rates exceeded 30 g/day. Managing weaners to grow at 30 g/day or more during the 3–5 months after weaning, especially when weaning occurs at or just before pasture senescence, is best achieved by weighing a subsample of 50–80 animals from each flock every 4–6 weeks and adjusting supplementary feeding rates based on their average liveweight and the quantity and quality of paddock feed.
Liveweight of progeny to at least 33 months of age at the WA site and 39 months of age at the Vic. site was related to changes in ewe liveweight between joining and Day 100 of pregnancy and between Day 100 of pregnancy and lambing. When present, the effects of ewe liveweight change during the different periods of pregnancy on progeny liveweight were additive, and the effects of poor nutrition in early and mid pregnancy could be overcome by improving nutrition during late pregnancy. In addition to ewe liveweight change during pregnancy, ewe liveweight at joining was also correlated with liveweight of progeny at different ages. These impacts of ewe liveweight were consistent with known genetic correlations between liveweight of the dam and her progeny (Huisman and Brown 2008). These responses to ewe liveweight were consistent across experimental sites and years. In contrast to the effects of ewe liveweight at joining and changes in ewe liveweight during pregnancy on progeny liveweights, progeny liveweights at the hogget shearing at 15 and 21 months of age at the Vic. and WA sites and beyond were not influenced by changes in ewe liveweight or average feed on offer during lactation at either site. This result is perhaps surprising given that feed on offer during lactation was the major factor influencing weaning weight. While the precise reasons for this are unknown, it is likely that developmental processes that impact on mature size are more sensitive to nutritional insult during fetal rather than postnatal life (Greenwood et al. 2010), even when early postnatal nutritional restriction of sheep is severe (Krausgrill et al. 1997).
The findings of the present study suggest that within the range of nutritional scenarios during pregnancy and lactation likely to be experienced within the Australian sheep industry, that the liveweight of progeny at maturity is unlikely to be affected adversely. In this regard, the adverse effects of poor nutrition of the ewe during lactation and pregnancy on the liveweight of the progeny at the Vic. site were no longer evident when they reached ~51 months of age. The effects of rearing type on progeny liveweight also disappeared at older ages. These effects of nutritional treatments on progeny liveweights are consistent with Allden (1968) who reported that lambs poorly grown in the first 3 months of life took several years to overcome their growth handicap but were not permanently stunted. The differences in weaning weight between treatments at the Vic. site were similar to those reported by Denney (1990) who showed that differences in weaning weight had disappeared by 2 years of age. By contrast, Kelly et al. (2006) found that progeny from ewes fed at submaintenance levels during pregnancy and lactation remained lighter at 4 years of age compared with progeny from ewes fed at maintenance levels (70.2 versus 72.6 kg). The range in weaning weights at the WA site more closely reflected those reported by Kelly et al. (2006), and the differences between extreme treatments in progeny liveweight at the final measurement at the WA site at 33 months of age were of similar magnitude to those reported by Kelly et al. (2006) at a comparable age. However, the nutritional treatments imposed by Kelly et al. (2006) and at the WA site were more extreme, especially during lactation, such that the differences in progeny weaning weight were ~10 kg compared with 5 kg at the Vic. site in the present work. At the Vic. site, where the progeny were retained to more than 5 years of age, poor nutrition during pregnancy and lactation did not permanently compromise progeny liveweight.
Ewe progeny had a lower mortality risk than wether progeny, which has been reported previously (Hocking-Edwards et al. 2008; Campbell et al. 2009), and we established that this effect was not due to differences in weaning weight or post-weaning growth. The precise reasons for differences in survival between sexes is not known, but it could be due to differences in body composition as the wether progeny were leaner than the ewe progeny up to 12 months of age (Paganoni 2005). Male lambs are also more susceptible to internal parasites than females (Nguti et al. 2003). We measured worm egg counts in faeces from all progeny between 1 and 4 times between weaning and 12 months of age, and on average wethers had a significantly higher worm egg count than ewes when grazed together (B. Paganoni, unpubl. data). Differences in survival rates after weaning between wethers and ewes may be associated with differences in body composition and parasite burdens, but they are not due to differences in weaning weight or post-weaning growth.
In a practical sense, it is impossible to uncouple influences of fetal life from those during early postnatal life when offspring remain on their dam and are subject to maternal influences that may also be altered by the environment during pregnancy (Greenwood et al. 2010). Nevertheless, we have shown that weaning weight can be reliably predicted from ewe liveweight profile to lambing and feed on offer during lactation. The feed on offer needed to achieve near-maximum progeny growth rates was ~1600 kg DM/ha at the Vic. site and 2000 kg DM/ha at the WA site, which is in reasonable agreement with values reported by Willoughby (1959) and Langlands (1977). The average weaning weight of single-born lambs grazing these pastures would be greater than 21 and 24 kg at the Vic. and WA sites, respectively, if weaning occurred 14 weeks from the start of lambing. By contrast, twin-born and reared lambs would still weigh less than 18 kg at the Vic. site. Therefore, to improve post-weaning survival of twin-reared lambs they should graze more clover-dominant pastures to improve growth rates (Chapman et al. 2003). In this regard, the importance of adequate protein intake during the pre- and post-weaning periods has been previously demonstrated for successful weaning of small ruminants at light weights (Greenwood 1993).
The control of ewe nutrition during pregnancy and especially lamb nutrition before and after weaning are clearly important for optimal post-weaning survival. Increasing weaning weight to improve weaner survival can also increase the profitability of farms in south-west Vic. and the Great Southern region of Western Australia. The whole-farm bioeconomic model used to develop ewe management guidelines reported by Young et al. (2011) was modified to include the weaner weight and survival responses from this study and those reported by Campbell et al. (2009). The analysis established that including these responses did not alter the optimum ewe management guidelines reported by Young et al. (2011). In other words, the ewe liveweight profile that generated greatest profits applied regardless of whether the effects in weaning weight and survival were included. Farm profit was maximised when progeny were weaned at around 20 kg (J.C. Young, www.sheepcrc.org.au, verified 30 June 2011) and at the Vic. site this weaning weight corresponded with the target to achieve more than 95% survival of Merino weaners.
Acknowledgements
This work was funded by Australian Wool Innovation Limited, Department of Primary Industries, Victoria and Department of Agriculture and Food, Western Australia. The authors thank David and Fiona Robertson and Bill, Kay and Geoff Sandilands for providing the research sites, experimental sheep and ongoing support for the ‘Lifetimewool’ project. Mr Brian Hurley, Mr Tom Plaisted, Ms Kazue Tanaka and Ms Amber Walker are thanked for their invaluable technical assistance.
References
Allden WG (1968) Undernutrition of the Merino sheep and its sequelae. III. Effect on lifetime productivity of growth restrictions imposed at two stages of early post-natal life in a Mediterranean environment. Australian Journal of Agricultural Research 19, 981–996.| Undernutrition of the Merino sheep and its sequelae. III. Effect on lifetime productivity of growth restrictions imposed at two stages of early post-natal life in a Mediterranean environment.Crossref | GoogleScholarGoogle Scholar |
Allden WG (1970) The effects of nutritional deprivation on the subsequent productivity of sheep and cattle. Nutrition Abstracts and Reviews 40, 1167–1184.
Brand TS, Franck F (2000) Production responses of two genetic different types of Merino sheep subjected to different nutritional levels. Small Ruminant Research 37, 85–91.
| Production responses of two genetic different types of Merino sheep subjected to different nutritional levels.Crossref | GoogleScholarGoogle Scholar |
Campbell AJD, Vizard AL, Larsen JWA (2009) Risk factors for post-weaning mortality of Merino sheep in south-eastern Australia. Australian Veterinary Journal 87, 305–312.
| Risk factors for post-weaning mortality of Merino sheep in south-eastern Australia.Crossref | GoogleScholarGoogle Scholar | 1:STN:280:DC%2BD1MrltFCjug%3D%3D&md5=6ce86042742bfc742b450578ea3e6ae8CAS |
Cayley JWD, Bird PR (1996) ‘Techniques for measuring pastures.’ Technical Report Series No. 191. (Victorian Department of Agriculture: Melbourne)
Chapman DF, McCaskill MR, Quigley PE, Thompson AN, Graham JB, Borg D, Lamb J, Kearney G, Saul GR, Clark SC (2003) Effects of grazing method and fertilizer inputs on the productivity and sustainability of phalaris-based pastures in western Victoria. Australian Journal of Experimental Agriculture 43, 785–798.
| Effects of grazing method and fertilizer inputs on the productivity and sustainability of phalaris-based pastures in western Victoria.Crossref | GoogleScholarGoogle Scholar |
Coop IE, Clark VR, Claro D (1972) Nutrition of the ewe in early lactation. 1. Lamb growth rate. New Zealand Journal of Agricultural Research 15, 203–208.
Cox DR (1972) Regression models and life-tables. Journal of the Royal Statistical Society. Series B. Methodological 34, 187–220.
Denney GD (1990) Effect of pre-weaning farm environment on adult wool production of Merino sheep. Australian Journal of Experimental Agriculture 30, 17–25.
| Effect of pre-weaning farm environment on adult wool production of Merino sheep.Crossref | GoogleScholarGoogle Scholar |
Doney JM, Peart JN (1976) The effect of sustained lactation on intake of solid food and growth rate of lambs. The Journal of Agricultural Science 87, 511–518.
| The effect of sustained lactation on intake of solid food and growth rate of lambs.Crossref | GoogleScholarGoogle Scholar |
Doyle PT, Egan JK (1983) The utilization of nitrogen and sulfur by weaner and mature merino sheep. Australian Journal of Agricultural Research 34, 433–439.
| The utilization of nitrogen and sulfur by weaner and mature merino sheep.Crossref | GoogleScholarGoogle Scholar | 1:CAS:528:DyaL3sXlt1Wis7k%3D&md5=f00c469090a93c6e3104be572c07aa1bCAS |
Everitt GC (1967) Residual effects of prenatal nutrition on the postnatal performance of Merino sheep. Proceedings of the New Zealand Society of Animal Production 27, 52–68.
Ferguson MB, Thompson AN, Gordon DJ, Hyder MW, Kearney GA, Oldham CM, Paganoni BL (2011) The wool production and reproduction of Merino ewes can be predicted from changes in liveweight during pregnancy and lactation. Animal Production Science 51, 763–775.
| The wool production and reproduction of Merino ewes can be predicted from changes in liveweight during pregnancy and lactation.Crossref | GoogleScholarGoogle Scholar |
Genstat Committee (2008) ‘Genstat for Windows.’ 11th edn. (VSN International: Hertfordshire, UK)
Gibb MJ, Treacher TT (1980) The effect of ewe body condition at lambing on the performance of ewes and their lambs at pasture. The Journal of Agricultural Science 95, 631–640.
| The effect of ewe body condition at lambing on the performance of ewes and their lambs at pasture.Crossref | GoogleScholarGoogle Scholar |
Gibb MJ, Treacher TT (1982) The effect of body condition and nutrition during late pregnancy on the performance of grazing ewes during lactation. Animal Production 34, 123–129.
| The effect of body condition and nutrition during late pregnancy on the performance of grazing ewes during lactation.Crossref | GoogleScholarGoogle Scholar |
Greenwood PL (1993) Rearing systems for dairy goats. Small Ruminant Research 10, 189–199.
| Rearing systems for dairy goats.Crossref | GoogleScholarGoogle Scholar |
Greenwood PL, Hunt AS, Hermanson JW, Bell AW (1998) Effects of birth weight and postnatal nutrition on neonatal sheep: I. Body growth and composition, and some aspects of energetic efficiency. Journal of Animal Science 76, 2354–2367.
Greenwood PL, Hunt AS, Hermanson JW, Bell AW (2000) Effects of birth weight and postnatal nutrition on neonatal sheep: II. Skeletal muscle growth and development. Journal of Animal Science 78, 50–61.
Greenwood PL, Thompson AN, Ford SP (2010) Postnatal consequences of the maternal environment and of growth during prenatal life for productivity of ruminants. In ‘Managing the prenatal environment to enhance livestock productivity’. (Eds PL Greenwood, AW Bell, PE Vercoe, GJ Viljoen) pp. 3–36. (Springer: Dordrecht, The Netherlands)
Hatcher S, Eppleston J, Graham RP, McDonald J, Schlunke S, Watt B, Thornberry KJ (2008) Higher weaning weight improves postweaning growth and survival in young Merino sheep. Australian Journal of Experimental Agriculture 48, 966–973.
| Higher weaning weight improves postweaning growth and survival in young Merino sheep.Crossref | GoogleScholarGoogle Scholar |
Hocking-Edwards JE, Gould RM, Copping KJ (2008) Putting Merino weaner management recommendations to the test. Australian Journal of Experimental Agriculture 48, 974–978.
| Putting Merino weaner management recommendations to the test.Crossref | GoogleScholarGoogle Scholar |
Hosmer DW, Lemeshow L (1999) ‘Applied survival analysis. Regression modelling of time to event data.’ (John Wiley & Sons: New York)
Huisman AE, Brown DJ (2008) Genetic parameters for bodyweight, wool, and disease resistance and reproduction traits in Merino sheep. 2. Genetic relationships between bodyweight traits and other traits. Australian Journal of Experimental Agriculture 48, 1186–1193.
| Genetic parameters for bodyweight, wool, and disease resistance and reproduction traits in Merino sheep. 2. Genetic relationships between bodyweight traits and other traits.Crossref | GoogleScholarGoogle Scholar |
Jefferies BC (1961) Body condition scoring and its use in management. Tasmanian Journal of Agriculture 32, 19–21.
Jordan DJ, Mayer DG (1989) Effects of udder damage and nutritional plane on milk yield, lamb survival and lamb growth of Merinos. Australian Journal of Experimental Agriculture 29, 315–320.
| Effects of udder damage and nutritional plane on milk yield, lamb survival and lamb growth of Merinos.Crossref | GoogleScholarGoogle Scholar |
Kelly RW, Greeff JC, Macleod I (2006) Lifetime changes in wool production of Merino sheep following differential feeding in fetal and early life. Australian Journal of Agricultural Research 57, 867–876.
| Lifetime changes in wool production of Merino sheep following differential feeding in fetal and early life.Crossref | GoogleScholarGoogle Scholar |
Krausgrill DI, Tulloh NM, Hopkins DL (1997) Growth of sheep to the age of three years after a severe nutritional check in early post-natal life. The Journal of Agricultural Science 128, 479–494.
| Growth of sheep to the age of three years after a severe nutritional check in early post-natal life.Crossref | GoogleScholarGoogle Scholar |
Lambe NR, Brotherstone S, Young MJ, Conington JE, Simm G (2005) Genetic relationships between seasonal tissue levels in Scottish Blackface ewes and lamb growth traits. Animal Science (Penicuik, Scotland) 81, 11–21.
| Genetic relationships between seasonal tissue levels in Scottish Blackface ewes and lamb growth traits.Crossref | GoogleScholarGoogle Scholar |
Langlands JP (1977) The intake and production of lactating merino ewes and their lambs grazed at different stocking rates. Australian Journal of Agricultural Research 28, 133–142.
| The intake and production of lactating merino ewes and their lambs grazed at different stocking rates.Crossref | GoogleScholarGoogle Scholar |
McNeill DM, Kelly RW, Williams IH (1997) The partition of nutrients in ewes maintained in a moderate compared with a lean body condition in late pregnancy. Australian Journal of Agricultural Research 48, 743–752.
| The partition of nutrients in ewes maintained in a moderate compared with a lean body condition in late pregnancy.Crossref | GoogleScholarGoogle Scholar |
Morgan JE, Fogarty NM, Nielsen S, Gilmour AR (2006) Milk yield and milk composition from grazing primiparous non-dairy crossbred ewes. Australian Journal of Agricultural Research 57, 377–387.
| Milk yield and milk composition from grazing primiparous non-dairy crossbred ewes.Crossref | GoogleScholarGoogle Scholar |
Nguti R, Janssen P, Rowlands GJ (2003) Survival of Red Maasai, Dorper and crossbred lambs in the sub-humid tropics. Animal Science (Penicuik, Scotland) 76, 3–17.
Oldham CM, Thompson AN, Ferguson MB, Gordon DJ, Kearney GA, Paganoni BL (2011) The birthweight and survival of Merino lambs can be predicted from the profile liveweight change of their mothers during pregnancy. Animal Production Science 51, 776–783.
| The birthweight and survival of Merino lambs can be predicted from the profile liveweight change of their mothers during pregnancy.Crossref | GoogleScholarGoogle Scholar |
Paganoni B (2005) Increasing feed on offer to Merino ewes during pregnancy and lactation can increase muscle and decrease fat, but does not affect faecal worm egg count of their progeny. MA thesis, University of Western Australia, Perth.
Schinckel PG, Short BF (1961) The influence of nutritional level during prenatal and early postnatal life on adult fleece and body characteristics. Australian Journal of Agricultural Research 12, 176–202.
| The influence of nutritional level during prenatal and early postnatal life on adult fleece and body characteristics.Crossref | GoogleScholarGoogle Scholar |
Snowder GD, Glimp HA (1991) Influence of breed, number of suckling lambs, and stage of lactation on ewe milk production and lamb growth under range conditions. Journal of Animal Science 69, 923–930.
StataCorp LP (2005) ‘Stata longitudinal/panel data: reference manual.’ 9th release. (Stata Press: College Station, TX).
Thompson AN, Doyle PT, Grimm M (1994) Effects of differential grazing of annual pastures in spring on sheep and wool production. Australian Journal of Agricultural Research 45, 367–389.
| Effects of differential grazing of annual pastures in spring on sheep and wool production.Crossref | GoogleScholarGoogle Scholar |
Thompson AN, Ferguson MB, Gordon DJ, Kearney GA, Oldham CM, Paganoni BL (2011) Improving the nutrition of Merino ewes during pregnancy increases the fleece weight and reduces the fibre diameter of their progeny’s wool during their lifetime and these effects can be predicted from the ewe’s liveweight profile. Animal Production Science 51, 794–804.
| Improving the nutrition of Merino ewes during pregnancy increases the fleece weight and reduces the fibre diameter of their progeny’s wool during their lifetime and these effects can be predicted from the ewe’s liveweight profile.Crossref | GoogleScholarGoogle Scholar |
Tygesen MP, Harrison AP, Therkildsen M (2007) The effect of maternal nutrient restriction during late gestation on muscle, bone and meat parameters in five month old lambs. Livestock Science 110, 230–241.
| The effect of maternal nutrient restriction during late gestation on muscle, bone and meat parameters in five month old lambs.Crossref | GoogleScholarGoogle Scholar |
Vernon RG, Finley E (1985) Regulation of lipolysis during pregnancy and lactation in sheep: response to noradrenaline and adenosine. The Biochemical Journal 230, 651–656.
Willoughby WM (1959) Limitations to pasture production imposed by seasonal fluctuations in pasture and by management procedures. Australian Journal of Agricultural Research 10, 248–268.
| Limitations to pasture production imposed by seasonal fluctuations in pasture and by management procedures.Crossref | GoogleScholarGoogle Scholar |
Young JM, Thompson AN, Curnow M, Oldham CM (2011) Whole-farm profit and the optimum maternal liveweight profile of Merino ewe flocks lambing in winter and spring are influenced by the effects of ewe nutrition on the progeny’s survival and lifetime wool production. Animal Production Science 51, 821–833.
| Whole-farm profit and the optimum maternal liveweight profile of Merino ewe flocks lambing in winter and spring are influenced by the effects of ewe nutrition on the progeny’s survival and lifetime wool production.Crossref | GoogleScholarGoogle Scholar |