

Genomics and the global beef cattle industry1
E. J. Pollak A B , G. L. Bennett A , W. M. Snelling A , R. M. Thallman A and L. A. Kuehn AA USDA/ARS2-US Meat Animal Research Center, PO Box 166, Clay Center, NE 68933, USA.
B Corresponding author. Email: e.john.pollak@ars.usda.gov
Animal Production Science 52(3) 92-99 https://doi.org/10.1071/AN11120
Submitted: 21 June 2011 Accepted: 12 January 2012 Published: 20 February 2012
Journal Compilation © CSIRO Publishing 2012 Open Access CC BY-NC-ND
Abstract
After two decades of developing DNA-based tools for selection, we are at an interesting juncture. Genomic technology has essentially eliminated the potentially large negative impact of spontaneous single-mutation genetic defects as the management of recent examples in beef cattle have demonstrated. We have the ability to perform more accurate selection based on molecular breeding values (MBVs) for animals closely related to the discovery population. Yet the amount of genetic variation explained falls short of expectations held for the technology. Tests are less effective in distant relatives within a breed and are not robust enough for across-breed use. It is hypothesised that ‘larger single-nucleotide polymorphism (SNP) panels’ will help extend the effective use of tests to more distantly related animals and across breeds. Sequencing and imputing sequences across individuals will enable us to discover causative mutations or SNPs in perfect harmony with the mutation. However, the investment to revisit discovery populations will be large. We can ill afford to duplicate genotyping or sequencing activities for prominent individuals. Hence, a global strategy for genotyping and sequencing becomes an attractive proposition as many of our livestock populations are related. As we learned more of the complexities of the genome, the number of animals in discovery populations necessary to achieve high levels of predictability has grown dramatically. No one organisation has the resources to assemble the animals needed, especially for novel, expensive or hard to measure phenotypes. This scenario is fertile ground for increased international collaboration in all livestock species.
Introduction
Global communities are becoming increasingly interdependent. Current events are shared in real time, economies are global and communications are instant. Scientific endeavour has long enjoyed global exchange of information through literature, scientific colloquia and exchange programs. In agriculture, many of our animal populations are now related to some degree. It is intuitively appealing to consider greater collaborations especially with increasing complexity of problems and pressures on agricultural sciences to deliver technologies to address the impending food crisis projected as a result of human population growth.
Background
The applications of DNA tools for selection and management hold great promise to enhance the response to selection and to improve efficiencies of management. The former can be viewed as an opportunity to increase the accuracy of genetic assessment of replacement candidates at critical selection points and the latter as optimally categorising individuals for targeted management strategies.
Selection
For marker-assisted selection (MAS), two categories of traits are considered. The first includes traits for which routine genetic evaluations are obtained from phenotypic and pedigree information and the second comprises traits without routine evaluations. The development of DNA tests for traits with information already available can enhance the accuracy of those genetic evaluations if the DNA information is seamlessly integrated into existing genetic prediction infrastructures and used to augment other sources of information. The increase in accuracy will be most pronounced in young animals with no recorded progeny, and, hence, has high value for selection of replacement animals. The magnitude of the increase in accuracy depends on available records on relatives, heritability and portion of heritable variation accounted for by the tests, (Lande and Thompson 1990; Thallman et al. 2009). For traits not routinely recorded or evaluated, the benefits are obvious and potentially allow for selection pressure to be applied to novel, yet economically relevant traits such as feed efficiency or susceptibility to certain complex diseases. Unfortunately, for predictive tests to be developed that achieve sufficient reliability, large discovery populations need to be constructed that measure these novel phenotypes. Consequently, we have witnessed tests being deployed that are based on limited information and that describe little phenotypic variation (Van Eenennaam et al. 2009).
Management
Marker-assisted management (MAM) is the process of making management decisions on the basis of the prediction of an animal’s performance from marker panels. Examples include developing individualised implanting strategies to complement genetic potential, placing feeder cattle into pens on the basis of the risk of disease to provide preventative treatment, or on the basis of predictions of time to finish with the goal of optimising feeding programs. The DNA prediction equations for MAM would ideally account for both additive and non-additive genetic effects. Steps to developing DNA tools to support MAS and MAM include discovery of associations of markers with quantitative trait loci (QTL) explaining variation in the trait of interest and then, ideally, replicating discovery results in independent populations.
Discovery
The strategy of discovery in beef cattle has evolved from experiments using ‘informative families’ created from divergent parent lines (Casas et al. 2003; Kim et al. 2003) or large half-sib groups (Casas et al. 2000, 2001) to the current process of using large populations phenotyped for multiple traits of interest and genotyped with high-density panels (Miller et al. 2010; Snelling et al. 2010, 2011; Bolormaa et al. 2011a, 2011b). Allelic effects are estimated and combined in prediction equations for molecular breeding values (MBVs). Statistical approaches for simultaneous estimation of multiple marker effects are evolving (Meuwissen et al. 2001; Cleveland et al. 2010; Habier et al. 2011) and bioinformatics tools for routine analysis are being developed (e.g. GenSel software at http://bigs.ansci.iastate.edu, verified 17 January 2012). With these methods, the focus has shifted from a single polymorphism as the cause of genetic variation to multiple markers covering several genomic regions.
Fine mapping follows broader searches to further study interesting regions in hope of identifying markers in greater linkage disequilibrium with causative variation than those on the discovery panel and candidate genes within those regions that then can be sequenced to identify polymorphisms in the hope of determining the causative mutations. The efficacy of this approach has been demonstrated several times with simply inherited traits such as recent genetic defects in beef cattle (Charlier et al. 2008; Meyers et al. 2010). The complexity is obviously increased for polygenic quantitative traits; therefore, the probability of success is lower.
Replication
The process of replicating scientific findings has always been important. Early application of this process for commercially available DNA tests initiated by the National Beef Cattle Evaluation Consortium (NBCEC) for the US beef industry was referred to as ‘validation.’ Results are available on the NBCEC website (www.NBCEC.org, verified 17 January 2012) and in Van Eenennaam et al. (2007, 2009). It is interesting to note that international collaborations on validation were carried out for several of the commercial panels going through the process, capitalising on the existence of international discovery populations for the purpose of validation. In Australia, the Beef CRC and the Animal Breeding and Genetics Unit (AGBU), a joint unit of the University of New England (UNE) and New South Wales Department of Primary Industries, have conducted genomic calibrations in coordination with the NBCEC (see http://agbu.une.edu.au/genomic_calibrations.php, verified 17 January 2012). Early DNA tests consisted of relatively few markers and the process of validation determined significance of the marker effects in populations independent of the discovery population. As more markers were added to the commercial panels, this became increasingly difficult to do because the populations needed to be large enough to ensure adequate representation of all genotypes. As such, the process evolved to assessing the significance of the regression of phenotypic performance of animals on the MBVs obtained for those animals in the independent population. This approach in turn evolved to the current strategy of estimating the proportion of genetic variation the MBVs account for in the independent population (Thallman et al. 2009). Application of the later approach can be found at http://www.beefcrc.com.au/Aus-Beef-DNA-results (verified 17 January 2012) for commercially available DNA tests and in MacNeil et al. (2010) using methods proposed by Kachman (2008).
Application
DNA tests have been mostly used as an independent source of information for selection, even for traits for which routine genetic evaluations are available. Some applications of augmenting genetic evaluations and molecular information have been implemented. Aguilar et al. (2010) proposed the inclusion of the genomic relationship matrix for animals with marker information, along with the additive relationship matrix for those that do not have genotypes, as a one step process. This assumes the availability of marker genotypes to providers of genetic evaluations. For cases where marker genotypes are not available due to intellectual property issues, Kachman (2008) proposed treating the MBV as a correlated trait in the genetic evaluation system. Recently, the American Angus Association adopted the latter strategy by incorporating MBVs into their genetic evaluations of carcass traits (MacNeil et al. 2010) and has since adopted this strategy for numerous other traits (http://www.angus.org/AGI/GenomicChoice070811.pdf, verified 17 January 2012). A blending approach is being used by BREEDPLAN to incorporate MBVs into the genetic evaluation for Angus Australia and Angus New Zealand (http://www.angusaustralia.com.au/Breedplan/BP_SS_Intro.pdf, verified 17 January 2012). BREEDPLAN has incorporated information from several SNPs into Australian Brahman estimated breeding values for shear force since 2008 (http://agbu.une.edu.au/brahman%20tenderness%20EBVs.pdf).
Need for international collaboration
There has been substantial progress in the evolution of DNA technology and, to a lesser extent, transfer of tools from that technology to the industry for use in MAS. However, furthering the effort will require circumventing several challenges which include:
-
continuing development of discovery populations (and populations for replication) for novel traits,
-
the need for replication of results in other populations to establish the consistency of marker associations,
-
understanding the interactions between genotypes and environments,
-
assessing the relationship of novel traits with routinely recorded traits to position them correctly in multiple-trait selection to improve economically relevant traits, and
-
developing decision support tools to aid in making selection and or management decisions from all sources of information.
Underlying many of the challenges is the need to increase the number of phenotyped (genotyped) animals available for study.
Animal populations
Discovery in livestock has been disappointing if judged by the amount of genetic variation accounted for by the DNA predictors (Van Eenennaam et al. 2009). This is especially true for novel traits where discovery populations consist of individual animals phenotyped for those traits, as opposed to traits where genetic predictions are available on highly proven animals to use as the ‘phenotypic’ data, Garrick et al. (2009). Goddard (2009) derived the number of phenotyped animals needed to achieve an accuracy of prediction of either 0.5 or 0.7 given the assumptions of an effective population size equal to 100 and every QTL in perfect linkage disequilibrium with a SNP. For a trait with an h2 of 0.3, 4000 animals are needed to achieve an accuracy of 0.5. The equivalent animal numbers for a trait with h2 of 0.1 or 0.4 are approximately 12 and 3000 animals, respectively. If the goal is to achieve a higher accuracy of 0.7, the comparable numbers for h2 of 0.1, 0.3 and 0.4 are ~38 000, 12 500 and 9000, respectively. These are staggering numbers when one considers the costs of data collection and of genotyping the animals.
Table 1 shows the number of beef animals reported to be represented in the discovery populations of organisations in three countries when an international collaboration was proposed between these countries in 2008. The countries and organisations represented are as follows: Australia, Beef Cooperative Research Center (CRC); Canada, Universities of Alberta and Guelph; the United States, USA Meat Animal Research Center (MARC).

|
From Table 1, several things are immediately apparent. First, these are large resource populations that on the surface appear to meet requirements of animal number needs. But further inspection shows that these datasets represent a plethora of breeds (and composites) and are a mixture of heifer, steer, bull and cow data (the latter being quite limited at the time of compiling the table). Not apparent from the table is the fact that not all animals are measured for all traits, for example, feed intake was measured on only ~7800 animals. Still, the numbers are formidable. However, given the cost of genotyping animals with the high-density panels with >750 000 SNPs, only a fraction of these animals have been genotyped. A concerted effort is underway in all the organisations to increase genotype information. This will be carried out by using the new high-density panels (and targeted sequencing), in conjunction with lower-density panels to allow for imputation. This will be an expensive venture and yet, in the end, individual organisations are still likely to be short of the numbers of phenotyped animals to account for large proportions of genetic variation. Collectively, however, the number of animals that will be represented across organisations will be quite substantial. The problem is compounded by the current assumption that genomic predictions must be breed-specific and estimated from single-breed populations. There is hope that the requirement for predictions to be breed-specific may be relaxed with increasing marker density and/or individual animal sequence and that improved statistical models may provide for sharing of information among populations, but this hope is yet to be realised.
Each organisation has reported research results on association studies from their respective populations. The next logical step was to compare findings from the independent populations. We did this for the Australian results reported by Bolormaa et al. (2011a) for feedlot growth and efficiency traits using results reported by Snelling et al. (2011). The traits included were residual feed intake, average daily gain and mid-test bodyweight. Bolormaa et al. (2011a) reported 25 1-Mbp intervals where significant (P < 0.05) associations were found for all three traits (Table 2). The MARC analysis also identified SNPs significant (P < 0.05) for all three traits in 7 of these 25 intervals. There were four instances where there were no significant results found for any of the three traits in the MARC analysis. In the remaining 15 intervals, one or two traits were found to be associated with SNPs in that region in the MARC dataset.

|
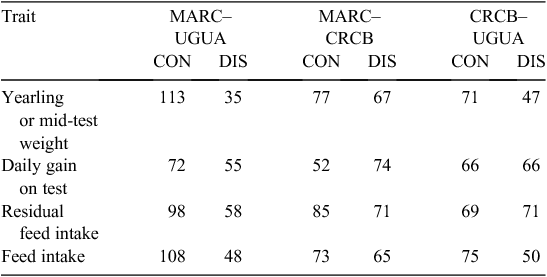
Significance of individual SNP effects is obviously not the final criterion for assessment. Table 3 shows a comparison of preliminary analyses conducted in the three countries (Bos Taurus data only) for growth traits relative to total and discordant matches among the 2500 SNPs, with the greatest significance values for yearling weight or mid-test weight, daily gain on test, feed intake, and residual feed intake from each collaborator. It is interesting that there is a higher degree of concordance between the MARC and Canadian results for these traits than there is concordance of results from either MARC or the Canadian study with those results from the Australian study. This probably reflects the greater degree of relatedness between the USA and Canadian beef populations than of either with the Australian population.
|
The reasons for discordance in particular comparisons need to be understood, especially if datasets were to be combined for joint estimation of allelic effects. On one hand, there will be a fraction of discordant results stemming from spurious associations. On the other hand, the results could be real and the discordance could be due to differences in phase between markers and QTL in the different populations or interactions with the environment or different genetic backgrounds. Although strong evidence of reversals of marker and QTL phase are not common in the literature, there are cases of markers being in phase with QTL in one population and not another. One instance of this is a TG5 marker being in phase with marbling score in Wagyu-derived animals but not in animals derived from other sources (Casas et al. 2007).
To expand the utility of discovery populations, Saatchi et al. (2011) promoted combining the discovery and validation steps in a systematic process called cross-validation. This process involves dividing the discovery population into n subsets, using n–1 subsets in a discovery analysis and assessing the results against the excluded subset. This process is then repeated with all possible combinations of the n subsets used in discovery, such that, in the end, every subset contributes both to discovery and validation. Results are then summarised across ‘experiments.’ How the discovery population is divided can, in some instances, be by categories (e.g. breed, location, or year of birth), while in other cases, it could be based on the degree of relationship from closely to distantly related subsets. This process could be quite useful for combining datasets from collaborating countries.
However, in doing so, the issues of concordance are not addressed. That is, when combining datasets, estimated allelic effects for discordant QTL will be some weighted average of the information. This would not be appropriate if the discordance was reflecting a different phase of marker association with a real QTL across the populations or if there was a genotype by environment (G × E) interaction associated with the QTL being marked. Whereas, if discordance really is due to a different phase of marker association, the combined dataset may allow discovery of markers in higher linkage disequilibrium with the causative variation in the same region, through fine-mapping or higher-density genotyping. Furthermore, the breed-specific nature of current genomic predictions tends to limit international collaboration to those breeds that are present in the respective countries. Regardless, it seems the advantage to combining data relative to the increased power of discovery in an international collaboration would be beneficial, and in doing so, does enhance the opportunity for exploration of multi-breed predictions.
There are obvious challenges to combining datasets from collaborating countries. These include differences in the definitions of traits, differences in breed representation and differences in environments. These challenges do not disappear in the absence of collaboration because the commercialisation of DNA tests is global; DNA tests developed in Australia have been commercialised in the USA and Canada, and vice versa.
Recently, purebred resource populations have gained popularity because it has become clear that current predictions are not portable across breeds, or in some cases, across subpopulations within breeds. However, most commercial cattle are crossbred, and therefore, crossbred resource populations will continue to contribute essential information. Mapping heterosis with respect to the genome will require crossbred resource populations. As more individual animal sequence data becomes available, it seems likely that crossbred resource populations will become increasingly valuable. For example, estimation of the difference in effects of haplotypes that exist only in different breeds will be much more efficient in populations with parents that are crosses of the respective breeds.
Genotypes
Genotyping costs have been dramatically reduced, even for the higher-density panels. Cost of sequencing has decreased even faster. Nevertheless, the cost of genotypes, sequencing and phenotypes required to reach the number of animals needed is exorbitant and difficult to fund individually. In addition to phenotyped animal populations, genotyping of important industry animals has and will continue to occur. For example, MARC researchers have genotyped over 2000 prominent artificial insemination (AI) beef bulls representing multiple breeds in the USA and will be genotyping (770K) and sequencing at low coverage (2X) AI beef bulls that are prominent ancestors of the discovery population pedigree at MARC. Sequence of highly influential animals will be imputed to other animals in the population using lower density (e.g. 50K and/or 3K) marker sets. Sequencing will make available the causative SNPs, many of which are likely to have allele frequencies too low to even be considered for inclusion on general-purpose SNP chips. Having access to the genotypes of causative SNPs does not make it easy to discern them from the rest (as the total number of SNPs to be considered will increase dramatically), but it does make it possible to discern them.
The national herds of beef and dairy across countries are related. Prominent males appear in the pedigree of animals in these national herds (which has enhanced international genetic evaluations). Hence, to avoid the duplication of genotyping, the concept of a global strategy for genotyping and sequencing becomes an attractive proposition and this strategy would be made plausible by developing an international database of the animal identifications for those males that have been genotyped. As an example, the above mentioned organisations (in USA, Australia and Canada) that have ventured into previous collaborations for beef genomics have successfully partnered on a grant to Genome Canada, with Project Leaders Drs Stephen Moore and Stephen Miller, entitled ‘Whole Genome Selection through Genome Wide Imputation’. This collaboration has an objective of sharing sequence information on industry animals among the three countries combining to generate a total of 960X coverage of the bovine genome from some combination of X coverage per animal by n animals.
Genome-enabled genetic predictions
For traits in which national genetic evaluations exist, integration of the information from genomic tools is particularly appealing. As mentioned previously, efforts in this area consider indexing MBVs with genetic predictions in a two-step process of calculating MBVs and genetic predictions and indexing (blending) the results from each, fitting genomic relationships or estimating SNP effects and fitting the MBV as a correlated trait. The latter being a concession to the possibility that issues with intellectual property would prevent sharing of the raw SNP genotypes. There are international collaborations in genetic evaluations and, as such, collaborating on genotyping industry animals and sharing discovery information for the genetic evaluations would enhance the efforts towards integration. International evaluations still face the issue of discordance of SNP effects resulting from differences in phase and G × E interactions when fitting SNP or the genetic variance–covariance matrix built on genomic relationships.
Future opportunities
One wonders just how much of the genetic variation could be explained by the summation of single effects of markers following simple Mendelian inheritance based on our current tools and perhaps, more importantly, our gross measures of phenotypes. Many of the economically relevant traits of interest are complex in nature and breaking those complex traits down to simpler forms may lead to more effective discovery models. These simpler forms, termed physiological indicator traits by Thallman et al. (2008), allow examination of genomic influences on pathways that ultimately influence our ERTs even when the expression of the ERT is not observable (e.g. female reproduction in bulls or disease incidence with limited pathogen exposure). Thallman et al. (2008, p. 329) addressed this concept for disease resistance stating the following:
Physiological indicator traits (PIT) are those that are expected to be closely related to physiological processes that are components of disease resistance. In most cases, it should be useful to measure them in all animals in a population, whether sick or not. Ideally, it should be useful to measure them regardless of the level of natural exposure to disease. Because they are related to components, they are expected to have higher heritability than disease resistance itself. Because of higher expected heritability and greater effective numbers of observations than for disease incidence (especially when depending on natural exposure), QTL detection for PIT is likely to be considerably more successful than QTL detection for disease incidence directly.
Addressing the concept of phenomics (generating an extensive set of phenotypes at the biological level that contribute to the architecture of our suite of complex traits measured across time and environments) will add additional complexity to the data-collection strategies employed for future discovery work to enable successful MAS.
Finally, understanding the complex biological intermediaries from the genome to the phenotype and interactions with the proteome and metabolome will be important for the prediction of phenotypes for the application of MAM. Accurate phenotypic predictions will greatly enhance future strategies for activities such as optimising intervention for disease or predicting responses to vaccination or stimulation by hormonal growth promotants.
References
Aguilar I, Misztal I, Johnson DL, Legarra A, Tsuruta S, Lawlor TJ (2010) A unified approach to utilize phenotypic, full pedigree, and genomic information for genetic evaluation of Holstein final score. Journal of Dairy Science 93, 743–752.| A unified approach to utilize phenotypic, full pedigree, and genomic information for genetic evaluation of Holstein final score.Crossref | GoogleScholarGoogle Scholar | 1:CAS:528:DC%2BC3cXht1CjtbY%3D&md5=2492a3d6a1616186be64ad6e6abb4fd2CAS |
Bolormaa S, Hayes BJ, Savin K, Hawken R, Barendse W, Arthur PF, Herd RM, Goddard ME (2011a) Genome-wide association studies for feedlot and growth traits in cattle. Journal of Animal Science 89, 1684–1697.
| Genome-wide association studies for feedlot and growth traits in cattle.Crossref | GoogleScholarGoogle Scholar | 1:CAS:528:DC%2BC3MXnsVWktr0%3D&md5=2d87660a340ad5b0c8374e656685e5e4CAS |
Bolormaa S, Porto Neto LR, Zhang YD, Bunch RJ, Harrison BE, Goddard ME, Barendse W (2011b) A genome-wide association study of meat and carcass traits in Australian cattle. Journal of Animal Science 89, 2297–2309.
| A genome-wide association study of meat and carcass traits in Australian cattle.Crossref | GoogleScholarGoogle Scholar | 1:CAS:528:DC%2BC3MXps1yqtbY%3D&md5=28b65730dce0e13791c727a4f8e577bcCAS |
Casas E, Shackelford SD, Keele JW, Stone RT, Kappes SM, Koohmaraie M (2000) Quantitative trait loci affecting growth and carcass composition of cattle segregating alternate forms of myostatin. Journal of Animal Science 78, 560–569.
Casas E, Stone RT, Keele JW, Shackelford SD, Kappes SM, Koohmaraie M (2001) A comprehensive search for QTL affecting growth and carcass composition of cattle segregating alternative forms of the myostatin gene. Journal of Animal Science 79, 854–860.
Casas E, Shackelford SD, Keele JW, Koohmaraie M, Smith TPL, Stone RT (2003) Detection of quantitative trait loci for growth and carcass composition in cattle. Journal of Animal Science 81, 2976–2983.
Casas E, White SN, Shackelford SD, Wheeler TL, Koohmaraie M, Bennett GL, Smith TPL (2007) Assessing the association of single nucleotide polymorphisms at the thyroglobulin gene with carcass traits in beef cattle. Journal of Animal Science 85, 2807–2814.
| Assessing the association of single nucleotide polymorphisms at the thyroglobulin gene with carcass traits in beef cattle.Crossref | GoogleScholarGoogle Scholar | 1:CAS:528:DC%2BD2sXhtlWitbrO&md5=3e6d4f8c26cf43049b07af53f4e6ab2fCAS |
Charlier C, Coppieters W, Rollin F, Desmecht D, Agerholm JS, Cambisano N, Carta E, Dardano S, Dive M, Fasquelle C, Frennet J-C, Hanset R, Hubin X, Jorgensen C, Karim L, Kent M, Harvey K, Pearce BR, Simon P, Tama N, Nie H, Vandeputte S, Lien S, Longeri M, Fredholm M, Harvey RJ, Georges M (2008) Highly effective SNP-based association mapping and management of recessive defects in livestock. Nature Genetics 40, 449
| Highly effective SNP-based association mapping and management of recessive defects in livestock.Crossref | GoogleScholarGoogle Scholar | 1:CAS:528:DC%2BD1cXjslCgtbY%3D&md5=f85a84f961b12c241f058869bf58bdaaCAS |
Cleveland MA, Forni S, Deeb N, Maltecca C (2010) Genomic breeding value prediction using three Bayesian methods and application to reduced density marker panels. BioMed Central Proceedings 4, S6
Garrick DJ, Taylor JF, Fernando RL (2009) Deregressing estimated breeding values and weighting information for genomic regression analyses. Genetics, Selection, Evolution. 41, 55
| Deregressing estimated breeding values and weighting information for genomic regression analyses.Crossref | GoogleScholarGoogle Scholar |
Goddard ME (2009) How can we best use DNA data in selection of cattle? In ‘Proceedings of Beef Improvement Federation 41st annual research symposium’, 30 April–3 May 2009, Sacramento, CA. pp. 81–91.
Habier D, Fernando RL, Kizikaya K, Garrick DJ (2011) Extension of the Bayesian alphabet for genomic selection. BioMed Central Bioinformatics 12, 186
Kachman SD (2008) Parameters needed to add genomics to genetic prediction. In ‘Proceedings of the 9th genetic prediction workshop’, Kansas City, MO, pp. 92–98. (Beef Improvement Federation: Raleigh, NC)
Kim JJ, Farnir F, Savell J, Taylor JF (2003) Detection of quantitative trait loci for growth and beef carcass fatness traits in a cross between Bos taurus (Angus) and Bos indicus (Brahman) cattle. Journal of Animal Science 81, 1933–1942.
Lande R, Thompson R (1990) Efficiency of marker-assisted selection in the improvement of quantitative traits. Genetics 124, 743
MacNeil MD, Nkrumah JD, Woodward BW, Northcutt SL (2010) Genetic evaluation of Angus cattle for carcass marbling using ultrasound and genomic indicators. Journal of Animal Science 88, 517–522.
| Genetic evaluation of Angus cattle for carcass marbling using ultrasound and genomic indicators.Crossref | GoogleScholarGoogle Scholar | 1:CAS:528:DC%2BC3cXktVOqtrk%3D&md5=427b7fa6c3248e30cb2b362fc131e8d1CAS |
Meuwissen TH, Hayes BJ, Goddard ME (2001) Prediction of total genetic value using genome-wide dense marker maps. Genetics 15, 1819–1829.
Meyers SN, McDaneld TG, Swist SL, Marron BM, Steffen DJ, O’Toole D, O’Connell JR, Beever JE, Sonstegard TS, Smith TP (2010) A deletion mutation in bovine SLC4A2 is associated with osteopetrosis in Red Angus cattle. BioMed Central Genomics 11, 337
Miller S, Lu D, Vander Voort G, Sargolzaei M, Caldwell T, Wang Z, Mah J, Plastow G, Moore S (2010) Beef tenderness QTL on BTA25 from a whole genome scan with the BovineSNP50 Beadchip. In ‘Proceedings of the 9th world congress on genetics applied to livestock production’, 1–6 August 2010, Leipzig, Germany. CD-ROM Communication 0675.
Saatchi M, McClure MC, McKay SD, Rolf MM, Kim JW, Decker JE, Taxis TM, Chapple RH, Ramey HR, Northcutt SL, Bauck S, Woodward B, Dekkers JCM, Fernando RL, Schnabel RD, Garrick DJ, Taylor JF (2011) Accuracies of genomic breeding values in American Angus beef cattle using k-means clustering for cross-validation. Genetics, Selection, Evolution. 43, 40
| Accuracies of genomic breeding values in American Angus beef cattle using k-means clustering for cross-validation.Crossref | GoogleScholarGoogle Scholar |
Snelling WM, Allan MF, Keele JW, Kuehn LA, McDaneld T, Smith TPL, Sonstegard TS, Thallman RM, Bennett GL (2010) Genome-wide association study of growth in crossbred beef cattle. Journal of Animal Science 88, 837–848.
| Genome-wide association study of growth in crossbred beef cattle.Crossref | GoogleScholarGoogle Scholar | 1:CAS:528:DC%2BC3cXktVOqurw%3D&md5=b0c361c36448a3aa767f22d82b13649cCAS |
Snelling WM, Allan MF, Keele JW, Kuehn LA, Thallman RM, Bennett GL, Ferrell CL, Jenkins TG, Freetly HC, Nielsen MK, Rolfe KM (2011) Partial-genome evaluation of postweaning feed intake and efficiency of crossbred beef cattle. Journal of Animal Science 89, 1731–1741.
| Partial-genome evaluation of postweaning feed intake and efficiency of crossbred beef cattle.Crossref | GoogleScholarGoogle Scholar | 1:CAS:528:DC%2BC3MXnsVWktrk%3D&md5=2523dccb7b2a914f24fbb2af156d9855CAS |
Thallman RM, Kuehn LA, Allan MF, Bennett GL, Koohmaraie M (2008) Opportunities for collaborative phenotyping for disease resistance traits in a large beef cattle resource population. Developments in Biologicals 132, 327–330.
| Opportunities for collaborative phenotyping for disease resistance traits in a large beef cattle resource population.Crossref | GoogleScholarGoogle Scholar | 1:CAS:528:DC%2BD1MXmt1Cksg%3D%3D&md5=067954327496d355343aab8aa2194148CAS |
Thallman RM, Hanford KJ, Quaas RL, Kachman SD, Templeman RJ, Fernando RL, Kuehn LA, Pollak EJ (2009) Estimation of the proportion of genetic variation accounted for by DNA tests. In ‘Proceedings of the Beef Improvement Federation 41st annual research symposium and annual meeting’, 30 April–3 May 2009, Sacramento, CA. pp. 184–209.
Van Eenennaam AL, Li J, Thallman RM, Quaas RL, Dikeman ME, Gill CA, Franke DE, Thomas MG (2007) Validation of commercial DNA tests for quantitative beef quality traits. Journal of Animal Science 85, 891–900.
| Validation of commercial DNA tests for quantitative beef quality traits.Crossref | GoogleScholarGoogle Scholar | 1:CAS:528:DC%2BD2sXjslWlu7o%3D&md5=185ded947a2309529cd86c8e06d17acdCAS |
Van Eenennaam AL, Thallman RM, Quaas RL, Hanford K, Pollak EJ (2009) Validation and estimation of additive genetic variation associated with DNA tests for quantitative beef cattle traits. Proceedings of the Association for Advancement of Animal Breeding and Genetics 18, 129–132.
1Mention of trade names or commercial products in this publication is solely for the purpose of providing specific information and does not imply recommendation or endorsement by the USDA.
2USDA is an equal opportunity provider and employer.