

Estimating the balance between pasture feed supply and demand of grazing livestock in a farmlet experiment
L. M. Shakhane A B , J. M. Scott B E , G. N. Hinch B , D. F. Mackay C and C. Lord DA Department of Animal Science, National University of Lesotho, PO Roma 180, Lesotho.
B School of Environmental and Rural Science, University of New England, Armidale, NSW 2351, Australia.
C 3 Jayne Close, Armidale, NSW 2350, Australia.
D 28 Kate Street, Indooroopilly, Qld 4068, Australia.
E Corresponding author. Email: dr.jimscott@gmail.com
Animal Production Science 53(8) 711-726 https://doi.org/10.1071/AN12453
Submitted: 31 December 2012 Accepted: 13 May 2013 Published: 10 July 2013
Journal Compilation © CSIRO Publishing 2013 Open Access CC BY-NC-ND
Abstract
Data from the Cicerone farmlet study were used to quantify the balance between pasture feed supply and the demand from grazing livestock, in terms of metabolisable energy (ME), on three differently managed farmlets (each of 53 ha) on the Northern Tablelands of New South Wales, Australia. Farmlet A had a high level of pasture renovation and higher soil fertility than the other two farmlets and employed flexible grazing management over eight paddocks. Farmlet B was designed to represent management ‘typical’ of the region and had the same grazing management and number of paddocks as farmlet A but moderate levels of pasture renovation and soil fertility. The third farmlet (C) had the same level of inputs as farmlet B but practised intensive rotational grazing over 37 paddocks.
Regular measurements of the feed supply, namely herbage mass and quality, pasture growth and supplement fed and of feed demand were assembled to provide monthly estimates of the balance between feed supply and animal demand of all classes of livestock run on the experiment over its duration of 6.5 years. The significantly greater stocking rate, liveweight and reproductive rate of sheep reached on the higher input system (farmlet A) meant higher levels of ME were required to satisfy the nutritional demands of these animals. As only limited measurements were taken of animal intake, it was assumed that the supply of ME was derived from pasture growth and supplement fed. Using key livestock management dates and measurements of liveweights, the changes in the energy requirements of each class of animal were calculated and aggregated to provide an estimate of overall livestock energy demand over time. Subtracting the energy demand from the estimated energy supply provided a partial net energy balance.
Measurements of the rates of change of green herbage during grazing events were found to be highly dependent on stock density with farmlets A, B and C recording rates of change of up to –50, –30 and –200 green DM/ha.day, respectively.
Over a series of generally drier-than-average years, the ME supplied in pasture growth and through supplementation was at times inadequate to meet the energy demands of the livestock, resulting in periods during winter when the partial energy balance became negative. Similar feed deficits were observed for all three farmlets, suggesting that they were over-stocked to a similar extent. In spite of the divergence in the stocking rate supported by each farmlet, the similarity of the ME balances between farmlets suggests that no farmlet was subjected to bias because of decisions relating to feed supply and demand. The analyses presented suggest there is considerable potential for practical paddock and grazing management to be improved if more timely and regular assessments can be made of changes in the feed energy supply using satellite images of normalised difference vegetation indices and feed energy demand using calculations of the ME required by grazing livestock.
Additional keywords: grazing management, metabolisable energy.
Introduction
The quantity and quality of the pasture feed supply fluctuates greatly as seasons evolve and episodic climatic conditions affect pasture growth rates. Also, changes in pasture botanical composition, soil fertility and stocking rate result in changes in pasture supply over the medium- to longer term. It is well known that increasing soil fertility through the application of fertilisers can have large effects on pasture production and its distribution over changing seasons (Lambert et al. 2004). Changes in animal requirements are much more regular and predictable than changes in pasture supply, and vary according to reproductive status and growth demands. Generally, pasture-based grazing enterprises aim to achieve a balance between the demands of the grazing animals and the relatively unpredictable fluctuations in herbage supply (Hodgson 1990). According to Maxwell (1990), grazing management decisions affect the degree of animal impact on pastures and thereby can alter the composition and quality of an animal’s diet. Kemp (1994) noted the need for a biological understanding of grazing management, pointing out the important influences of the pasture state on grazing, the duration of the grazing event, the length of rest between grazings and the degree of dietary choice available to the animal.
Although some have claimed that intensive grazing management can result in enhanced animal production (Savory and Parsons 1980; McCosker 2000), Waller et al. (2001) found that, under moderately intensive rotations, the quality of pastures and soil fertility had much greater effects on livestock production than did grazing management. When animals compete for food under conditions of high grazing intensity, they can be forced to eat a lower quality diet resulting in a steep decline in the rate of animal growth as the grazing pressure (number of animal units per unit of forage) increases (Murtagh 1975).
Under the erratic and unpredictable climatic and economic environments found in Australia, successful grazing systems require compromises to be made between the conflicting needs of soils, pastures, and animals (Vizard and Foot 1993). They note that, for any grazing system, it is necessary to carry out forward planning regarding the pasture supply and the animals’ demand for feed; however, they acknowledge that a large proportion of livestock producers make grazing management decisions with little planning. Bell and Allan (2000) agree, stating that decisions about grazing management are often taken in a subjective fashion, after a visual assessment of the pasture on offer, along with the condition of the grazing animals. They described the evolution of the Prograze extension program, which trains graziers in the skills to assess pastures on offer, as well as animal condition and demand. Pasture assessment has been described as an essential tool if there is to be any hope of balancing the feed supply and feed demand (Clark 2010).
As noted by Duru et al. (2007), stocking rate depends primarily on net herbage growth. Several decision support systems have been developed for monitoring and adjusting stocking rate according to animal demand and seasonal pasture supply, especially in the rangelands (Stuth et al. 2002). There has been a considerable effort in Australia to develop models of animal nutrition and pasture growth, availability and quality, especially through the GRAZPLAN suite of models (Donnelly et al. 1997; Freer et al. 1997; Moore et al. 1997). Mason et al. (2003) pointed out the need for more refinement of ways to find the most appropriate balance between supply and demand; in part, this led to the development of the Sustainable Grazing Systems model (Johnson et al. 2003). In a comparison of the suitability of a wide range of models for exploring aspects of the complex interacting components of pastoral farms, Bryant and Snow (2008) reported that the GRAZPLAN models had particular strengths in the areas of animal production and farm management. Specifically, the model of Freer et al. (1997) allows for the prediction of the required intake of energy and protein for given levels of animal production, including the effects of animal physiology, selective grazing and supplementary feeding.
In New Zealand, considerable effort has been devoted to planning the supply of feed from pastures, with pasture growth and the feed demand of grazing animals expressed in terms of metabolisable energy (ME) (Milligan et al. 1987). However, as noted by Gray et al. (2003), few farmers in New Zealand have adopted the formal feed planning systems which have been widely promoted in that country; instead, they have adopted more flexible approaches, which have allowed them to cope better with uncertainty. In Australia, some calculator tools have recently become available, such as the Evergraze Feed Budget and Rotation Planner to facilitate calculations of stocking rate, pasture growth rate and how long paddocks can be grazed (Anonymous 2012), but they require a large amount of information to be entered if they are to be useful; many graziers find it difficult to provide the detailed level of information required. Although some in Australia have reported changes in pasture supply in terms of ME (Holst et al. 2006), it appears that few have attempted to compare the energy of the feed supply with the energy required by the grazing animals over the life of a grazed experiment.
Willoughby (1959) questioned the validity of field grazing experiments which do not take into account the effects of grazing throughout the year and the effects of pastures on grazing livestock and vice versa. Writing about the design of grazing experiments, Morley and Spedding (1968) pointed out that management must take into account adjustments to stocking rate, conservation of surplus forage, the feeding of supplements during feed deficit periods and the effects of deferred grazing in an attempt to increase feed supply. Murtagh (1975) called for grazing experiments which permit differences in pasture management and stocking rate within different systems.
In response to these needs, the Cicerone farmlet experiment adopted a whole of farmlet approach so that all of the interacting factors were embedded within the design of the experiment, which sought to explore how different management might affect the profitability and sustainability of each whole-farmlet system. The planning of this experiment took into account the recommendation of Kemp et al. (2000) that the knowledge from the national Temperate Pasture Sustainability Key Program – such as the need to enhance the persistence of sown perennial grasses – needed to be tested at a more commercial scale.
The farmlet experiment explored the effects of pasture renovation and increased soil fertility as well as intensive rotational grazing on farmlet performance. The results of this experiment have been presented in several related papers in this Special Issue including several of particular relevance including botanical composition (Shakhane et al. 2013b), herbage mass, quality and growth (Shakhane et al. 2013a), livestock weights (Hinch et al. 2013a), ewe fat scores and reproduction (Hinch et al. 2013b) and wool production (Cottle et al. 2013).
This paper presents a synthesis of the balance between feed supply and animal demand through estimates of the ME presented in pastures and supplements and that required by the animals grazing them. The hypothesis explored in this paper is that, during periods of nutritional deficit, the population of livestock on all three farmlets were subjected to similar levels of nutritional ‘stress’ and so the management of pasture supply and animal demand did not bias the experimental comparison of treatments. A secondary aim of the paper is to explore differences in the rates of change in herbage mass, especially of the green component, under the range of stock densities imposed on each farmlet during grazing; these rates of change are linked to both pasture growth rates and the potential for grazing animals to select a high quality diet during grazing and hence meet their energy needs.
Methods
The farmlet experiment was conducted on the CSIRO McMaster Research Farm near Uralla on the Northern Tablelands of New South Wales. The selection of the Cicerone farmlet treatments and the development of the general guidelines and methods employed in the experiment have been described in a related paper by Scott et al. (2013). In brief, three adjacent 53-ha farmlets were designed to allow for multi-disciplinary studies of the soils, pastures, livestock and economics of different management systems chosen following a survey and considerable subsequent negotiation with livestock producer members of the Cicerone Project (Kaine et al. 2013). The farmlets comprised first a farmlet (B), which was designed to be typical of management within the region with a moderate level of pasture and soil fertility inputs and flexible rotational grazing over its eight paddocks. A second farmlet (A) employed higher rates of pasture renovation and soil fertility with eight paddocks and a similar flexible rotational grazing regime. The third farmlet (C) received the same moderate inputs as farmlet B but was subdivided into 37 paddocks, which allowed it to practise intensive rotational grazing. Thus, farmlets A and B provided a comparison between the levels of inputs while farmlets B and C compared the effects of different intensities of grazing management. Methods specific to this paper are described further below.
The average length of grazing periods at the level of subpaddocks on farmlets A, B and C over the trial period were 47, 75 and 11 days, respectively, while the average number of rest days were 64, 66 and 98 days, respectively (Walkden-Brown et al. 2013). Although target stocking rates were initially set for farmlets A and C of 15 dry sheep equivalents per ha and 7.5 for farmlet B, stocking rate was acknowledged to be an emergent property (Chapman et al. 2003) of each of the farmlets. Details of how stocking rate decisions were made have been provided in a related paper by Scott et al. (2013) while the recorded fluctuations in stocking rates and stocking densities over time have been reported by Hinch et al. (2013a).
Measurements and calculations of ME balance
Pasture supply
Assessments of pasture herbage mass were made infrequently over the first 3 years of the experiment; these measurements consisted of estimates of total herbage mass concurrent with the approximately annual assessments of botanical composition (Shakhane et al. 2013b). Subsequently, from April 2003 to December 2006, detailed calibrated visual assessments of herbage mass and quality were made each month across all the paddocks of each farmlet (Shakhane et al. 2013a).
In addition, uncalibrated visual estimates of pasture herbage mass and percentage green were recorded each week by the Cicerone farm manager when completing stock movement recording sheets. The correlation between these estimates and those from the detailed, calibrated monthly measurements, over common dates, were found to have Pearson correlation coefficients of 0.66 and 0.70 between the estimates of total herbage and green percent, respectively. The uncalibrated visual estimates helped to guide the extrapolation of herbage mass values before April 2003 to enable estimates to be made over the entire experimental period.
From these data, ME was calculated at monthly intervals. The data for digestibility of green and dead herbage mass were converted into total daily pasture ME available per ha by multiplying the dry matter (DM) of green and dead by their respective energy values. The ME (M/D value) (Freer et al. 1997) of green and dead was calculated from the relationship between dry matter digestibility (DMD) of both green and dead fractions using the equation (Standing Committee on Agriculture 1990):

The ME values were summed to provide estimates of the ME available in standing herbage mass, growing pasture and in supplements fed on each farmlet.
Pasture growth was assessed over periods of 18–35 days, using grazing exclosure cages on three representative paddocks of each farmlet between winter 2003 and late summer of 2005. As explained by Shakhane et al. (2013a), small sampling sizes, high variability between paddocks and generally below-average soil moisture conditions, resulted in the differences in pasture growth observed between farmlets not being statistically significant; nevertheless, measured daily growth rates varied from near zero in winter to more than 60 kg DM per ha in late summer in some years (Shakhane et al. 2013a).
In order to estimate how pasture growth might have varied between farmlets over time, a synthetic estimate of monthly pasture growth rate on each farmlet was constructed from several sources, including climatic growth indices (Behrendt et al. 2013c), measurements of seasonal differences in pasture growth rate described above and the observed differences between farmlets in average greenness values detected each spring using satellite images of normalised difference vegetation indices (NDVI) (Donald et al. 2013). The growth indices calculated over the experimental period were adjusted by the relative differences in average NDVI values between farmlets measured each spring (Table 1).
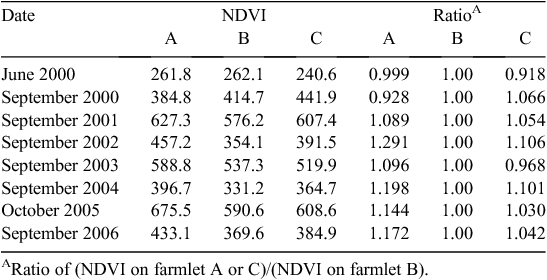
|
The adjusted growth indices, which ranged from 0 to ~0.6, were multiplied by a constant factor (chosen as 100) to provide an estimate of pasture growth rate over the entire experimental period. This growth estimate reflected the net pasture growth measurements reported by Shakhane et al. (2013a), which ranged from 0 in winter to a maximum of ~60 kg DM per ha per day measured in the summer of 2004. The ME contained in the new pasture growth was calculated by multiplying the estimated pasture growth rate by an estimate of the ME value of new growth as described below. Because of the significantly higher level of digestibility of both green and dead herbage (Shakhane et al. 2013a), the higher level of C3 species (Shakhane et al. 2013b) and the higher level of legume herbage measured on farmlet A (Shakhane et al. 2013a), the digestibility of new growth was assumed to be substantially higher on farmlet A compared with the other two farmlets. New growth on farmlet A was assigned a digestibility of 85% or (12.45 MJ/kg), which is similar to that measured by Arnold (1962). New growth on both farmlets B and C was assigned a digestibility of 75% (10.75 MJ/kg) because of the lower levels of legume (Shakhane et al. 2013a), of C3 species (Shakhane et al. 2013b) and of soil fertility (Guppy et al. 2013) on those farmlets compared with farmlet A. The difference of 10% in the digestibility of new growth is consistent with the differences in digestibility of green herbage observed between farmlet A and the other two farmlets (Shakhane et al. 2013a).
Supplement
Records of the average amount of supplement fed per month to animals grazing on each farmlet, which was dominated by high energy supplements of lupins, maize and cottonseed meal, were extracted from the Cicerone relational database (Scott et al. 2013) and converted to ME values by multiplying the weight fed by the weighted average energy value of 12.17 MJ per kg DM (Scott et al. 2013). In general, supplements were fed to ewes during pregnancy to maintain a minimum fat score of 2.5 and also to maintain growth rates of hoggets. More details of the type and level of supplements fed have been provided by Scott et al. (2013).
Calculation of ME supply
Because animal intake was measured only within one paddock of each farmlet over three seasons (Shakhane 2008), this was not considered sufficient to allow the estimation of intake across all paddocks over the 6.5 years of the experiment. Thus, no attempt has been made to estimate the relative contributions to animal intake derived from the green and dead herbage mass fractions. The total ME supply was calculated as the sum of the ME derived from both estimated pasture growth and from records of the levels of supplement fed.
Animal ME demand and DM intake
Estimation of the ME demand and DM intake of all grazing livestock on each farmlet was calculated using the equations developed by Freer et al. (1997) for use in the Decision Support Tool, GrazFeed, and made available in the form of a Microsoft Excel spreadsheet ‘ME_Required’ (Freer 2009). The equations within these spreadsheets enabled the calculation of both the energy demand and the intake required to support sheep and cattle of a particular breed, age, weight, rate of liveweight change and reproductive stage for this particular latitude (30°37′S), and day of year. The breed of sheep was Merino while cattle calculations were based on Bos taurus spreadsheet parameters as the breed of all cattle run on the farmlets were either Hereford or Angus. The standard reference weights chosen for the different classes of livestock reflected the weights recorded for breed and class of sheep and cattle run within the experiment.
The first stage was to extract relevant data from the Cicerone database to provide inputs of animal age, liveweight and growth rate data to the spreadsheet for all farmlets, years and months that any particular classes of animals were grazed on the farmlets. This included extracting data for the proportion of feed derived from the pasture (1-supplement), the proportion of legume in the pasture, the ME value of the pasture, the fleece-free weight of the livestock (a linear growth rate of wool was assumed between shearings), the daily rate of liveweight change, the pregnancy status, the lamb weight and growth rate during lactation, and the average age and number of animals in each mob. For those months which did not have measured values of liveweights available, the data were calculated using linear interpolation between the closest measured values. For some classes of livestock which were infrequently weighed, such as wethers, ewes and cattle, interpolation of data was required over several months. As hoggets were weighed at ~1-month intervals from weaning, little interpolation of data was required for this livestock class. Interpolation allowed for a monthly accounting of the ME requirements of all livestock grazing the farmlets over the experiment’s duration.
For sheep on all farmlets, the proportion of lamb ME derived from milk was assumed to be ~1 for the first 3 and 2 weeks for single and twin lambs, respectively, diminishing thereafter linearly to 0 at 12 weeks of age (G. Hinch, pers. comm.). The birthweight of lambs was assumed to have been 3.5 and 3.0 kg per head for single and twin lambs, respectively (G. Hinch, pers. comm.).
Lamb growth rates for twin lambs were assumed to be 84% of the rate of single lambs based on the observation by Holst et al. (2006) that Merino × Dorset twin lambs grew at 280 g per day while singles grew at 332 g per day. Lamb weights before weaning were extracted from the database for each farmlet and year and, assuming the birthweight above for single and twin lambs, the growth rates were estimated. Estimates of growth rates during lactation for twin lambs ranged from 128 g per day in 2000 to 277 g per day in 2003 while singles ranged from 147 (2000) to 330 g per day (2003). As lambs were not weighed while suckling the ewes, lamb growth rates were assumed to have been uniform over the 3 months of lactation for the three farmlets and over the different years lambs were born (from 1999 to 2005). While lamb growth rates differed, as confirmed by their weights measured near weaning, the rate of growth over the 3 months of lactation was assumed to be linear.
The energy cost of grazing has been suggested to range from 5 to 20% (Freer 2009). Because the paddocks on each farmlet were relatively small and with little slope, the value for the energy cost of grazing was chosen to be 5% across all farmlets.
No cattle were weighed up to the end of 2001, therefore daily weight gains were conservatively estimated to have been 250 g per day for the first cohort of cattle on each farmlet from July to December 2000 and 500 g per day for heifers on all three farmlets from March to October, 2001. Therefore, no bias between farmlets was introduced by these estimates. For the remainder of the period, actual weights of cattle which came onto and left the farmlets were available and so the intervening monthly weights and liveweight change were estimated, where necessary, through interpolation.
When the total ME required per day for a particular class of livestock was multiplied by the numbers of stock on each farmlet, a total ME required per day for each mob was obtained at monthly intervals over the duration of the experiment. The sum of the ME required by all mobs provided an estimate of the total ME required per day for each farmlet.
Net ME balance
The net ME balance was calculated for each of the three farmlets by subtracting the ME required for all animal classes from the ME supplied by the pasture as growth and supplement. It was assumed that the livestock would have eaten all of the new growth and supplement (most commonly lupins, cottonseed meal and maize), especially over the winter period, when the balance between supply and demand was most negative and hence animals would have been likely to consume any available recent growth and/or supplement.
Rate of change in pasture herbage mass under grazing
During the experiment, it was observed that changes in herbage mass levels during grazing events, and especially consumption of the green component, were less rapid on farmlets A and B compared with farmlet C. Consequently, assessments of the rate of change in the levels of green, dead and legume herbage mass were made in order to quantify these effects. Measurements were made on three paddocks of each of the three farmlets over a 20-month period between 20 June 2003 and 4 March 2005. Each assessment comprised measurement of the green, dead and legume herbage mass using Median Quadrat pasture frames (300 by 500 mm) (Bell 2007) at a wide array of starting and ending dates of grazing periods and of stock densities on each farmlet and the subsequent calculation of the rate of change of each fraction over each period. The duration of the grazing periods for which measurements were made ranged from 7 to 202 days.
Statistical methods
As the estimates of ME were calculated at the level of each whole, unreplicated farmlet, no statistical analyses were considered appropriate. Issues of causal inference which can be derived from unreplicated experiments such as this have been discussed in detail in a related paper by Murison and Scott (2013).
The rate of change in pasture herbage mass data was plotted against stock density with a loess curve fitted to indicate the shape of the relationship between these two factors (R Development Core Team 2011). Differences between farmlets in the rates of change in herbage mass were explored with a multinomial logit regression model using the VGAM package of R (Yee 2012). Because of the many factors which would have influenced the rate of change over a range of different paddocks, periods, seasons and stocking densities, a multivariate analysis was conducted using the Redundancy Analysis procedure of Zuur et al. (2007) using the software ‘Brodgar’ (version 2.7.2, Highland Statistics Ltd, Newburgh, United Kingdom), which links to the statistical program R.
Results
Adjusted pasture growth index
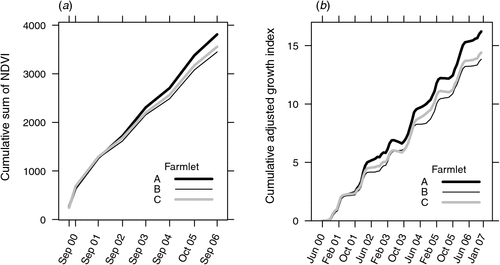
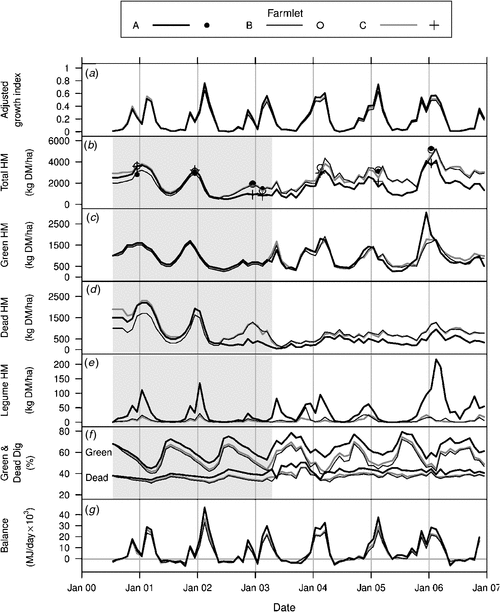
Fig. 1a shows the cumulative differences in greenness, or NDVI, measured by satellite imagery and which is known to reflect differences in potential pasture growth rate (Donald et al. 2013). Fig. 1b shows the changes in the cumulative growth index over the duration of the experiment adjusted for the differences in NDVI shown in both Table 1 and Fig. 1a. The differences between the adjusted pasture growth index for each farmlet approximate the differences in the measured levels of greenness, or potential pasture growth, assessed by satellite which were found to be significantly different (Donald et al. 2013). These same values of adjusted pasture growth index are also shown over the duration of the experiment in Fig. 2a below.
|
|
Pasture supply
Measurements of pasture supply (herbage mass, pasture growth, and pasture quality), especially between April 2003 and the end of the experiment in December 2006, have been provided in a related paper by Shakhane et al. (2013a). These results showed that from April 2003 onwards, the most notable differences between farmlets were that farmlet A had significantly lower levels of dead herbage but higher digestibility of both green and dead herbage than either of the other farmlets. In order to develop an estimate of the relative differences in pasture supply over the entire 6.5 years of the farmlet experiment, the average monthly results have been reproduced here in Fig. 2 together with estimates extrapolated back to the beginning of the experiment in July 2000 as explained further below.
In order to extrapolate total herbage mass values back to July 2000, the relative differences in herbage mass measured in March 2000 (data not shown) were taken into account; these values were assumed to have been affected by differences in levels of senesced dead herbage because of little grazing before March 2000. In the case of green and legume herbage mass and of green and dead digestibility, the extrapolation of values before April 2003 took into account the differences between farmlets at that measurement but reduced these differences in a linear fashion so that there was nil difference between farmlets in these attributes at July 2000.
Total herbage
Fig. 2b shows the total DM measured between April 2003 and December 2006 (Shakhane et al. 2013a) together with the annual estimates taken when botanical composition assessments were undertaken in late summer from 2000 to 2005–06 inclusive. The extrapolation of the data was determined by trial-and-error using the monthly growth index (Fig. 2a) as a visual guide to the seasonal fluctuations which occurred and by ensuring that the lines passed through the data points from the annual assessments of total DM, thus anchoring the lines to ensure that deviations from those known measurement points were minimised. It is acknowledged that these extrapolations over the period marked by the grey shading in Fig. 2 are approximations.
Green, dead and legume herbage
The levels of green, dead and legume herbage are shown over time in Fig. 2c, d and e, respectively. Again, the measured monthly values are shown from April 2003 to December 2006 (Shakhane et al. 2013a) while extrapolated values before April 2003 are based on estimates from the farm manager’s weekly records of green percent together with seasonal patterns of growth indicated by the adjusted growth indices (Fig. 2a). The extrapolated estimates of the amounts of dead herbage were derived as the difference between the extrapolated values of total and green herbage.
Green and dead digestibility
Changes in the levels of green and dead digestibility measured from April 2003 to December 2006 (Shakhane et al. 2013a) are shown in Fig. 2f together with extrapolated values before April 2003.
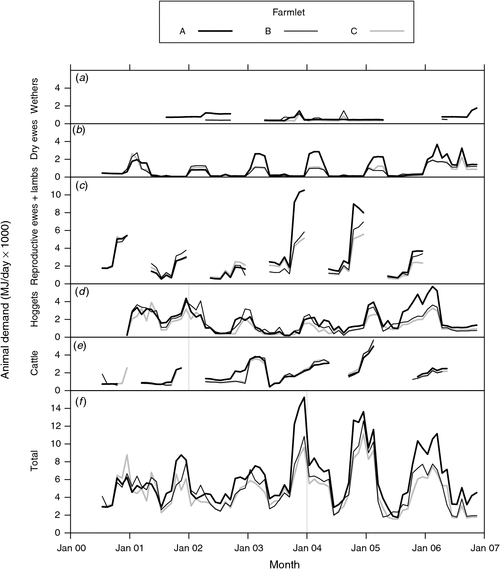
Animal demand
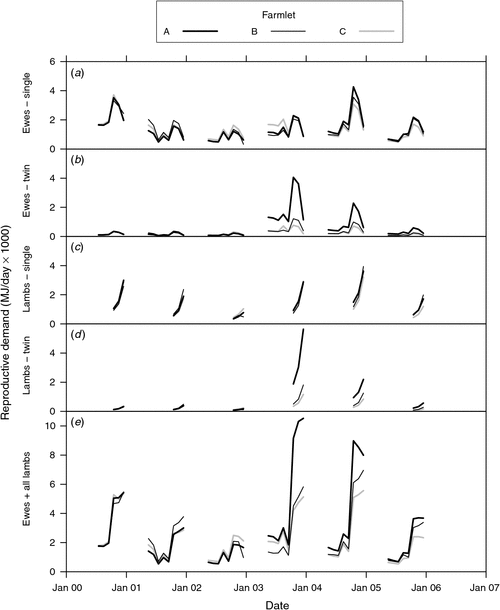
Details of animal performance in response to the farmlet treatments have been presented in related papers on liveweights (Hinch et al. 2013a), fat scores and reproduction (Hinch et al. 2013b) and wool production (Cottle et al. 2013). Fig. 3 presents the ME demand of the class of livestock responsible for the greatest demand, the reproductive ewes and their progeny, providing detail of the contribution to the total demand of the ewes with single and twin lambs during pregnancy and lactation. This shows that differences between ewes on the three farmlets increased over time because of differences in reproductive rates (Hinch et al. 2013b), stocking rate and growth rates per head (Hinch et al. 2013a). The effect of the much higher rate of twinning on farmlet A compared with the other farmlets in 2003 (Hinch et al. 2013b) is obvious as is the steep increase in demand following the birth of lambs in each year.
|
Fig. 4 shows the ME demand of each class of livestock over the duration of the experiment for wethers, dry ewes, reproductive ewes and lambs (derived from Fig. 3e), hoggets (sum of demand of all ‘hoggets’ from weaning to 18 months of age of all cohorts born from 2000 to 2005), cattle and the overall total. In general, the ME demand of the different classes of sheep was highest on farmlet A followed by B and then C, reflecting the differences in stocking rate and the different per-head performance of the animals on each farmlet over time (Hinch et al. 2013a).
|
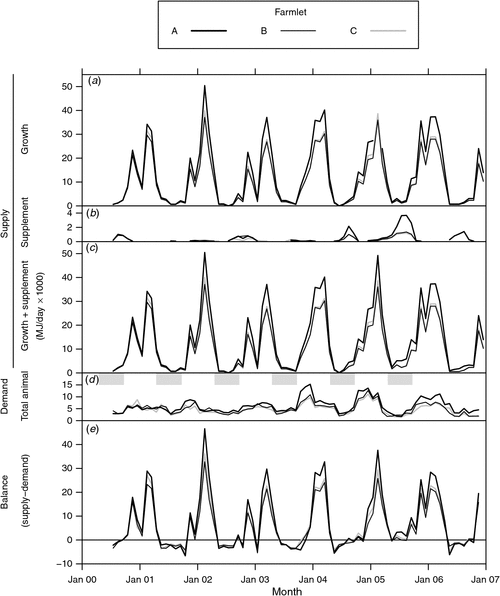
Although animal demand has been presented here primarily in terms of ME, as it provides a single measure representing both quantity and quality of the feed supply, an indication of the DM intake required by each class of livestock, averaged over all dates, is also shown in Table 2. For all classes, the average intake per head required by farmlet A livestock was considerably lower than farmlet B livestock with farmlet C animals having intermediate requirements. Relative to livestock on farmlet B, Table 2 shows that farmlet C animals were estimated to have eaten some 90% of the DM intake, reflecting the lower levels of animal performance on that farmlet documented in related papers. In contrast, farmlet A animals, which in general performed as well or better than farmlet B livestock, required on average only 71% of the per-head intake of farmlet B animals, reflecting the higher quality of the feed supply available to farmlet A livestock.
|
Calculation of net ME balance
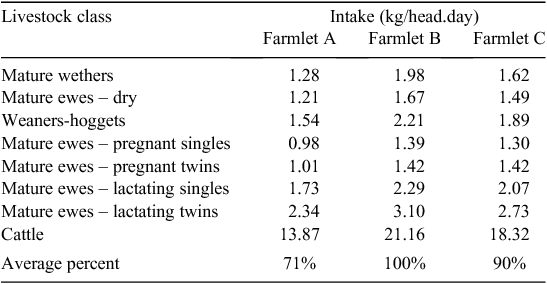
Total supply (pasture growth + supplement fed)
Estimates of the total ME contained in the pasture growth, the supplement fed and the sum of both, representing the total ME supply for each farmlet, are shown in Fig. 5a, b and c, respectively. The differences between farmlets in estimated growth using the adjusted growth indices are most obvious during the spring to autumn period while the differences during winter are minimal. Farmlet A clearly shows higher estimated growth than the other farmlets because of the differences in adjusted growth index, especially during the summers of 2003–04 and 2005–06. In the case of supplement fed, the greatest differences were in the winters and early springs of 2004–06 when farmlet A received substantially more supplement than either of the other farmlets, due no doubt to its higher stocking rate during those years.
|
Total animal demand
Fig. 5d shows the total ME demand from all livestock as described above and as shown in Fig. 4f.
Net ME balance
The estimated partial net energy balance (Fig. 5e), calculated from the difference between the total supply (Fig. 5c) and total demand (Fig. 5d), shows large cyclical changes between the winter and summer periods. While it is apparent that there are considerable differences between farmlets in the summer months, no such differences are apparent in winter and early spring when all farmlets show similar levels of deficit to each other. These regular periods of deficit coincided with pregnancy and early lactation (from May to September) when the energy requirements of all livestock classes were such that demand exceeded supply from the pasture growth and supplements.
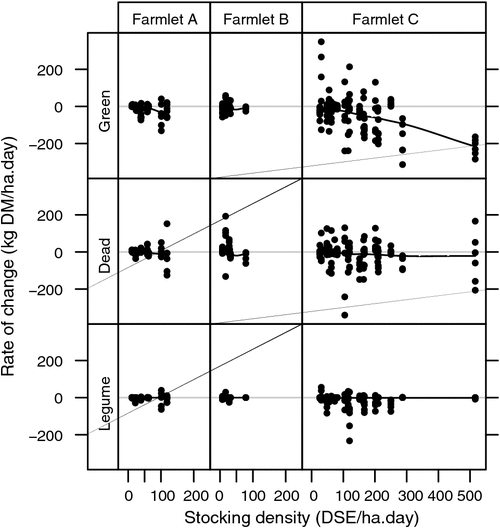
Rate of change in herbage mass
The relationship between the measured rate of change of green, dead and legume herbage fractions during grazing events and the stock density grazing those paddocks at those times is shown in Fig. 6. Whereas there appears to have been an approximate balance between pasture consumption and growth on farmlets A and B, there was a marked negative rate of change in green herbage on farmlet C, especially as the stocking density increased to high levels. It is also apparent that, compared with farmlets A and B, there were more instances recorded on farmlet C when the rate of change in the dead component was substantially negative suggesting that, in addition to the process of senescence, animals on that farmlet were at times likely to have consumed considerable amounts of the dead fraction resulting, presumably, in a lower quality diet. The small rate of change in legume herbage during grazing shows little difference between farmlets, which perhaps is related to the relatively low levels of legume herbage on all farmlets, which rarely exceeded 200 kg DM per ha (Fig. 2e). An exploratory analysis (results not shown), using a multinomial logit regression model with the typical farmlet B represented as the reference level, revealed that farmlets A and B were not significantly different in the rate of change of green herbage while that same rate of change on farmlet C was significantly more negative than that of farmlet B.
|
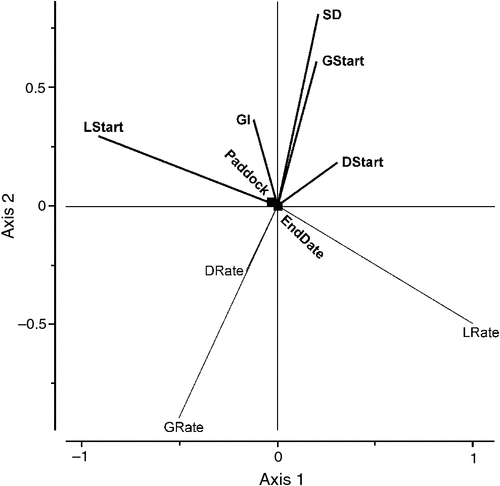
A multivariate Redundancy Analysis (Zuur et al. 2007) of factors affecting the response variables of rate of change of green, dead and legume herbage explained some 41% of the variation in the data with the most significant explanatory factors being, in order of declining importance, the starting legume herbage mass (LStart), stock density (SD), starting dead herbage mass (DStart), starting green herbage mass (GStart) (all P < 0.01) and growth index (GI), date (EndDate) and paddock (P < 0.05). The rate of change in legume herbage mass was strongly negatively correlated with starting levels of legume; a greater rate of change in the level of legume herbage was associated with lower amounts of legume, perhaps indicating that as legume levels declined, there would have been more selective grazing of that pasture component (Fig. 7). Also, both the rates of change of green and dead herbage mass were highly positively correlated with each other while each was negatively correlated with the starting levels of green and dead herbage. Both the rates of change of green and dead herbage were strongly negatively correlated with stock density and also with growth index. In contrast, rates of change of legume herbage were not correlated with either the green or dead rates of change.
|
Discussion
Matching the conflicting needs of pastures and animals in this whole-farmlet experiment was challenging, not only in terms of practical farmlet management, but also as information concerning supply and demand was not able to be assembled for all paddocks and subpaddocks and each animal mob until after the experiment ended. Nevertheless, this realistically reflects the situation which is common in grazing enterprises where decisions need to be taken in spite of the lack of detailed quantitative information on farms.
As described in a related paper by Donald et al. (2013), significant differences between farmlets were observed in potential pasture growth rates, assessed as NDVI in spring (September–October) of each year using Landsat satellite images. It has been reported in several related papers that, over time, large differences in animal production developed between farmlets. For example, over the latter 4 years of the experiment, animals on farmlets A and B recorded higher liveweights per head (Hinch et al. 2013a), fat scores (Hinch et al. 2013b) and wool production per head (Cottle et al. 2013), compared with farmlet C. This was in spite of the fact that the stocking rate on farmlet A increased substantially over time compared with the other two farmlets. Even though significant differences were not found from pasture growth measurements using grazing exclosure cages (Shakhane et al. 2013a), we contend that there must have been elevated pasture growth on farmlet A compared with the other two farmlets in order to sustain these higher levels of animal production and stocking rate without penalising per-head production levels.
It is clear that, at times, the pastures were grazed below the Prograze benchmarks (Bell 2003); no doubt this would have impacted considerably on animal performance and caused larger purchases of supplementary feed than would have occurred had benchmarks been adhered to. Once the amount of green herbage declines below 500 kg DM per ha, the grazing animal can reach the upper limit of the time it expends grazing each day, resulting in a substantially lower intake than that required for maintenance (Freer 1981). However, the level of intake is also affected by the quality of the feed on offer, with similar levels of animal production requiring less quantity of high quality feed, as observed in this experiment (Table 2) and as noted by Geenty and Rattray (1987) who pointed out that, in general, ME needs decline as the digestibility of the diet increases.
The decline of pasture digestibility observed as the pastures reached maturity over summer is consistent with the declines described by Arnold (1962) who reported that quality declined markedly once pasture plants had flowered. On the Central Tablelands of New South Wales, Holst et al. (2006) reported that low feed availability constrained livestock production from late autumn to early winter. This experiment was also consistent with the findings of Ayres et al. (2001) who reported that pastures on the Northern Tablelands of New South Wales tend to have three distinct phases: (i) spring with high quality green herbage, followed by (ii) secondary growth in summer–autumn with high herbage mass of moderate quality and (iii) a low growth phase over winter with low levels of green herbage but with high levels of digestibility, which results in a feed gap common in the area over the winter to early spring period.
The approach proposed by Kemp (1991) who defined the boundaries of an ‘envelope’ for pasture management in terms of forage herbage mass and percent legume, while useful, lacks some of the subtlety of the relationship between pasture supply and animal demand. The approach we have proposed here is that the quality and quantity of a pasture is best summarised as ME which, in turn, is the unit of measurement by which animal requirements can be expressed and thereby facilitate the calculation of the balance between supply and demand.
In spite of the lower level of intake required per animal on farmlet A, the total demand from all animal classes grazing on that farmlet increased substantially compared with those grazing on farmlets B and C, because of the higher stocking rates supported over time on farmlet A. It is clear that the ME demand of reproductive ewes and their progeny dominated the overall demand of livestock on each of the farmlets, especially when high numbers of twin lambs were born. As noted by Freer (1981), pregnancy and lactation bring about a large increase in energy demand, not only by the ewe but also by the lamb during lactation.
The partial net ME balance between pasture supply (comprising growth and supplements) and animal requirements fluctuated greatly between seasons. Most of the positive balances occurred over the spring to autumn period while the balance was most negative on all three farmlets during the autumn to early spring periods when pregnancy and lactation brought about large increases in demand. While animals would have consumed a considerable proportion of their diet from the standing herbage mass, we were not able to adequately measure intake and therefore did not take into account in our balance calculations the degree to which livestock consumed portions of the available herbage mass. No doubt this would have affected the absolute value of the balance results observed but we contend that it would probably not have affected the relative values of balance assessed for each of the farmlets. While the amount of carryover feed has been estimated through the use of spreadsheet models (Takahashi et al. 2011) this was not attempted as no adequate measurements of animal intake or pasture senescence were available to check any such estimates.
In general, the pattern and extent of the periods of feed deficit and surplus were similar across all three farmlets, confirming that none of the three farmlets was disadvantaged by management of supply and demand more than any other. Negative balances during winter suggest that excessive numbers of stock were kept on all farmlets for the conditions experienced, especially during the period of pregnancy and lactation. Grazing pressure affects the level of stress to which either or both pastures and animals are subjected in a way that stocking rate does not (Smetham 1975). These periods of severe defoliation would have affected the persistence of desirable pasture species as suggested by Smetham (1975) who noted the importance of managing grazing pressure so that neither over- nor undergrazing occurs. He suggested that, to ensure per-hectare animal production is not depressed, it is necessary to utilise no more than 65% of the herbage on offer at a single grazing. No doubt, at times, this level of utilisation was exceeded on all three farmlets during the experiment but as we did not measure utilisation, we were not able to quantify the extent to which this happened.
‘Overgrazing’ has been defined by Wilson and MacLeod (1991) to be a consequence of grazing that results in a decrease in the proportion of desirable species and a loss of animal productivity below the potential production for a particular site. Using this definition, at times overgrazing must have occurred on all three farmlets, at least to some extent. For example, per hectare animal production was lowest on farmlets B and C (Hinch et al. 2013a) while per-head production tended to be lowest on farmlet C. Although there was some decline in the desirable functional species group, sown perennial grasses, on both farmlets B and C, the decline was greater on farmlet B (Shakhane et al. 2013b). In the case of farmlet A, the level of sown perennial grasses was maintained over the duration of the experiment, but only with the assistance of considerable pasture renovation (a total of 71% of farmlet A was renovated over the duration of the experiment compared with a total 8% of the area of both farmlets B and C) (Scott et al. 2013). However, as the levels of per-head animal production on farmlets A and B were generally higher than on farmlet C, it may be deduced that the stocking density or ‘grazing pressure’ (Saul and Cayley 1992) exerted on farmlet C resulted in a greater level of nutritional stress on that farmlet’s animals than on either of the other farmlets. It is also noteworthy that sheep on farmlet C had reduced incidence of internal parasites than those on farmlets A or B, because of the short graze and long rest periods associated with this farmlet (Walkden-Brown et al. 2013).
As described by Hamilton et al. (1973), the ability for sheep to select a high quality diet is severely constrained once levels of green herbage drop below 550 kg DM per ha. Green herbage levels fell below this value on several occasions on all three farmlets (Shakhane et al. 2013a). The slightly lower demand of animals under the intensive rotational grazing treatment (farmlet C) compared with those under flexible rotational grazing (farmlet B) suggests that there was some restriction of diet selection because of the high stock density, which would have resulted in competition for the limited quantities of digestible green herbage. Under conditions where the rate of consumption by animals exceeds the growth rate of the pasture, in spite of the ability to selectively graze pastures, the quality of the pasture ingested declines from one day to the next (Arnold 1960). As shown by the increasing rate of decline of green herbage at high stocking densities, the conditions of grazing on farmlet C would have been most likely to cause a reduction in diet quality over the short grazing periods of several days duration. As noted in several related publications (Cottle et al. 2013; Hinch et al. 2013a, 2013b), per-head animal performance suffered under conditions where the choice of diet offered to the grazing animal was restricted, especially on farmlet C. This is consistent with the findings of Badgery et al. (2012) who noted that high grazing intensity can force animals to consume feed of lower quality.
This paper has demonstrated that it is feasible to quantify the changes in animal demand and feed supply over time in spite of the fact that the feed supply can fluctuate erratically because it is dependent on highly variable climatic conditions. It has been shown that the calculation of the ME demands of livestock can be calculated with a sufficient degree of precision, provided enough of the controlling factors are taken into account. The supply of ME from the pasture may also be able to be estimated for whole farms using Landsat satellite NDVI images, provided they are available regularly and frequently and are calibrated against reference plots. Consequently, ME offers the potential for a single ‘currency’ with which the balance between supply and demand can be quantified.
Increased value would be provided to livestock managers if the prospects of achieving a balance between supply and demand over future months could be calculated; this means that some form of modelling would be required. The whole-farm simulation model of a grazed sheep enterprise described by Cacho et al. (1995) may well provide a useful template as it not only considers the balance between pasture supply and animal demand in terms of ME, but it also takes into account many of the factors encountered in the Cicerone farmlet experiment, including the need to allow for flexibility in paddock subdivisions, pasture growth, fodder conservation, the movement of animal mobs between paddocks and of animals between mobs, animal growth and reproduction. Also, Barioni et al. (1999) have provided an example of the value of using a modelling approach based on a genetic algorithm to optimise grazing within whole-farm systems. There would of course be additional value if the risk associated with alternative management options could also be assessed as described by Cacho et al. (1999). Further discussion of the use of risk-efficient frontiers in relation to the optimum management of the Cicerone farmlets has been provided by Behrendt et al. (2006). Related papers by Behrendt et al. (2013a) and Behrendt et al. (2013b) report on modelling which was conducted using limited datasets from the Cicerone farmlet experiment to explore optimal management scenarios over extended periods.
These results have confirmed that balancing the nutrient needs of animals with a sufficient forage supply is a significant challenge. No doubt adjusting the livestock production cycle to best coincide with the seasonal forage cycle will more effectively utilise the available resources for animal performance while reducing the expense of supplementary feeds (Morley 1981; Nicol 1987). However, the increase in pasture allowance needed for ewes during the period leading up to joining is in conflict with the need to build up reserves of standing pasture for use when pasture growth is low during winter. The retention of an excessive number of non-replacement lambs during the period between weaning and joining has been shown to conflict with ewe nutrition at joining and can thereby reduce lambing percentages (Nicol 1987); this may have occurred on farmlet A at times when many more non-replacement weaners/hoggets were retained compared with the other farmlets.
In this current experiment, due to resource constraints, the detailed assessments of supply and demand ME were only assembled after the completion of the study and so, unfortunately, they were not available to inform the grazing decisions made within this experiment in a timely way. Ideally, these data could be made available in a way that would permit the calculated balances to be used to influence stocking rate and paddock movement decisions in ‘real time’.
Regular monitoring of animal performance such as growth rates of lambs, liveweight gains and fat scores of ewes allows an understanding of animal performance to be developed although, at times, measurements of changes beyond thresholds may become available too late for management decisions to be optimal. Frequent and timely calculation of the ME provided by the herbage on offer, pasture growth and supplement could assist in regular assessments of the balance between feed supply and animal demand. Had more regular calculations of the herbage ME supply and demand under different management practices of the Cicerone farmlets been feasible, any negative balances of each system’s match between supply and demand could have been confirmed, allowing corrective action to be taken promptly.
Further, with more timely forage assessment, accurate stock movement information and adequate knowledge of seasonal influences, the amount of forage required to support livestock could be calculated and compared with the amount and quality of forage available. Ideally, animal numbers (stocking rate) and more importantly daily ME needs of animals should be regulated to harvest the current year’s forage production without damaging future pasture growth and quality. Given the high level of satisfaction from livestock producers who have undertaken Prograze courses (Bell and Allan 2000), we suggest that advances in technology, which would provide more timely assessments of the balance between pasture supply and animal demand, would be welcomed by livestock producers. Although some farmers have considerable expertise in achieving a balance between feed supply and animal demand, greater improvements in feed planning would come about simply by having access to more rapid and timely assessments of changes in the feed supply (Gray et al. 2003).
Pasture growth is constrained at low levels of green herbage mass. Had the level of green herbage been able to be maintained at levels above 1000 or even 1500 kg green DM per ha, there would have been a substantial effect on both pasture growth rate and subsequent animal production. Willoughby (1959) noted the crucial role of green pasture in winter in supporting both increased sheep liveweight and wool production.
The lower performance (liveweight, fleece cut and wool quality) of animals grazing under intensive rotational grazing (farmlet C) compared with flexible grazing systems (A and B) indicates that, under the grazing management rules operated by the Cicerone Project, farmlet C did not perform as well as has been suggested in some of the literature on this topic (Savory and Parsons 1980; McCosker 2000). It is likely that, under the conditions of this experiment, the amount eaten by a grazing animal was limited by the management decisions relating to grazing duration and stocking density rather than the eating preference of the animal (Freer 1981). This view is supported by the data presented here concerning the rate of change in green herbage mass as it was affected most strongly at high stocking densities.
We conclude that the hypothesis that all three farmlets experienced similar levels and durations of negative nutritional balance was found to be true, supporting our assertion that the different managements imposed on each farmlet did not bias the comparisons made between them.
Given the extensive nature of most Australian grazing farms, we propose that assessments of changes in feed supply would be most effectively delivered by utilising regular satellite NDVI images (Donald et al. 2013) which, when combined with calculated ME needs of all mobs on a farm at any point in time, would enable energy balances to be calculated with greater speed and reliability. Bryant and Snow (2008) have highlighted the need to better understand the decision-making process of successful farmers within these complex grazed agroecosystems. The development of improved tools such as those described here would, in our opinion, be likely to be a profitable avenue for further research, especially if it were to be carried out in conjunction with skilled practising graziers who would ensure that the research products were practical and relevant.
Acknowledgements
The Cicerone Project was financially supported by Australian Wool Innovation, the Australian Sheep CRC and the University of New England with generous in-kind support from the University of New England, NSW Department of Primary Industries, CSIRO and NSW Technical and Further Education, and a veterinary consultant, Ms Betty Hall. The support provided by the farm manager, Justin Hoad, the Cicerone Executive Officer, Caroline Gaden, and the technical assistance of Mr Col Mulcahy is gratefully acknowledged. The guidance and spreadsheets provided by Dr Mike Freer of CSIRO Plant Industry are also gratefully acknowledged. Also, we are pleased to acknowledge the valuable guidance provided by Dr Keith Hutchinson, formerly of CSIRO Animal Production, regarding the importance of assessments of ME within grazed systems.
References
Anonymous (2012) EverGraze feed budget and rotation planner. Available at http://www.evergraze.com.au/tools.htm [Verified 8 October 2012]Arnold G (1960) Selective grazing by sheep of two forage species at different stages of growth. Australian Journal of Agricultural Research 11, 1026–1033.
| Selective grazing by sheep of two forage species at different stages of growth.Crossref | GoogleScholarGoogle Scholar |
Arnold G (1962) Effects of pasture maturity on the diet of sheep. Australian Journal of Agricultural Research 13, 701–706.
| Effects of pasture maturity on the diet of sheep.Crossref | GoogleScholarGoogle Scholar |
Ayres JF, Dicker RW, McPhee MJ, Turner AD, Murison RD, Kamphorst PG (2001) Post-weaning growth of cattle in northern New South Wales – 1. Grazing value of temperate perennial pasture grazed by cattle. Australian Journal of Experimental Agriculture 41, 959–969.
| Post-weaning growth of cattle in northern New South Wales – 1. Grazing value of temperate perennial pasture grazed by cattle.Crossref | GoogleScholarGoogle Scholar |
Badgery WB, Cranney P, Millar GD, Mitchell D, Behrendt K (2012) Intensive rotational grazing can improve profitability and environmental outcomes. In ‘Proceedings of the 27th annual conference of the Grassland Society of NSW Inc.’. Wagga Wagga. (Eds C Harris, G Lodge, C Waters) pp. 85–91. (The Grassland Society of NSW: Orange, NSW)
Barioni LG, Dake CKG, Parker WJ (1999) Optimizing rotational grazing in sheep management systems. Environment International 25, 819–825.
| Optimizing rotational grazing in sheep management systems.Crossref | GoogleScholarGoogle Scholar |
Behrendt K, Cacho O, Scott JM, Jones R (2006) Methodology for assessing optimal rates of pasture improvement in the high rainfall temperate pasture zone. Australian Journal of Experimental Agriculture 46, 845–849.
| Methodology for assessing optimal rates of pasture improvement in the high rainfall temperate pasture zone.Crossref | GoogleScholarGoogle Scholar |
Behrendt K, Cacho O, Scott JM, Jones R (2013a) Optimising pasture and grazing management decisions on the Cicerone Project farmlets over variable time horizons. Animal Production Science 53, 796–805.
| Optimising pasture and grazing management decisions on the Cicerone Project farmlets over variable time horizons.Crossref | GoogleScholarGoogle Scholar |
Behrendt K, Scott JM, Cacho O, Jones R (2013b) Simulating the impact of fertiliser strategies and prices on the economics of developing and managing the Cicerone Project farmlets under climatic uncertainty. Animal Production Science 53, 806–816.
| Simulating the impact of fertiliser strategies and prices on the economics of developing and managing the Cicerone Project farmlets under climatic uncertainty.Crossref | GoogleScholarGoogle Scholar |
Behrendt K, Scott JM, Mackay DF, Murison R (2013c) Comparing the climate experienced during the Cicerone farmlet experiment against the climatic record. Animal Production Science 53, 658–669.
| Comparing the climate experienced during the Cicerone farmlet experiment against the climatic record.Crossref | GoogleScholarGoogle Scholar |
Bell AK (Ed.) (2003) ‘PROGRAZE manual.’ (NSW DPI, Orange NSW, and Meat and Livestock Australia: Sydney)
Bell A (2007) ‘Measuring herbage mass – the median quadrat technique.’ (NSW Department of Primary Industries: Tamworth, NSW) Available at http://www.dpi.nsw.gov.au/agriculture/livestock/nutrition/feeds/herbage-mass-median-quadrat-technique/measuring-herbage-mass-the-median-quadrat-technique.pdf [Verified 1 July 2012]
Bell AK, Allan CJ (2000) PROGRAZE – an extension package in grazing and pasture management. Australian Journal of Experimental Agriculture 40, 325–330.
| PROGRAZE – an extension package in grazing and pasture management.Crossref | GoogleScholarGoogle Scholar |
Bryant JR, Snow VO (2008) Modelling pastoral farm agro‐ecosystems: a review. New Zealand Journal of Agricultural Research 51, 349–363.
| Modelling pastoral farm agro‐ecosystems: a review.Crossref | GoogleScholarGoogle Scholar |
Cacho OJ, Finlayson JD, Bywater AC (1995) A simulation model of grazing sheep. 2. Whole farm model. Agricultural Systems 48, 27–50.
| A simulation model of grazing sheep. 2. Whole farm model.Crossref | GoogleScholarGoogle Scholar |
Cacho OJ, Bywater AC, Dillon JL (1999) Assessment of production risk in grazing models. Agricultural Systems 60, 87–98.
| Assessment of production risk in grazing models.Crossref | GoogleScholarGoogle Scholar |
Chapman DF, McCaskill MR, Quigley PE, Thompson AN, Graham JF, Borg D, Lamb J, Kearney G, Saul GR, Clark SG (2003) Effects of grazing method and fertiliser inputs on the productivity and sustainability of phalaris-based pastures in Western Victoria. Australian Journal of Experimental Agriculture 43, 785–798.
| Effects of grazing method and fertiliser inputs on the productivity and sustainability of phalaris-based pastures in Western Victoria.Crossref | GoogleScholarGoogle Scholar |
Clark DA (2010) Contribution of farmlet scale research in New Zealand and Australia to improved dairy farming systems. In ‘Proceedings of the 4th Australasian dairy science symposium’. Lincoln University, Christchurch, New Zealand. (Eds GR Edwards, RH Bryant) (Caxton Press: Christchurch, New Zealand) Available at http://www.sciquest.org.nz/node/69343 [Verified 23 May 2013]
Cottle D, Gaden CA, Hoad J, Lance D, Smith J, Scott JM (2013) The effects of pasture inputs and intensive rotational grazing on superfine wool production, quality and income. Animal Production Science 53, 750–764.
| The effects of pasture inputs and intensive rotational grazing on superfine wool production, quality and income.Crossref | GoogleScholarGoogle Scholar |
Donald GE, Scott JM, Vickery PJ (2013) Satellite derived evidence of whole farmlet and paddock responses to management and climate. Animal Production Science 53, 699–710.
| Satellite derived evidence of whole farmlet and paddock responses to management and climate.Crossref | GoogleScholarGoogle Scholar |
Donnelly JR, Moore AD, Freer M (1997) Grazplan – decision support systems for australian grazing enterprises. 1. Overview of the Grazplan project, and a description of the metaccess and lambalive dss. Agricultural Systems 54, 57–76.
| Grazplan – decision support systems for australian grazing enterprises. 1. Overview of the Grazplan project, and a description of the metaccess and lambalive dss.Crossref | GoogleScholarGoogle Scholar |
Duru M, Bergez JE, Delaby L, Justes E, Theau JP, Viégas J (2007) A spreadsheet model for developing field indicators and grazing management tools to meet environmental and production targets for dairy farms. Journal of Environmental Management 82, 207–220.
| A spreadsheet model for developing field indicators and grazing management tools to meet environmental and production targets for dairy farms.Crossref | GoogleScholarGoogle Scholar | 16684587PubMed |
Freer M (1981) The control of food intake by grazing animals. In ‘Grazing animals’. (Ed. FHW Morley) pp. 105–124. (Elsevier: Amsterdam)
Freer M (2009) ME_Required spreadsheet program. (CSIRO Publishing: Melbourne) Available at http://www.grazplan.csiro.au/?q=node/18 [Verified 24 May 2013]
Freer M, Moore AD, Donnelly JR (1997) GrazPlan: decision support systems for Australian grazing enterprises. II. The animal biology model for feed intake, production and reproduction and the GrazFeed DSS. Agricultural Systems 54, 77–126.
| GrazPlan: decision support systems for Australian grazing enterprises. II. The animal biology model for feed intake, production and reproduction and the GrazFeed DSS.Crossref | GoogleScholarGoogle Scholar |
Geenty KG, Rattray PV (1987) The energy requirements of grazing sheep and cattle. In ‘Livestock feeding on pasture’. (Ed. AM Nicol) pp. 39–53. (New Zealand Society of Animal Production: Hamilton, New Zealand)
Gray DI, Parker WJ, Kemp EA, Kemp PD, Brookes IM, Horne D, Kenyon PR, Matthew C, Morris ST, Reid JI, Valentine I (2003) Feed planning – alternative approaches used by farmers. In ‘Proceedings of the New Zealand Grassland Association, Vol. 65’. pp. 211–217. (New Zealand Society of Animal Production: Palmerston North, New Zealand)
Guppy CN, Edwards C, Blair GJ, Scott JM (2013) Whole-farm management of soil nutrients drives productive grazing systems: the Cicerone farmlet experiment confirms earlier research. Animal Production Science 53, 649–657.
| Whole-farm management of soil nutrients drives productive grazing systems: the Cicerone farmlet experiment confirms earlier research.Crossref | GoogleScholarGoogle Scholar |
Hamilton B, Hutchinson K, Annis P, Donnelly J (1973) Relationships between the diet selected by grazing sheep and the herbage on offer. Australian Journal of Agricultural Research 24, 271–277.
| Relationships between the diet selected by grazing sheep and the herbage on offer.Crossref | GoogleScholarGoogle Scholar |
Hinch GN, Hoad J, Lollback M, Hatcher S, Marchant R, Colvin A, Scott JM, Mackay D (2013a) Livestock weights in response to three whole-farmlet management systems. Animal Production Science 53, 727–739.
| Livestock weights in response to three whole-farmlet management systems.Crossref | GoogleScholarGoogle Scholar |
Hinch GN, Lollback M, Hatcher S, Hoad J, Marchant R, Mackay DF, Scott JM (2013b) Effects of three whole-farmlet management systems on Merino ewe fat scores and reproduction. Animal Production Science 53, 740–749.
| Effects of three whole-farmlet management systems on Merino ewe fat scores and reproduction.Crossref | GoogleScholarGoogle Scholar |
Hodgson J (1990) Seasonality of herbage supply and feed requirements. In ‘Grazing management: science into practice’. (Ed. J Hodgson) pp. 143–156. (Longman Scientific & Technical: Harlow, England)
Holst PJ, Stanley DF, Millar GD, Radburn A, Michalk DL, Dowling PM, Van de Ven R, Priest SM, Kemp DR, King WM, Tarleton JA (2006) Sustainable grazing systems for the Central Tablelands of New South Wales. 3. Animal production response to pasture type and management. Australian Journal of Experimental Agriculture 46, 471–482.
| Sustainable grazing systems for the Central Tablelands of New South Wales. 3. Animal production response to pasture type and management.Crossref | GoogleScholarGoogle Scholar |
Johnson IR, Lodge GM, White RE (2003) The Sustainable Grazing Systems Pasture Model: description, philosophy and application to the SGS national experiment. Australian Journal of Experimental Agriculture 43, 711–728.
| The Sustainable Grazing Systems Pasture Model: description, philosophy and application to the SGS national experiment.Crossref | GoogleScholarGoogle Scholar |
Kaine G, Doyle B, Sutherland H, Scott JM (2013) Surveying the management practices and research needs of graziers in the New England region of New South Wales. Animal Production Science 53, 602–609.
| Surveying the management practices and research needs of graziers in the New England region of New South Wales.Crossref | GoogleScholarGoogle Scholar |
Kemp D (1991) Defining the boundaries and manipulating the system. In ‘Proceedings of the sixth annual conference of the Grasslands Society of NSW’. (Ed. D Michalk) pp. 24–30. (Grasslands Society of NSW: Orange, NSW)
Kemp DR (1994) Grazing management – a biological approach. In ‘Riverina Outlook conference’. Wagga Wagga. (The Regional Institute Ltd: Gosford, NSW) Available at http://www.regional.org.au/au/roc/1994/roc1994049.htm [Verified 24 May 2013]
Kemp DR, Michalk DL, Virgona JM (2000) Towards more sustainable pastures: lessons learnt. Australian Journal of Experimental Agriculture 40, 343–356.
| Towards more sustainable pastures: lessons learnt.Crossref | GoogleScholarGoogle Scholar |
Lambert MG, Clark DA, Litherland AJ (2004) Advances in pasture management for animal productivity and health. New Zealand Veterinary Journal 52, 311–319.
| Advances in pasture management for animal productivity and health.Crossref | GoogleScholarGoogle Scholar | 15768131PubMed |
Mason WK, Lamb K, Russell B (2003) The Sustainability Grazing Systems Program: new solutions for livestock producers. Australian Journal of Experimental Agriculture 43, 663–672.
| The Sustainability Grazing Systems Program: new solutions for livestock producers.Crossref | GoogleScholarGoogle Scholar |
Maxwell TJ (1990) Plant-animal interactions in northern temperate sown grasslands and semi-natural vegetation. In ‘Systems theory applied to agriculture and the food chain’. (Eds J Jones, P Street) pp. 23–60. (Elsevier Applied Science: London)
McCosker T (2000) Cell grazing – the first 10 years in Australia. Tropical Grasslands 34, 207–218.
Milligan KE, Brookes IM, Thompson KF (1987) Feed planning on pasture. In ‘Livestock feeding on pasture’. (Ed. AM Nicol) pp. 75–88. (New Zealand Society of Animal Production: Hamilton)
Moore AD, Donnelly JR, Freer M (1997) GRAZPLAN: decision support systems for Australian grazing enterprises – III. Pasture growth and soil moisture submodels, and the GrassGro DSS. Agricultural Systems 55, 535–582.
| GRAZPLAN: decision support systems for Australian grazing enterprises – III. Pasture growth and soil moisture submodels, and the GrassGro DSS.Crossref | GoogleScholarGoogle Scholar |
Morley FHW (1981) Management of grazing systems. In ‘Grazing animals’. (Ed. FHW Morley) pp. 379–400. (Elsevier: Melbourne)
Morley FHW, Spedding CRW (1968) Agricultural systems and grazing experiments. Herbage Abstracts 38, 279–287.
Murison R, Scott JM (2013) Statistical methodologies for drawing causal inference from an unreplicated farmlet experiment conducted by the Cicerone Project. Animal Production Science 53, 643–648.
| Statistical methodologies for drawing causal inference from an unreplicated farmlet experiment conducted by the Cicerone Project.Crossref | GoogleScholarGoogle Scholar |
Murtagh G (1975) The need for alternative techniques of productivity assessment in grazing experiments. Tropical Grasslands 9, 151–158.
Nicol AM (Ed.) (1987) ‘Livestock feeding on pasture.’ (New Zealand Society of Animal Production: Hamilton)
R Development Core Team (2011) ‘R: a language and environment for statistical computing.’ (R Foundation for Statistical Computing: Vienna) Available at http://www.R-project.org [Verified 24 May 2013]
Saul GR, Cayley JWD (1992) Appropriate animal stocking regimes for pasture comparisons. In ‘Proceedings of the Australian Society of Animal Production. Vol. 19’. p. 235. (Australian Society of Animal Production: Melbourne)
Savory A, Parsons SD (1980) The Savory Grazing Method. Rangelands 2, 234–237.
Scott JM, Gaden CA, Edwards C, Paull DR, Marchant R, Hoad J, Sutherland H, Coventry T, Dutton P (2013) Selection of experimental treatments, methods used and evolution of management guidelines for comparing and measuring three grazed farmlet systems. Animal Production Science 53, 628–642.
| Selection of experimental treatments, methods used and evolution of management guidelines for comparing and measuring three grazed farmlet systems.Crossref | GoogleScholarGoogle Scholar |
Shakhane LM (2008) Investigations of pasture and grazing management within farmlet systems on the Northern Tablelands of New South Wales. PhD thesis, University of New England, Armidale.
Shakhane LM, Mulcahy C, Scott JM, Hinch GN, Donald GE, Mackay DF (2013a) Pasture herbage mass, quality and growth in response to three whole-farmlet management systems. Animal Production Science 53, 685–698.
| Pasture herbage mass, quality and growth in response to three whole-farmlet management systems.Crossref | GoogleScholarGoogle Scholar |
Shakhane LM, Scott JM, Murison R, Mulcahy C, Hinch GN, Morrow A, Mackay DF (2013b) Changes in botanical composition on three farmlets subjected to different pasture and grazing management strategies. Animal Production Science 53, 670–684.
| Changes in botanical composition on three farmlets subjected to different pasture and grazing management strategies.Crossref | GoogleScholarGoogle Scholar |
Smetham ML (1975) The influence of herbage utilisation on pasture production and animal performance. In ‘Proceedings of the New Zealand Grassland Association’. pp. 91–103. (New Zealand Grassland Association: Hastings, New Zealand)
Standing Committee on Agriculture (1990) ‘Feedings standards for Australian livestock: ruminants.’ (CSIRO: Melbourne)
Stuth JW, Hamilton WT, Conner R (2002) Insights in development and deployment of the GLA and NUTBAL decision support systems for grazinglands. Agricultural Systems 74, 99–113.
| Insights in development and deployment of the GLA and NUTBAL decision support systems for grazinglands.Crossref | GoogleScholarGoogle Scholar |
Takahashi T, Jones R, Kemp DR (2011) Steady-state modelling for better understanding of current livestock production systems and for exploring optimal short-term strategies. In ‘Development of sustainable livestock systems on grasslands in north-western China’. (Eds DR Kemp, DL Michalk) pp. 26–35. (Australian Centre for International Agricultural Research: Canberra)
Vizard AL, Foot JZ (1993) Animal and pasture maintenance, a partnership. In ‘Pasture management: technology for the 21st century’. (Eds DR Kemp, DL Michalk) pp. 100–113. (CSIRO: Melbourne)
Walkden-Brown SW, Colvin AF, Hall E, Knox MR, Mackay DF, Scott JM (2013) Grazing systems and worm control in sheep: a long-term case study involving three management systems with analysis of factors influencing faecal worm egg count. Animal Production Science 53, 765–779.
| Grazing systems and worm control in sheep: a long-term case study involving three management systems with analysis of factors influencing faecal worm egg count.Crossref | GoogleScholarGoogle Scholar |
Waller RA, Sale PWG, Saul GR, Kearney GA (2001) Tactical versus continuous stocking in perennial ryegrass-subterranean clover pastures grazed by sheep in south-western Victoria – 3. Herbage nutritive characteristics and animal production. Australian Journal of Experimental Agriculture 41, 1121–1131.
| Tactical versus continuous stocking in perennial ryegrass-subterranean clover pastures grazed by sheep in south-western Victoria – 3. Herbage nutritive characteristics and animal production.Crossref | GoogleScholarGoogle Scholar |
Willoughby W (1959) Limitations to animal production imposed by seasonal fluctuations in pasture and by management procedures. Australian Journal of Agricultural Research 10, 248–268.
| Limitations to animal production imposed by seasonal fluctuations in pasture and by management procedures.Crossref | GoogleScholarGoogle Scholar |
Wilson AD, MacLeod ND (1991) Overgrazing: present or absent? Journal of Range Management 44, 475–482.
| Overgrazing: present or absent?Crossref | GoogleScholarGoogle Scholar |
Yee TW (2012) VGAM: vector generalized linear and additive models. Available at http://CRAN.R-project.org/package=VGAM [Verified 7 May 2013]
Zuur AF, Ieno EN, Smith GM (2007) ‘Analysing ecological data.’ (Springer: New York)