

Ultra-small SNP panels to uniquely identify individuals in thousands of samples
S. Dominik A F , C. J. Duff B , A. I. Byrne B , H. Daetwyler C D and A. Reverter E
A CSIRO Agriculture and Food, FD McMasters Laboratories, 9308 New England Highway, Armidale,NSW 2350, Australia.
B Angus Australia, 86 Glen Innes Road, Armidale, NSW, 2350, Australia.
C Agriculture Victoria, AgriBio Centre, 5 Ring Road, Bundoora, Vic. 3083, Australia.
D La Trobe University, Plenty Road and Kingsbury Drive, Bundoora, Vic. 3083, Australia.
E CSIRO Agriculture and Food, Queensland Bioprecinct, 306 Carmody Road, St Lucia, Qld 4067, Australia.
F Corresponding author. Email: sonja.dominik@csiro.au
Animal Production Science 61(18) 1796-1800 https://doi.org/10.1071/AN21123
Submitted: 5 March 2021 Accepted: 29 April 2021 Published: 16 July 2021
Journal compilation © CSIRO 2021 Open Access CC BY-NC-ND
Abstract
Context: Genomic profiles are the only information source that can uniquely identify an individual but have not yet been strongly considered in the context of paddock to plate traceability due to the lack of value proposition.
Aim: The aim of this study was to define the minimum number of single nucleotide polymorphisms (SNP) required to distinguish a unique genotype profile for each individual sample within a large given population. At the same time, ad hoc approaches were explored to reduce SNP density, and therefore, the size of the dataset to improve computing efficiency and storage requirements while maintaining informativeness to distinguish individuals.
Methods: Data for this study included two datasets. One included 78 411 high-density SNP genotypes from commercial Angus cattle and the other 2107 from a research data (1000-bull genome data). In a stepwise approach, different-size SNP panels were explored, with the last step being a successive removal resulting in the smallest set of SNPs that still produced the maximum number of unique genotypes.
Key results: First study that has demonstrated for large datasets, that ultra-small SNP panels with 20–23 SNPs can generate unique genotypes for up to ~80 000 individuals, allowing for 100% matching accuracy.
Conclusions: Ultra-small SNP panels could provide an efficient method to approach the large-scale task of the traceability of beef products through the beef supply chain.
Implications: Genomic tools could enhance supply-chain traceability.
Keywords: supply-chain traceability, provenance, genomics, beef.
Introduction
A reliable traceability system for animals and meat products can identify individuals and processed products along with their origin throughout the supply chain, from the farm-gate to the consumer (McKean 2001), and facilitate food safety and quality assurance to enhance consumer confidence (Nicoloso et al. 2013). For meat traceability systems, radio frequency identification, genomic information and fingerprints of isotopes, and mineral and organic components are all methods that enable the identification of individual animals and authentication of origin (Zhao et al. 2020). Each approach has its unique limitations in terms of practicality and reliability (Zhao et al. 2020).
Genomic information is one application that can be used from paddock to plate traceability and it is the only tag-less approach that can link a piece of meat to an individual with high accuracy. Although it is unlikely to be used as a routine tool for track and trace due to the cost and logistics of testing, genomic information would complement paper-based or electronic radio frequency identification records that track the movement of animals through the supply chain and could verify the identity of an individual or piece of meat at any point, if required. In combination with fingerprints of isotopes, minerals and organic compounds, product origin can be authenticated from region to farm level and narrowed down all the way to the animal level. The advantage of using genomic information is that in addition to tracing animals through the supply chain, commercial carcass records could be linked into genetic evaluation for selection purposes, which might justify the cost of genotyping and analysis.
Short-sequence repeats and single-nucleotide polymorphisms (SNPs) have been most commonly explore for traceability purposes (Zhao et al. 2020). Single nucleotide polymorphisms are mostly biallelic and are, therefore, individually less informative than are short-sequence repeats, which present a greater allelic diversity. However, SNPs are abundant throughout the genome and have become the most commonly used genetic marker in livestock applications due to their automated genotyping. A small number of SNPs can provide a large amount of genomic information to distinguish individuals. With one SNP, three unique genotype profiles are possible (AA, AB, BB or codified 0, 1, 2) and with n number of SNPs, 3n unique profiles are possible. So, with 20 SNPs with common alleles it should be possible, albeit incredibly unlikely, to generate 320 = 3 486 784 401 unique genotype profiles. Theoretically, this would be sufficient to uniquely describe every individual in the Australian cattle population, which was in 2017–2018 ~28 million head (Australian Bureau of Statistics 2019).
A technical problem of high-density genotype data on large numbers of individuals is the computing time to mine or manipulate the data and perform basic queries due to the size of the files. Codified as (0,1,2) and without spaces, a file with genotypes of 100 000 animals across 50K SNPs will take 5 GB of memory. Working with a file of that size is complex and time-consuming.
The objective of the present study was to establish the smallest possible set of SNP markers from high-density genotypes of a given population that yields a unique genotype profile for each individual sample. This is equivalent to assessing on the basis of only a small set of SNPs, with 100% accuracy, whether a given unique individual is present in a database. At the same time, it is explored in ad hoc approaches how the dataset can be reduced in size for efficient file manipulation, while maintaining informativeness of the SNP subset. The discussion elaborates on the potential application of a genomic tool for supply chain traceability. The objective was to find the minimum number of SNPs required to establish unique genotype profiles for all animals in a specific population. Approaches to reduce the number of SNPs to make the procedures computationally more efficient and to finally yield a small subset of SNPs for unique identification.
Materials and methods
Two datasets of SNP genotypes were used for the study, a research dataset, namely the 1000-bull genome dataset, and a commercial Angus dataset. The approach to arrive at the minimum number of SNPs was somewhat different because the research dataset was multi-breed, whereas the commercial dataset was from one breed only.
1000-bull genome data
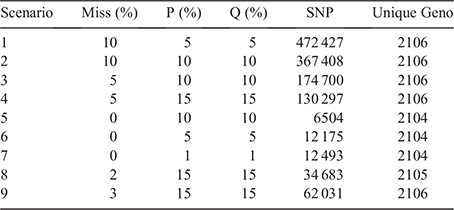
The first dataset was a research dataset, which was Run 7 of the ‘1000 Bull Genome Project’ (Hayes and Daetwyler 2019). It provided a genetically heterogeneous dataset, with multiple breeds and cross-bred animals. The full dataset contained 3817 animals, but after selecting only breeds with at least 20 animals, and individuals with genome sequence coverage of at least 5× and heterozygosity of at least 2.5%, a total of 2107 cattle from 17 of the original 172 breeds remained (Reverter et al. 2020). After removal of one repeat record, 2106 animals remained in the dataset for analysis. For each animal, a total of 40 525 757 SNP genotypes was available. To reduce the linkage disequilibrium, only every 10th SNP was included and only if they had <5% missing genotypes and a minor allele frequency of >5% (Reverter et al. 2020). This greatly reduced the number of SNPs, resulting in a final dataset of 1 001 234 informative SNPs for the purpose of the study. After computing summary statistics for the 1 001 234 SNPs across the 2106 animals, a first step aimed at further rapid reduction of SNPs that are still informative to generate 2106 unique genotype profiles, which would also reduce the computing time required to process the data. Nine scenarios with different combinations for thresholds for the number of missing genotypes (0, 2%, 3%, 5% and 10%), and frequency of Alleles A (P) and B (Q; 1%, 5%, 10%, 15% for both), were applied (Table 1). For example, Scenario 1 applied 10% for the number of missing genotypes and 5% for P and Q, whereas Scenario 2 applied 10% for all three criteria. The scenario that yielded the minimum number of SNPs and maximum unique genotype profiles created the dataset of 62 031 SNPs for use in the following step.
|
In the second step, the average euclidean distance (AED) of allele frequencies was calculated across the 62 031 SNPs and 17 breeds. The AED is commonly used to describe spatial distances but can also be applied to describe genetic distance and serve as a measure of SNP across-breed informativeness. We used the AED of allele frequencies among the 17 breeds and then averaged across all possible breed pairs:
where s indicates the SNP investigated (s = 1–62031); B = 17 (number of breeds) and fjs indicates the frequency of the second allele of the sth SNP in the jth breed in the population; fj’s indicates the frequency of the second allele of the sth SNP in the second breed of the pair that is being compared.
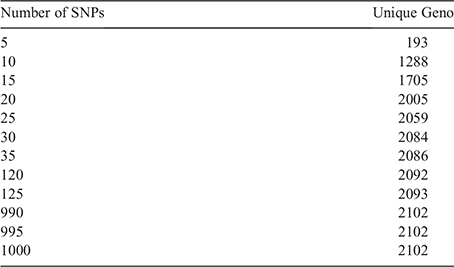
From the 62 031 SNPs, based on maximum AED and approximately the same distance (equidistance) across the genome, the ‘adequacy’ of 200 SNP panels of an increasing density from 5 to 1000 was explored, wherein ‘adequacy’ was defined in terms of how many unique genotype profiles they generate. The maximum number of unique genotypes that potentially can be achieved is equal to the number of animals in the dataset (n = 2106), assuming there are no clones or monozygotic twins in the dataset. None of the panels resulted in the required 2106 genotypes. Hence, in the third step, 1000 random panels, each with 35, 135, 430, 675, 1000, 1500 and 2000 SNPs, were explored. The panel sizes represent nominal proportions of the 2106 SNPs that have resulted from previous searches of the 1 001 234 SNPs.
As the last step, the SNPs from a random panel that generated 2106 unique genotype profiles were subjected to a successive reduction of SNPs. This means that the first SNP was removed. If the remaining SNPs still produced 2106 unique genotype profiles, the SNP was removed, and the next SNP tested. If the number of unique genotype profiles reduced with the removal of a SNP, the SNP remained in the data.
Australian Angus dataset
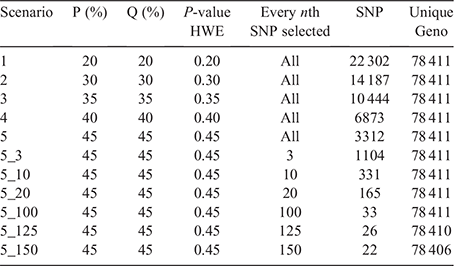
The second dataset was an industry dataset obtained from Angus Australia containing only Angus cattle. The data included imputed genotypes for 45 364 SNPs scattered across all the 29 autosomal chromosomes of 78 411 Australian Angus cattle. Genotype data for imputation originated from different density chips. The data from all chips were combined to represent the equivalent of a medium-density chip as a reference panel of 49 754 animals (Aliloo and Clark 2021). Imputed genotypes for individuals from a 10-fold cross-validation using the real genotypes as reference were correlated with real genotypes to obtain the imputation accuracy, which averaged 0.9878 across all animals (Aliloo and Clark 2021). For the Australian Angus data, AED metrics were not applied, since all animals originated from a single breed. It could have been applied across herds, but the minimum record requirements would have reduced the number of herds. Hence, after running summary statistics, the first filtering step of the 45 364 SNPs was based on filters that were imposed on P, Q and Hardy–Weinberg equilibrium (HWE). There were no missing genotypes because the dataset was imputed. Five threshold scenarios were investigated, excluding SNPs for all three characteristics, P, Q and HWE, starting at 0.20 and increasing to 0.45 in incremental steps of 0.05. At each step, the number of unique genotype profiles was established. The potential maximum number of genotypes is 78 411, which equals the number of animals in the dataset. The reduction of SNPs on the basis of thresholds for P, Q and HWE increased the informativeness of the remaining SNPs and, at the same time, achieved greater computational efficiency through a smaller file size.
After arriving at 0.45 for P and Q, further reductions in SNP numbers were achieved by selecting subsets of SNPs at regular intervals, ranging from every 3rd to every 150th SNP. At each reduction, the number of unique genotype profiles was established, and reductions were continued if 78 411 unique genotype profiles remained. The smallest subset of SNPs from this step was subjected to the last reduction step.
As the last step, the remaining SNPs underwent a successive reduction, using the same procedure that was applied to the 1000-bull genome data. One SNP was removed at a time. If the remaining SNP produced 78 411 unique genotype profiles, the SNP was excluded, if the number of unique genotype profiles reduced, the SNP was kept in the data. The successive reduction was also undertaken backwards, starting at the other end of the file.
Results and discussion
1000-bull genome data
The initial analytical steps had two purposes; the first one was to explore approaches to understand the possible sizes of SNP panels for uniqueness and, the second to reduce the original number of over 1 million SNPs to improve the computational efficiency of the analytical processes. Applying maximum frequency thresholds of 15% for P and Q substantially reduced the number of SNPs from 1 million to 62 031 (or ~95% reduction; Table 1, Scenario 9). Applying a zero threshold on missing genotypes caused an even greater reduction, but did not yield the envisaged 2106 unique genotypes (Table 1, Scenarios 5–7). The reduced number of 62 031 SNPs from Scenario 9 provided the genotype data for the next steps.
From the 62 031 SNPs, the SNP panels of sizes of 5–1000 SNPs, selected on equidistance and maximum AED, were explored for their ability to generate maximum numbers of unique genotypes. The combination of maximum AED and equal spacing provided a good guide as to how small the ‘desired’ panel could be. For instance, 2086 of 2106 possible unique genotype profiles (99%) were obtained with 35 SNPs. This percentage increased to 99.5% and 99.75% with 135 and 430 SNPs respectively. Only one sample run of SNPs was available for each panel, and not even 1000 SNPs yielded the 2106 unique genotypes required to represent the full complement of unique genotypes in the population (Table 2).
|
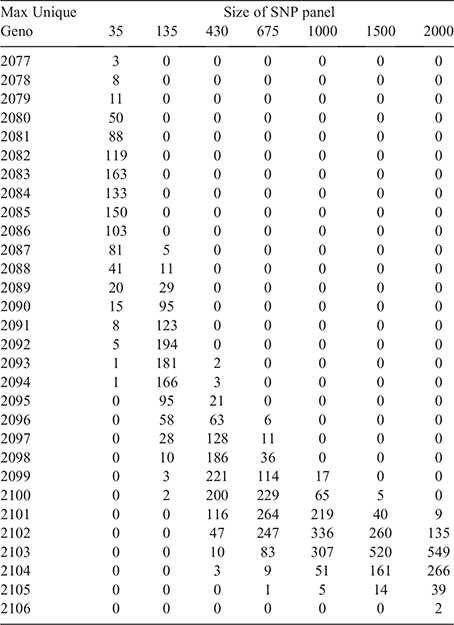
In the next step, 1000 repetitions of randomly drawing 35, 135, 430, 675, 1000, 1500 and 2000 SNPs from the 62 031-SNP dataset were investigated. Only two instances for panels with 2000 SNPs yielded 2106 unique genotype profiles (Table 3). These two instances are subsequently referred to as Data2000_1 and Data2000_2.
|
The two datasets of 2000 SNPs that yielded 2106 unique genotype profiles (Data2000_1 & Data2000_2) were further reduced through the successive removal of SNPs. For Data2000_1, the successive reduction approach yielded a subset of only 20 SNPs that still produced 2106 unique genotype profiles. For Data2000_2, the full complement of 2106 unique genotype profiles was achieved with 23 SNPs after successive reduction. Just by chance, it was quite likely that the two datasets were already subsets of different SNPs; therefore, the successive reduction yielded different subsets of SNPs, as indicated by the SNP ID.
Australian Angus data
The genotype and allele frequencies of the Angus population were in HWE. A reduction of the full 45 364 SNP data to 3312 SNPs could be achieved through imposing a filtering threshold of 45% for P, Q and HWE (Table 4). Applying maximum thresholds still produced the maximum number of 78 411 unique genotypes. Further reductions were achieved by selecting subsets of SNPs. When every 100th SNP was selected, a subset of 33 SNPs still generated 78 411 unique genotype profiles.
|
The resulting 33 SNPs were then subjected to a step of forward and backward successive removal of SNPs and the subset could be further reduced to 21 SNPs. Coincidentally, forward and backward successive removal resulted in the same number of SNPs. Eleven SNPs were the same, because the initial panel to undergo the successive removal only contained 33 SNPs.
The present study demonstrated for the first time that an ultra-small panel of ~20 SNPs can generate unique genotype profiles for all individuals in genetically heterogeneous data of 2106 animals and in a commercial dataset of nearly 80 000 purebred Australian Angus cattle. Previous studies in cattle, goats and sheep have shown that a small number of SNPs ranging from 5 to 48 markers can distinguish individuals with a high accuracy (Heaton et al. 2002; Werner et al. 2004; Goffaux et al. 2005; Allen et al. 2010; Zhao et al. 2017). However, none of the studies achieved 100% matching probability because genetic markers were pre-selected from published literature and then validated in the experimental samples. The present study here has utilised a different approach by mining existing high-density SNP datasets for a minimum set of SNPs that still provides unique genotypes for all individuals and therefore 100% matching probability. A simulation study evaluated that at least eight SNPs are required to obtain a 99% probability that none of the samples would be erroneously matched, and with 25 SNPs, a probability of <1% for a match between any of five million individuals was achieved (Weller et al. 2006). They never used real data. However, while the SNP set identified works well in the current set of genotypes, it would need to be re-evaluated to identify animals unambiguously when genotypes are added. In particular, because the present study used imputed genotypes (Aliloo and Clark 2021), which means that the empirical approach used in the study to identify the SNPs could have resulted in imputed SNPs as part of the ultra-small SNP panel. However, the present study was exploratory and the aim was not to establish a set of SNPs that would be commercially applicable.
The approach taken in the study is plausible when considering the potential application in a traceability system. On one end, a reference database of individual genotypes of all slaughtered cattle is required. Ideally, the genotypes are collected early in life and with reasonable density, so that value can be added through multiple uses, for example, management decisions and informed sire selection, in addition to the use for traceability. However, a sample for genotyping could be taken at any time while the animal can still be identified, and the genotype linked to the animal identification. Lower-density SNP panels could be used for traceability and might still be useful for parentage and breed composition, but might compromise the opportunity to add the data to the genetic evaluation.
At the other end, a genomic tool is required that can trace the origin of a cut of meat and match the sample to a genomic profile in the reference database. At this point, low-density SNP panels or even alternative technologies would be envisaged because the only purpose is to match the sample. This panel could be created from the genotype information in the existing reference database, as it was in the present study based on the existing SNP data files and was applicable only to the population under investigation, which provides a clear limitation for broad applicability, but a potential source of intellectual property through branding. In many cases, the relevant SNPs most likely would need to be re-evaluated with a growing population of genotypes.
Admittedly, the numerical approach developed here to achieve the ultra-small SNP panel was ad hoc and simple in nature, when the original problem was perfectly suited to complex optimisation techniques. Nevertheless, the study demonstrated nicely the potential size of such a product, and it demonstrated approaches to reduce the file size to achieve satisfactory computational efficiency while maintaining informative subsets of SNPs.
One of the challenges for an industry-wide traceability system that uses genomic information is the formulation of the value proposition for producers to genotype all slaughter animals at a reasonably high density. Additional value could be generated from the use of genotype data for management purposes, such as, for example, to predict their feedlot performance, and associated savings in feed, or to create an arrangement with the breeders of their sires to link commercial carcass records back to the stud to enhance genetic gains in carcass traits.
Conclusions
Full transparency, traceability of individuals and proven authenticity of animal products are required to maintain consumer confidence and to maintain ‘Brand Australia’ in the domestic and global market. Accuracy and ease of logistics are key characteristics that underpin a system that gains industry-wide adoption. Genomic information could be integrated with other information such as radio-frequency identification and geochemical and isotopic information to verify multiple attributes of an animal, including their production location and system, breed, and their identity. The present study has provided a starting point for the development of genomic products that might overcome the computational challenges of large datasets in this context.
Conflicts of interest
The authors declare no conflicts of interest.
Declaration of funding
This research was supported by the Science and Industry Endowment Fund.
References
Aliloo H, Clark SA (2021) The impact of reference composition and genome build on the accuracy of genotype imputation in Australian Angus cattle. Animal Production Science| The impact of reference composition and genome build on the accuracy of genotype imputation in Australian Angus cattle.Crossref | GoogleScholarGoogle Scholar |
Allen AR, Taylor M, McKeown B, Curry AI, Lavery JF, Mitchell A, Hartshorne D, Fries R, Skuce RA (2010) Compilation of a panel of informative single nucleotide polymorphisms for bovine identification in the northern Irish cattle population. BMC Genetics 11, 5
| Compilation of a panel of informative single nucleotide polymorphisms for bovine identification in the northern Irish cattle population.Crossref | GoogleScholarGoogle Scholar | 20100323PubMed |
Australian Bureau of Statistics (2019) ‘7121.0: Agricultural Commodities, Australia, 2017–18.’ Available at https://www.abs.gov.au/ausstats/abs@.nsf/7d12b0f6763c78caca257061001cc588/923c8dd5e51d7d8dca25857500274120!OpenDocument
Goffaux F, China B, Dams L, Clinquart A, Daube G (2005) Development of a genetic traceability test in pig based on single nucleotide polymorphism detection. Forensic Science International 151, 239–247.
| Development of a genetic traceability test in pig based on single nucleotide polymorphism detection.Crossref | GoogleScholarGoogle Scholar | 15939158PubMed |
Hayes B, Daetwyler H (2019) 1000 Bull Genomes Project to map simple and complex genetic traits in cattle: applications and outcomes. Annual Review of Animal Biosciences 7, 89–102.
| 1000 Bull Genomes Project to map simple and complex genetic traits in cattle: applications and outcomes.Crossref | GoogleScholarGoogle Scholar | 30508490PubMed |
Heaton MP, Harhay GP, Bennett GL, Stone RT, Grosse WM, Casas E, Keele JW, Smith TPL, Chitko-McKown CG, Laegreid WW (2002) Selection and use of SNP markers for animal identification and paternity analysis in US beef cattle. Mammalian Genome 13, 272–281.
| Selection and use of SNP markers for animal identification and paternity analysis in US beef cattle.Crossref | GoogleScholarGoogle Scholar | 12016516PubMed |
McKean JD (2001) The importance of traceability for public healthand consumer protection. Revue Scientifique et Technique 20, 363–371.
| The importance of traceability for public healthand consumer protection.Crossref | GoogleScholarGoogle Scholar | 11548512PubMed |
Nicoloso L, Crepaldi P, Mazza R, Ajmone-Marsan P, Negrini R (2013) Recent advance in DNA-based traceability and authentication of livestock meet PDO and PGI products. Recent Patents on Food, Nutrition & Agriculture 5, 9–18.
| Recent advance in DNA-based traceability and authentication of livestock meet PDO and PGI products.Crossref | GoogleScholarGoogle Scholar |
Reverter A, Hudson NJ, McWilliam S, Alexandre PA, Li Y, Barlow R, Welti N, Daetwyler H, Porto-Neto LR, Dominik S (2020) A low-density SNP genotyping panel for the accurate prediction of cattle breeds. Journal of Animal Science 98, skaa337
| A low-density SNP genotyping panel for the accurate prediction of cattle breeds.Crossref | GoogleScholarGoogle Scholar | 33057688PubMed |
Weller JI, Seroussi E, Ron M (2006) Estimation of the number of genetic markers required for individual animal identification accounting for genotyping errors. Animal Genetics 37, 387–389.
| Estimation of the number of genetic markers required for individual animal identification accounting for genotyping errors.Crossref | GoogleScholarGoogle Scholar | 16879353PubMed |
Werner FAO, Durstewitz G, Habermann FA, Thaller G, Krämer W, Kollers S, Buitkamp J, Georges M, Brem G, Mosner J, Fries R (2004) Detection and characterization of SNPs useful for identity control and parentage testing in major European dairy breeds. Animal Genetics 35, 44–49.
| Detection and characterization of SNPs useful for identity control and parentage testing in major European dairy breeds.Crossref | GoogleScholarGoogle Scholar |
Zhao J, Zhu C, Xu Z, Jiang X, Yang S, Chen A (2017) Microsatellite markers for animal identification and meat traceability of six beef cattle breeds in the Chinese market. Food Control 78, 469–475.
| Microsatellite markers for animal identification and meat traceability of six beef cattle breeds in the Chinese market.Crossref | GoogleScholarGoogle Scholar |
Zhao J, Li A, Jin X, Pan L (2020) Technologies in individual animal identification and meat products traceability. Biotechnology, Biotechnological Equipment 34, 48–57.
| Technologies in individual animal identification and meat products traceability.Crossref | GoogleScholarGoogle Scholar |