

The pattern of breeding and management within the New Zealand Thoroughbred breeding industry 2005–2015. 1. The stallion population
Y. Y. Chin A * , C. W. Rogers B C , E. K. Gee B , K. J. Stafford C and E. Z. Cameron A
A School of Biological Science, University of Canterbury, Private Bag 4800, Christchurch 8041, New Zealand.
B School of Veterinary Science, Massey University, Private Bag 11-222, Palmerston North 4474, New Zealand.
C School of Agriculture and Environment, Massey University, Private Bag 11-222, Palmerston North 4474, New Zealand.
Handling Editor: Wayne Bryden
Abstract
There has been a contraction within the New Zealand Thoroughbred racing industry and there are limited data demonstrating how this has affected, or been reflected, within the breeding industry that supplies horses for the racing industry. A reduction in the breeding industry, to a greater extent in the sector servicing domestic rather than export market has been speculated.
To describe the demographics, breeding pattern, reproductive career and workload of New Zealand Thoroughbred stallions between 2005 and 2015.
The breeding records of all Thoroughbred stallions covering >10 mares during 2005/2006–2015/2016 breeding seasons and the lifetime breeding records of all the mares covered by these stallions were extracted from the New Zealand Thoroughbred Racing website. The demographics, population numbers, career pattern, and 10-year trend in market share of stallions in different stud fee categories were examined using descriptive analysis. The stallion’s reproductive workload was modelled deterministically.
The breeding population reduced over the 10 years examined (mares by 20%, sires by 32%). This industry consolidation was almost entirely due to the 50% reduction in the number of mares mated to the low-priced stallions, which generated horses for the domestic market. The relative proportion of mares sent to medium- and high-priced stallions (breed to sell and export sector) doubled. The commercial breeding career of low- and medium-priced stallions and shuttle stallions was short (4–5 years). The number of mares covered by a stallion increased with stud fee category. Stallions covered a greater number of mares in October and November than in September and December because of the restricted opportunity to cover foaled mares early in the season, caused by the long gestation length of mares and the need to cover mares before December.
Findings in this study support that the contraction in the New Zealand Thoroughbred breeding industry was due to a reduction in the industry sector that focuses primarily on supplying horses for domestic racing. Commercial pressure and biological constraints heavily influenced the reproductive management of the breeding industry. The breeding management of stallions during the season is heavily influenced by stallion service fee category, which reflects his book size and the commercial appeal of the resultant progeny.
The contraction within the domestic sector of the breeding industry was reflected in the concurrent contraction within New Zealands domestic racing population and fewer colts and geldings entering racing. Industry breeding trends demonstrate that economic viability and optimisation of revenue depend on the breeding industry focusing on the export rather than domestic market.
Keywords: agribusiness, animal production, economics, equine, farm management, horses, livestock production, population dynamics.
Introduction
The Thoroughbred (TB) breeding industry in New Zealand generates profit through the breeding and production of TB racehorses for both the domestic and export markets (Fenessey 2010; Waldron et al. 2011). Annually, approximately 4000 foals are produced and most are marketed as yearlings and sold through the annual yearling sales series which is held in February. Approximately 40% of the annual foal crop is exported, either as yearlings or, to a lesser extent, as ready-to-race 2- and 3-year-olds (Waldron 2011). In the southern hemisphere, TB foals have a universal birthdate of 1 August, so the actual age of the horses at yearling sales varies depending on the birth month, from 13 to 17 months old. Retrospective analysis of yearling sales data has shown that older horses at the time of sale (born August–September, ∼16–17 months old at the time of sales) achieved higher mean sale prices than did younger horses (born November–December, ∼13–14 months old at the time of sales; Waldron et al. 2011). This positive sales bias reflects the general industry belief that early born foals would be physically more mature and well developed, and thus have a greater chance to race as 2-year-olds. Starting racing as a 2-year-old has also been reported to be associated with greater racing career success and longevity (Tanner et al. 2013; Velie et al. 2013). Therefore, the buyers’ preference for older yearlings at sales may be based on factors such as readiness to race at 2 years of age and its positive association with career potential. To meet this market preference, foals need to be born as close to 1 August as possible. The industry’s official start of breeding season is 1 September; thus, breeders attempt to breed as close to this date as possible to optimise sales return. However, mares are seasonal long-day breeders (Nagy et al. 2000), have long gestation lengths (Dicken et al. 2012) and experience breeding drift providing multiple challenges to maintain early and annual foaling (Gee et al. 2017). Therefore, the breeding management of commercial thoroughbred broodmares should be heavily focused on overcoming these reproductive constraints.
Other than maturity of foals at sales, the sales price is also dictated by how the market predicts race performance of the yearlings, which is based on race performance of the sire, mare and any available race records of their progeny. The sire-centric influences on sales price are his pedigree (e.g. sire’s race performance and stud fee) and performance indicators (i.e. race earnings, number and grade of races won, and performance of his progeny), which is reflected through his stud fee (Stowe and Ajello 2010). Due to this market preference, foals by elite stallions are more likely to be marketed through the premier sales category and sold at a higher price (Waldron et al. 2011). As a result, there is a significant bias in the distribution of mares sent to stallions within the different stud fee ranges, which is expected to be reflected in the reproductive workload of the stallions and their ability to have a successful commercial career (Rogers et al. 2014).
There has been significant contraction within the Thoroughbred breeding and racing industry, while the number of horses exported remained relatively stable. Industry figures demonstrate a fall in the foal crop from 2005 to 2015, from 4522 to 3293, yet exports did not fall at the same rate, with 40% and 46% of the annual foal crop being exported respectively (‘New Zealand breeding, sales and export statistics 1995–2017’). Together, these figures imply that the reducing annual foal crop can be the result of a reduced production focus on the domestic market and a consistent, or increasing, focus on the export market (Gee et al. 2017). There are two distinct groups within the breeding population in New Zealand, mares covered by lower-cost sires for domestic consumption and horses bred for sale as a commercial product and to appeal to the export market (Rogers and Gee 2011). Therefore, a change in industry focus would be reflected through changes in population characteristics (i.e. number of stallions within different stud-fee ranges) and the turnover and distribution of mares to stallions of different stud-fee ranges.
The New Zealand Thoroughbred breeding industry generates income by producing foals to be sold as yearling and, to a lesser extent, the sale of young untried race horses. The financial return when selling yearlings is heavily influenced by factors such as the maturity of the yearlings at the sales time and the respective yearling pedigree. These factors, along with mandated natural service and an official start date of the breeding season, create constraints within the industry system and influence the management and commercial lifespan of animals within the breeding herd. The industry operates with two sectors, one focused on breeding to race and supplying the domestic market and the other focused on ‘breeding to sell’ and appealing to the export market. The racing and breeding industry figures suggest that there may have been a change in the production focus from the domestic to sales and export sector. The breeding industry can be segregated into the stallion and the mare population where the economic and biological determinants can be different. The aim of this study was to describe the management and the changes within the different sectors of the industry between 2005 and 2015, by investigating the pattern of breeding, the demographics and reproductive workload of the New Zealand stallion population.
Materials and methods
Data collection
The breeding records of all (‘active’) Thoroughbred stallions covering more than 10 mares during the 2005/2006–2015/2016 breeding seasons and the lifetime breeding records of all mares covered by these stallions were extracted from the New Zealand Thoroughbred Racing website (https://loveracing.nz/stud-book/search.aspx), by using a customised automated web-scraping suite written in RStudio (R Core Team 2017). Stallion details available from the downloaded records were name, year of birth, and for each mating, the mare’s name and year of birth, the last service date and foaling outcome. Mare details obtained were name and year of birth, sire mated to, foaling date and foaling outcome. These two datasets were combined to provide the full database used in the analysis. Mare name, date of birth and sire mated to were used as primary keys to merge datasets and cross-validate data.
Stallion stud-fee data
Data on whether a stallion was a shuttle stallion (stallions transported between northern and southern hemispheres to breed two seasons in one calendar year), their stud fees and the year they entered stud duty in New Zealand were obtained from the Register of Thoroughbred stallions of New Zealand (nzthoroughbred.co.nz) for each of the years examined. Stallions were subsequently categorised for each season on the basis of the advertised stud fee and resident country (shuttle vs resident stallion) into low (<NZD5000), medium (NZD5001–10 000), high (>NZD10 000) and shuttle categories. Shuttle stallions could have stud fees in either the low, medium or high categories.
Mare reproductive data
Each year, mares were categorised according to mating outcome from the previous season. Wet mares were mares that had foaled in the current season, maiden mares were mares first presented for breeding (parity 0) and a dry mare was a mare that had not foaled due to pregnancy loss or was not served in the previous season.
Derived categories and measures
On the basis of the data obtained, the following derived categories and measures were obtained:
Stallion age = year − sire year of birth (YOB).
Stallion age to stud = year to stud − sire YOB.
Stallion age at end of stud duty in New Zealand = year ceased breeding − sire YOB.
Book size = number of mares covered by the stallion each season.
Increase and decrease in price category. The nth year at stud where price category change occurred were identified.
Career length = last year of breeding − year to stud.
Number of years at stud = year − year to stud.
First date of breeding season.
Last date of breeding season.
Length of breeding season = days between first and last date of every breeding season and stallion.
Fertility = live foal/(total mares covered less mares died, missed, no returns or exported). This is the official calculation used by New Zealand Thoroughbred Racing.
Foaling to conception interval = days between foaling date and last service date in the consecutive year.
Stallions were classified as commerically inactive if they did not have a breeding record for two consecutive years in the dataset, or were officially recorded as deceased. Only observations from retired and deceased stallions (n = 128) were used to calculate stallion age at the end of the commerical breeding career, price category changes across years, and the number of stallions retired per year.
Stallion mating workload
The number of matings per week were deterministically modelled for each stallion. The NZTR breeding registry records the date of last service that resulted in a positive 42-day pregnancy. However, some mares require more than one cycle to conceive and not all mares mated would conceive at the end of season. Therefore, matings that did not result in a pregnancy at all or pregnancy losses that occurred prior to 42 days of pregnancy check would not be included in the dataset. An annual return of breeding information is submitted by breeders. Therefore, the breeding registry relies on the completeness of data provided by breeders. Information from USA breeding registry indicated that 20% of annual returns were not submitted (Bosh et al. 2009; Hanlon 2012). All these factors combined can result in an underestimation of stallion workload. Therefore, the number of mares covered per week, during the breeding season, were estimated for each stallion using the following methodolgy based on the offical last date of service (LSD) published.
The offical LSD values published were grouped within calendar weeks and then adjusted for the number of matings required for conception. This value was the inverse of the reported overall per cycle conception rate on commerical New Zealand Thoroughbred farms, 53.6% = 1/0.54 (Hanlon et al. 2012). This value was then corrected for the unrecorded matings at the end of the season due to no positive pregnancy and the mean end-of-season pregnancy rate (85% = 1/0.8) reported for Thoroughbred mares covered on five New Zealand stud farms (Hanlon et al. 2012). This resulted in the calculation of
Statistical analyses
Data visualisation and descriptive analyses were used to examine the data, check for errors, and examine the distribution of the data. The normality of the data was examined using histogram, qqplot and examining means and medians, as normality tests are recommended for sample sizes of less than 50 and significant test of skewness and kurtosis is not recommended for large datasets (>200; Ghasemi and Zahediasl 2012). Differences among groups with parametric data were examined using a one-way ANOVA, and pairwise comparisons were made using a Tukey’s posthoc test. Differences among groups with non-parametric data were tested using Kruskal–Wallis test and Wilcoxon rank sum test. For relationship between continuous variables, linear regression models were used. Pearson chi-square test was used to test relationship between categorical variables.
All data manipulation and analysis were conducted in RStudio (version 1.2.5033 ©2009–2019, RStudio, Inc.).
Results
The total dataset consisted of 58 044 breeding records of 221 active stallions (covering >10 mares) and 16 173 mares. Within the dataset, there were 5173 (8.9%) records with an unknown foaling outcome. Examination of these showed that most (70%) were due to no foaling records recorded (n = 3654), or the mare was exported in-foal and foaled in another jurisdiction/country (n = 1519).
Overall population
There was a reduction in the number of active sires, mares bred, and the resultant foals born between 2005/2006 and 2015/2016 (Fig. 1). During the 10 years examined, there was a 20% reduction in the number of mares mated (from 5486 to 4376, ∼1.8% reduction per season). There was a small spike in mares bred in 2007 (15% increase compared with the values in the previous year). The number of live foals born followed a pattern similar to the broodmare numbers, but with the biological 1-year lag.
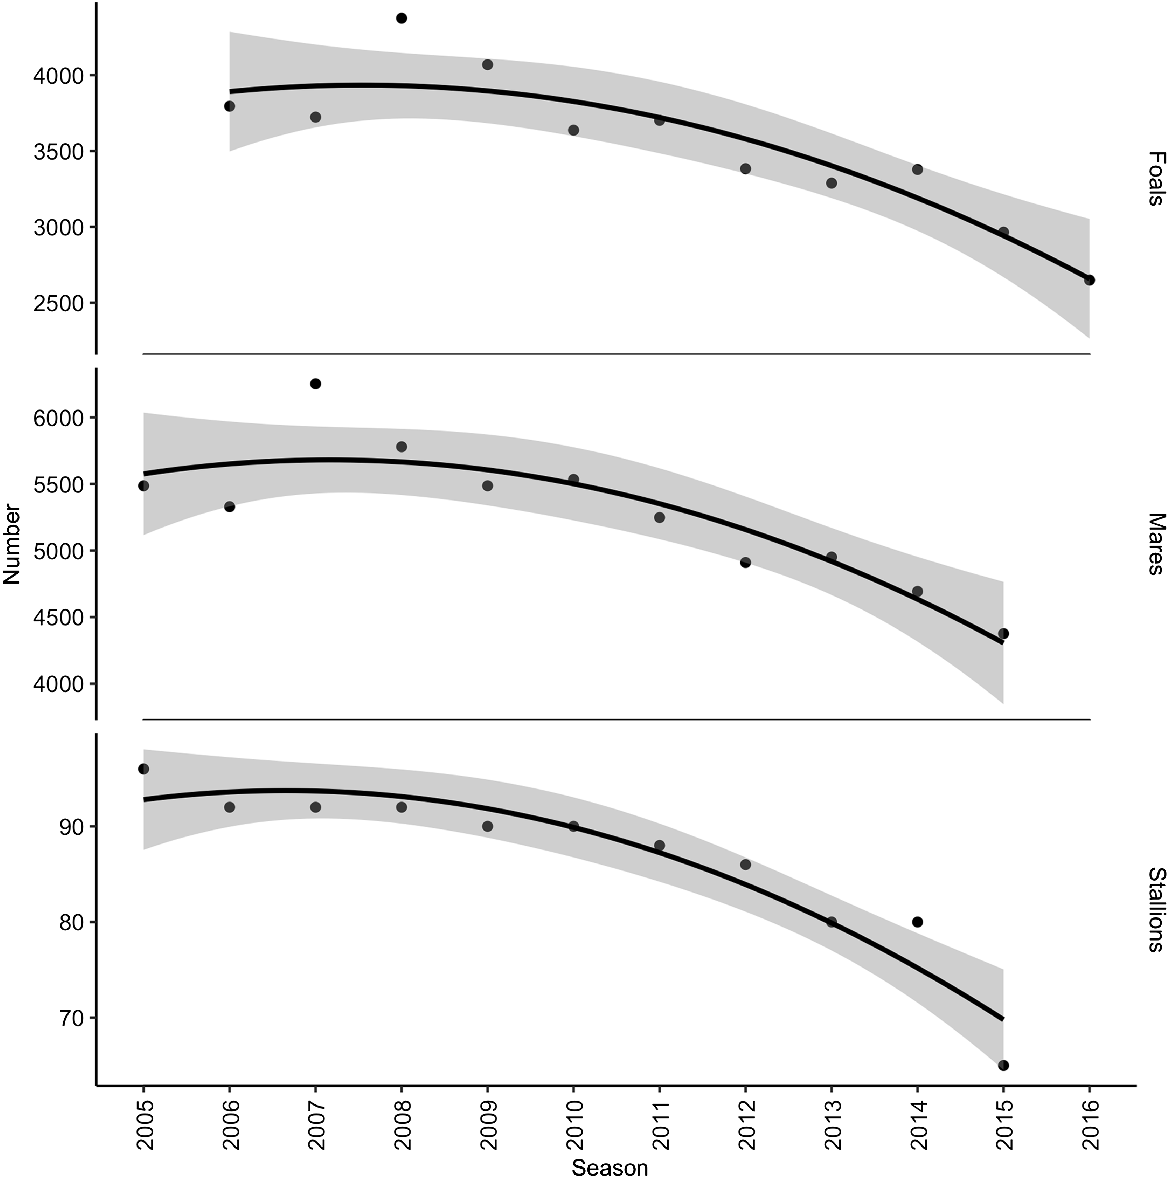
Stallion population
During the 10-year period, there was a 32% reduction in the number of active sires. The reduction in sires was constant (1.5% per year) until the 2015/2016 season, which had a 19% reduction compared with the previous season. The acute reduction in active sires in the 2015/2016 season accounted for 48% of the sire population contraction during the 10-year period.
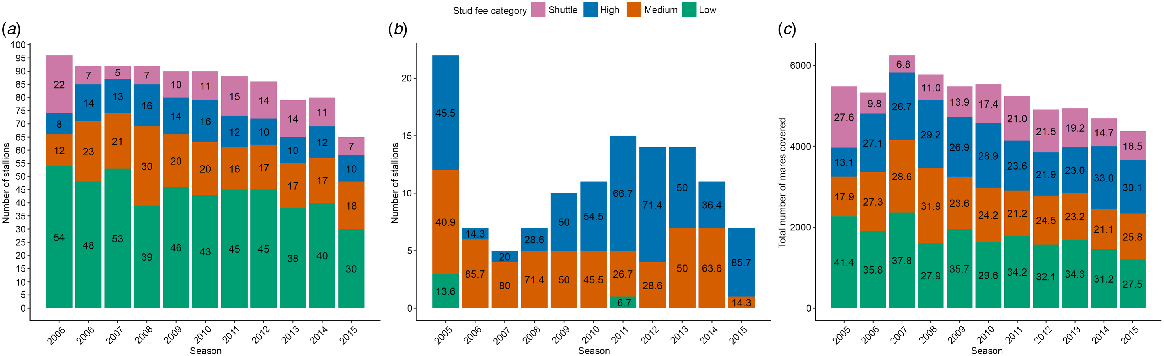
The number of low-, medium- and high-priced New Zealand sires and shuttle stallions are presented in Fig. 2a. The number of stallions categorised as low, medium, expensive and shuttle stallions varied among the seasons recorded (P < 0.01, chi-square test). The general population trend was a reduction in the number of low-priced (54–30) and shuttle stallions (22–7) at stud (Fig. 2a). In 2005, the shuttle stallions were relatively evenly distributed across the high and medium stud-fee categories (40.9% and 45.5% respectively). However, by 2015 the distribution was heavily skewed towards the high stud-fee category (Fig. 2b).
(a) The total number of ‘active’ New Zealand Thoroughbred stallions that stood at low-, medium-, and high-priced stud-fee category and the total number of shuttle stallions that covered mares in New Zealand, (b) the number and proportion of Thorougbred shuttle stallions that stood at low, medium, and high stud-fee category, and (c) the total number of mares covered by Thoroughbred stallions in low-, medium-, high-priced and shuttle category between 2005/2006 and 2015/2016 breeding seasons in New Zealand.
Breeding pattern
There were significant across-year changes in the number of mares mated to sires in the different stallion categories (P < 0.001; Fig. 2c). The greatest loss of mares bred were those mated to low-priced sires (n = 2273–1204) and it was the loss of mares in this sector that was reponsible for most of the contraction observed in the total breeding population. In contrast, there was an increase in the number, and the relative proportion, of mares mated to medium-priced sires and an almost two-fold increase in mares mated to expensive sires (n = 1293–1131, n = 718–1318 respectively).
Stallion population turnover
During the 10 years examined, 121 stallions were recruited into the breeding population and 152 stallions ceased breeding. Annually, there were 11 ± 3 stallions recruited and 14 ± 4 stallions ceasing breeding, resulting in a net loss of three sires/year. The turnover rate and numerical turnover per year were greatest within the low-cost category compared with other categories (Table 1). The overall annual population turnover rate was 15%. Low-priced stallions comprised the largest category and therefore disproportionately contributed to the reduction in the number of stallions at stud, accounting for 87% of the reduction observed in the number of active sires at stud during the 10-year period (n = 96–65).
| Parameter | Low | Medium | Shuttle | High | |
|---|---|---|---|---|---|
| Population turnover rate (mean ± s.e.m., % per year) | |||||
| Stallions retired or deceased | 23 ± 6 | 10 ± 5 | 12% ± 6 | 15% ± 6 | |
| Stallions recruited | 12 ± 5 | 16 ± 10 | 18% ± 5 | 12% ± 6 | |
| Population numerical turnover per year (mean ± s.e.m., per year) | |||||
| Stallions retired or deceased | 10 ± 3.46 (90) | 2.17 ± 1.6 (13) | 2.2 ± 1.1 (12) | 2.17 ± 1.17 (13) | |
| Stallions recruited | 5.36 ± 2.29 (59) | 2.9 ± 2.13 (29) | 2 ± 1.22 (18) | 1.5 ± 0.85 (15) | |
| Age (mean ± s.e.m.) | 10 ± 0.17a | 10 ± 0.27a | 8 ± 0.28b | 11 ± 0.46c | |
| Age to stud (mean ± s.e.m.) | 6 ± 0.32 | 6 ± 0.39 | 5 ± 0.26 | 5 ± 0.15 | |
| Age ceased breeding (mean ± s.e.m.) | 12 ± 0.45 | 12 ± 1 | 10 ± 0.62 | 14 ± 3 | |
| Book size [median (IQR)] | 31 (18–55)a | 65 (45–90)b | 74 (49–96)bc | 114 (81–138)d | |
| Number of mares covered per week (median(IQR)) | |||||
| September | 4 (2–7)a | 4 (2–9)b | 7 (4–11)c | 9 (4–16)d | |
| October | 4 (2–9)a | 9 (4–13)b | 9 (4–16)b | 13 (9–20)c | |
| November | 7 (4–11)a | 9 (4–16)b | 11(7–18)c | 16 (9–22)d | |
| December | 4 (2–9)a | 4 (2–9)b | 7 (2–11)c | 9(4–16)d | |
| 4 (2–9)a | 7 (4–11)b | 9 (4–13)c | 11 (7–18)d | ||
| Start date of breeding season [median (10–90th percentile)] | 16 September (3 September–9 October)a | 4 September (1–19 September)b | 5 September (3–14 September)b | 2 Sept (1–8 September)c | |
| Last day of breeding season (mean ± s.e.m.) | 28 December ± 1.03a | 27 December ± 1.11a | 21 Decemeber ± 0.91b | 29 December ± 1.62a | |
| Mean length of effective breeding season (mean ± s.e.m. days) | 100 ± 1.19a | 112 ± 2.15bc | 107 ± 1.08c | 117 ± 1.59bd | |
| Fertility (mean ± s.e.m.%) | 80.77 ± 0.57 | 82.63 ± 0.54 | 83.31 ± 0.67 | 82.19 ± 0.67 | |
| Years at stud [median(IQR)] | 5 (3.25–8.75) | 5 (4–8) | 4 (2.25–6) | 8 (3–16) | |
Note: items within the same row with different letters are statistically significantly different (at P < 0.05).
Sire age and number of years at stud
The sire age and career length are presented in Table 1. Across all years examined, the high-priced stallions were older and began stud duty earlier than did low-, medium-priced and shuttle stallions. Low-, medium- and high-priced stallions ceased breeding at 12 years old, whereas shuttle stallions ceased breeding 2 years earlier. The median years at stud were shortest for shuttle stallions, followed by low-, medium- and high-priced stallions.
Career pattern
For the majority of sires (84%), there was no change in stud-fee category throughout their breeding career. If a sire did change category, it was generally down a category. Of the stallions that started their career in the expensive category, four of nine dropped down a category; three dropped down to medium-price and one dropped to the low-price category. Most stallions that started in the medium stud-fee category dropped down (14/19) a category. Half of the shuttle stallions (12/22) that stood at stud were subsequently purchased by New Zealand stud farms, where the majority later stood at medium- and high-price categories (9/12). For medium- and high-priced stallions that dropped category, the median length of the stallion remaining in the same price category was 3 years. Across 10 years, 84% of low-cost stallions that ceased breeding were those that covered less than 55 mares per year over their breeding lifetime.
Breeding season
The start and end date, and therefore the length of breeding season, were consistent across all years. Breeding season began earliest for high-priced stallions and latest for low-priced stallions, while start dates were similar between medium-priced and shuttle stallions (Table 1). The last day of the breeding season fell in the last week of December for high-, medium- and low-priced stallions, whereas shuttle stallions finished the breeding season approximately 1 week earlier (21 December ± 0.91, P < 0.05; Table 1). As a result, high-priced stallions had the longest effective breeding season and the length of breeding season was significantly (P < 0.05) shorter for low-priced and shuttle stallions than for high-priced stallions (Table 1).
The lattitude of breeding farm location had an effect on the start of the breeding season. Medium- and low-priced stallions standing at stud in South Island started the breeding season later than did the stallions located in the upper and lower North Island (Table 2). There were no high-priced and shuttle stallions that stood in the South Island and, thus, this prevented comparison between North and South island within these stallion categories.
| Stallion-price category | Upper North Island (35–37°S) | Central and lower North Island (39–41°S) | South Island (43–45°S) | |
|---|---|---|---|---|
| Low | 13 September (5–22 September)a (n = 75) | 15 September (8–27 September)a (n = 41) | 26 September (16–35 September)b (n = 41) | |
| Medium | 4 September (1–9 September)a (n = 52) | 4 September (2–6 September)a (n = 11) | 16 September (12–22 September)b (n = 4) | |
| High | 2 September (1–4 September) (n = 33) | 1 September (1–2 September) (n = 5) | – | |
| Shuttle | 3 September (0–8 September) (n = 39) | – | – | |
| 5 September (1–13 September) | 10 September (3–21 September) | 25 September (16–35 September) |
Note: items within the same row with different letters are statistically significantly different (at P < 0.05).
Book size and fertility
The largest book sizes were associated with high-priced stallions and then shuttle sires (Table 1). The median booksizes were consistent across years examined, except for the high category, which increased (P = 0.05). The mean end of season sire fertility was 81.3 ± 0.9% and did not differ significantly across seasons or the different stallion categories (Table 1).
Mares covered per week
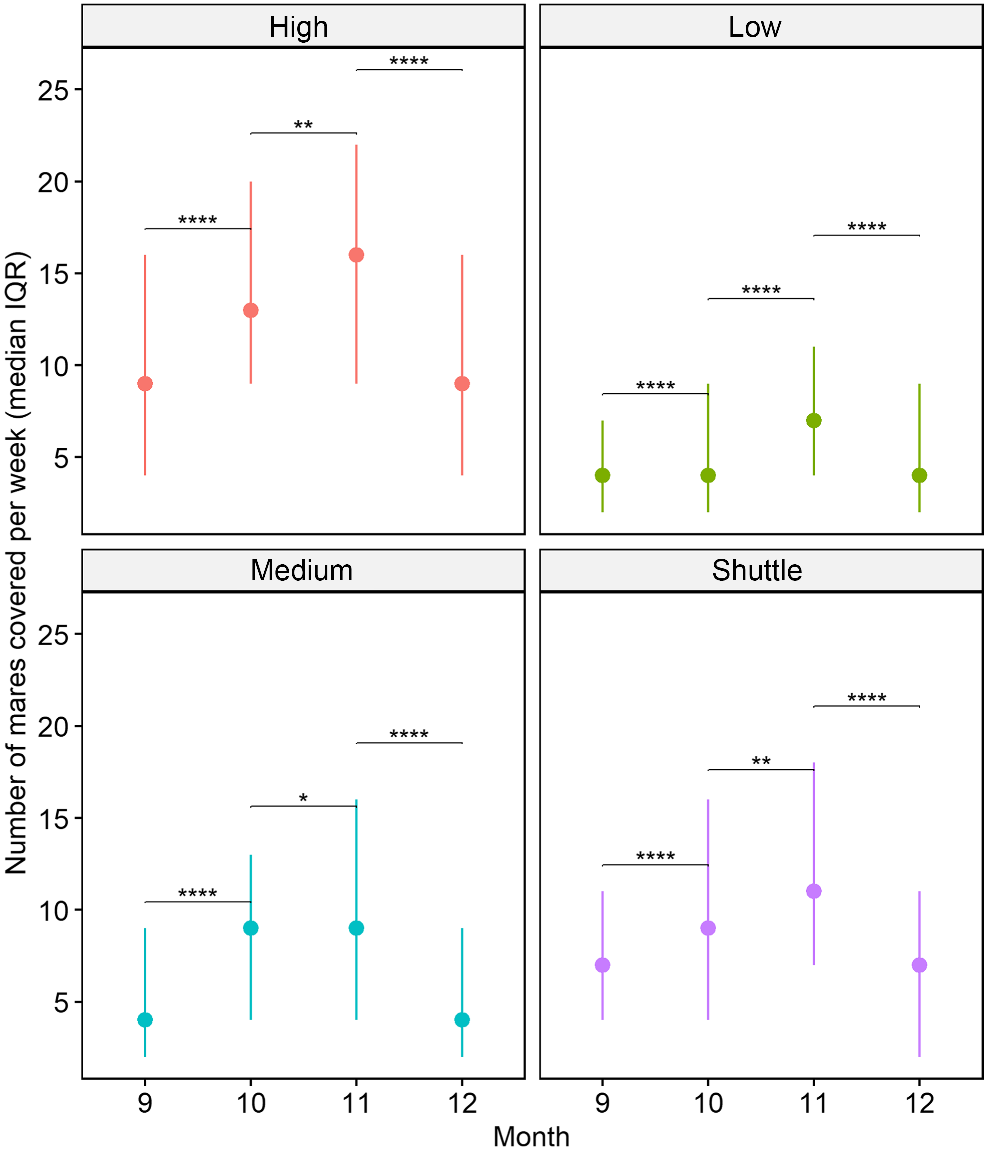
Across the breeding season, high-priced stallions covered more mares, followed by shuttle stallions, medium-priced stallions, with mares being the least covered by low-price stallions (Table 1). The number of mares covered per week increased from September to November. In December, number of covers returned to values similar to those in September (Fig. 3).
Number of mares (median, IQR) covered by low-, medium-, high-priced and shuttle stallions in New Zealand during the 2005/2006–2015/2016 breeding seasons.
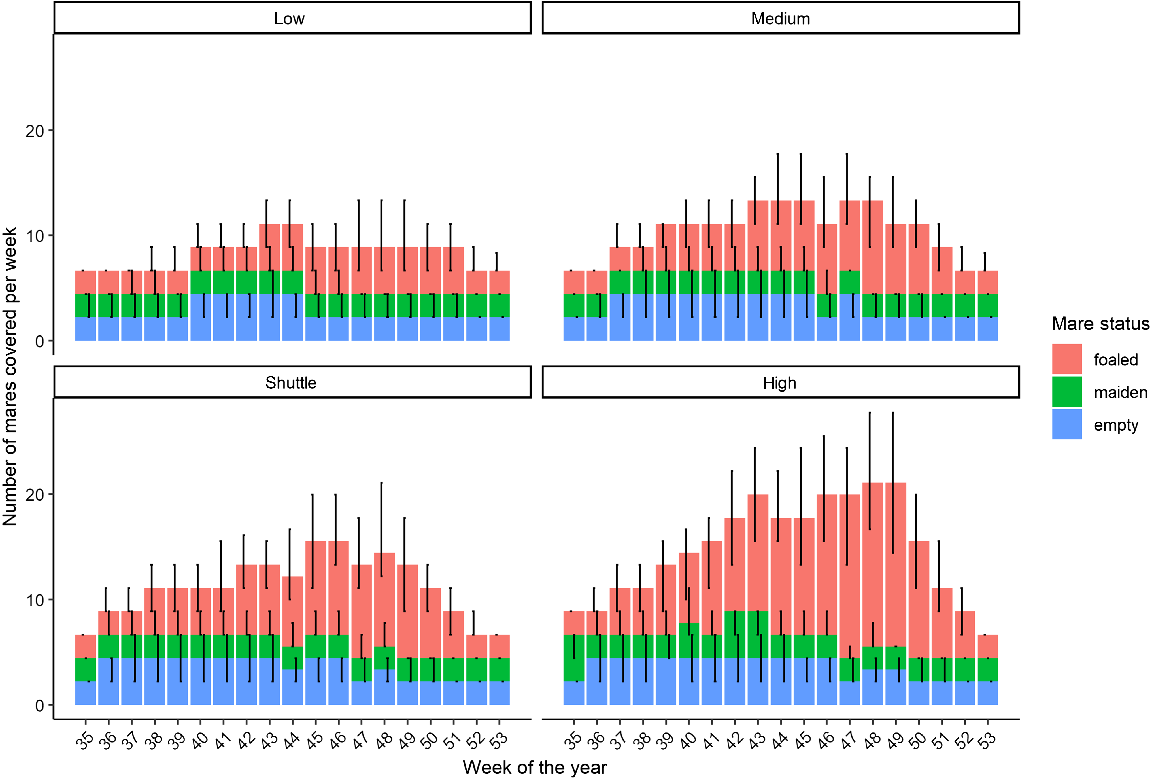
In contrast to expectations, the distribution of maiden and empty mares covered per week was consistent throughout the breeding season for sires in all stud-fee categories. This effectively meant that the distribution of the breeding workload of a stallion during the season was primarily driven by the distribution of the mares foaling (Fig. 4). Regardless of category, the general trend was for larger number of mares to be covered in October and November, of which the majority were mares that had a foal at foot.
Discussion
The New Zealand Thoroughbred breeding industry generates much of its revenue from producing foals for yearling sales and is heavily infuenced by the export market. The influence of the export market and the commercial focus (breeding-to-sell) were reflected in the commerical breding career of stallions and the industry consolidation over the study period. During the 10 years examined, the number of active sires, mares mated and foals born reduced at a consistent rate. The exception to this trend was a brief spike in the number of mares covered in 2007, which was in contrast to the sudden reduction in mares bred in most countries following the Global Financial Crisis (Leadon et al. 2012). Approximately 62% of all exports from New Zealand are to Australia (Fenessey 2010) and, in 2007, Australia had an outbreak of equine influenza (EI). The control measures associated with the outbreak and the clinical presentation of EI in a naïve mare population resulted in a reduction in mares bred, which was expected to lead to a reduction of the Australian Thoroughbred foal crop (Callinan 2008; East 2009). The control measures also prevented New Zealand mares from being sent to Australia to be mated with Australian resident stallions. The spike in mares mated during 2007 is believed to be a combination of some mares remaining in New Zealand and mated to New Zealand resident sires rather than Australian sires and a market reponse by New Zealand breeders to meet a perceived shortfall in the supply of racehorses in Australia. The fate of these additional foals is uncertain as official export figures do not demonstrate a subsequent increase in export from this foal crop and there was no proportionate increase in the number of Thoroughbred races and horses in New Zealand (Legg et al. 2021).
Two distinct populations were described within New Zealand breeding industry, a domestic market (either breed to race, or sell as a trials winner), which is predominantly supplied by lower-cost stallions, and a population focused on breeding to sell as yearlings, predominantly to the export market, typically supplied by foals sired by high-priced stallions (Rogers and Gee 2011). The reduction in the number of low-costs stallions, and mares mated to this stud-fee category, was responsible for the overall population contraction. This annual reduction in the number of mares covered and foals born (1.8% per year) was reflected in the consistent annual reduction of horses entering the New Zealand racing industry during 2005–2015. During this period, there was an annual reduction of 2–3% in the number of horses entering racing, the number of starts and, the number of races each year (Legg et al. 2021). These data support the hypothesis that the contraction in the lower end of the breeding market was associated with a reduction in the supply of racehorses for New Zealand’s domestic racing industry. During the study period, the gross value and limited stakes money available domestically meant that many owners and trainers would sell trial-winning horses to subsidise the racing operation (typically colts or geldings to Asia due to buyer preference;). The reliance on this revenue stream selling trial-winning colts or geldings effectively eliminated the domestic market for fillies as racing prospects and distorted the domestic market to the extent that fillies without an elite pedigree were not marketable as weanlings or yearlings. Analysis of New Zealand Bloodstock National Yearling sales data by Waldron (2011) demonstrated this filly bias, with vendors in the lower-priced sales category (Festival category) offering few fillies for auction as yearlings. In the festival category, only 33% of yearlings offered were fillies, compared with 44% of lots offered in the top-priced category (Premier) being fillies. These economic and market forces explain in part why the consolidation within the New Zealand breeding industry was driven by a disproportionate reduction in the number of stallions and mares within the low-cost category. The retirement and non-replacement of low-cost stallions indicate a lack of reinvestment by studmasters in this sector of the market.
The use of shuttle stallions reduced during the study period and became increasingly focused on only a few shuttle stallions, but at the top end of the market. This shift reflects the changes in the economics of the breeding operation at the lower levels of the industry and the tight profit margins associated with the high lease fees to obtain the southern hemisphere breeding rights to the shuttle stallions (Gee et al. 2017). If a stallion is being shuttled, then the economics may be viable only with a high-priced shuttle stallion that has the pedigree and performance that would ensure that the resultant yearling would have a greater chance of being marketed through the top sales category, appeal to the the international buying bench, and thus maximise sales return and profit to the mare owner (Rogers and Gee 2011; Waldron et al. 2011).
Irrespective of price category, stallions had a relatively short commerical career of ∼5 years. At the end of the 5th year at stud, the stallion’s oldest progeny will have completed their 2-year-old racing season and provided the first data on progeny performance. The 5-year commerical career observed reflects the New Zealand bloodstock taxation laws, with stallions being depreciated to zero book value at the end of their 5th year at stud. The trend was for all stallions to remain in the same price category for the first 3 years at stud, before dropping down in stud-fee categories. This coincides with commercial reality where it becomes challenging to market stallions to mare owners in the stallion’s 3rd year at stud, as the oldest progeny have not yet been sold through the yearling sales as these occur at the end of the southern hemisphere breeding season (February/March). This lack of sales data means that breeders have no clear measure of market demand for the stallion’s progeny. Marketing a stallion is even more difficult in the 4th year at stud, as breeders wait to see if the stallion can leave offspring that can win as 2-year olds. Stowe and Ajello (2010) proposed that the market value of stallion is best determined at the 5th year at stud, as reliable progeny performance data become available at the completion of the oldest offspring’s 2-year-old racing career. This was reflected in the median career lifespan reported in this study for low-priced, medium-priced and shuttle sires. In contrast, high-priced stallions had a longer breeding career. The heavy pre-selection of stallions within this category may create a market bias that permits even the less successful sire that started in this category to continue a career, albeit in a lesser price category. Historically, there is evidence for this bias and its persistence in the perception of the merit of the resultant offspring and recruitment of mares into the national breeding herd (Rogers and Gee 2011).
High-priced stallions were recruited to stud at younger age than were other stallions, generally because they had achieved the highest level of performace during their ‘3-year-old’ racing career, typically winning a Derby (top echelon of races; Stowe and Ajello 2010). At this point, modelling suggests a stallion’s economic value, as a potential sire would typically exceed the potential earnings on the race track (Stowe and Ajello 2010). Stallions with a lesser pedigree or performance record may require an additional year to achieve the performance milestones (wins or placings) required to have appeal as a breeding stallion. A similar trend in the age of recruitment to the breeding herd has been reported in mares, with mares with a lesser pedigree racing for longer and thus entering the breeding herd once older and having achieved the required performance level (Rogers et al. 2016).
The stallion mating workload model in this study suggests that stallions provided from one to four live services per day, which is similar to previous reports of Thoroughbred stallions in New Zealand and the United Kingdom (Allen and Wilsher 2012; Hanlon 2012). Stallions in the higher and shuttle category had the greatest weekly workload, due to a larger book size. Across all stallion categories, the general trend was for stallion workload to increase from September, reaching the highest workload in November and the first week of December. This peak coincides with the greatest number of mares that had a foal that were serviced in this dataset, and the time when mares would return to oestrus post-foaling (based on the mean foaling date of foaled mares in this dataset; 18 October ± 26 days + 12 days post-partum anoestrus). A smaller fluctuation in workload was observed in the low-cost stallions, as they are under less pressure with a smaller book size.
As the mare population comprises 54.5 ± 0.85% pregnant mares (Chin et al. 2021), the seasonal pattern of workload observed was due to the restricted opportunity to cover pregnant mares until they had given birth, exacerbated by the long gestation length of mares, especially early in the breeding season (Dicken et al. 2012). To balance the stallion workload and produce more early born foals, more dry mares could potentially be covered between September and October when workload was lowest, by using controlled light exposure that mimic ‘long days’ to advance the start of the breeding season. A cross-sectional study reported that 40% (9/22) of farms utilised photoperiod manipulation in dry mares (Rogers et al. 2007). However, mares are kept at pasture year round in the southern hemisphere, making the logistics of implementing artificial lighting program difficult as it requires mares to be housed in yards or stable settings, which effectively restricts the number of mares that would be put under artificial lighting program (Rogers et al. 2007). Housing mares in yards and stables can also increase labour costs. As a result, studmasters would have used a targeted approach in selecting mares to expose to increased artifical light. This logistical limitation explains the early onset of breeding season with a limited number of dry mares and the lack of seasonal changes in the number of dry mares covered.
Despite substantial variation in book size and seasonal workload, the end of season fertility of stallions did not differ between stallion categories or across seasons. With the exception of the high-priced stallions, the book size of the mares covered each season was moderate, or even low. It was reported that successive ejaculation within one to five times per day at hourly intervals in Thoroughbred stallions did not affect the pregnancy rates, although spermatozoa count declined from first to fifth ejaculation, indicating that adequate spermatozoa numbers are maintained under these mating frequencies (Squires et al. 1979). Pregnancy rates were also not affected at a mean workload of 160 live matings per season (Allen and Wilsher 2012). The consistent end-of-season fertility values can be attributed to a combination of intensive veterinary reproductive management in mares (Hanlon 2012) and intensive management of stallion workload. At present, there are no reports on stallion breeding management at daily level (i.e. intervals between successive matings, successive days worked, frequency and length of rest days).
The earlier onset of breeding season observed in shuttle, and medium- and high-priced stallions than in low-priced stallions provides further support that there are two distinct breeding populations, with the latter having relatively less pressure to produce early born foals, as the majority of the subsequent progeny would be for breeders ‘breeding to race’ and focused on the domestic market (Rogers and Gee 2011). The onset of breeding season was delayed for stallions located in the South Island. The mean weekly minimum temperature is reported to be negatively correlated with the time of first ovulation (days after winter solstice) and environmental temperature is an important factor influencing the time of the first ovulation in mares (Guerin and Wang 1994). Therefore, the delay at the start of the breeding season can be associated with a later onset of cyclicity in mares caused by the delay in seasonal temperature rise in southern compared to northern regions (NIWA Ltd 2010). The lack of difference in last service date among low-, medium- and high-priced stallions indicates that this date may be set by convieniance or an industry norm, rather than biological constraint. Shuttle stallions ceased breeding 1 week before the other stallion categories. Most shuttle sire lease agreements have a non-negotiable last service date included in the agreement, to ensure a brief period of rest and sufficient time for the stallion to shuttle back for the northern hemisphere breeding season.
Conclusions
The 10-year population trend showed that there has been a reduction within the domestic sector of the breeding industry and a greater emphasis on ‘breeding to sell’ and appealing to export market rather than ‘breeding to race’. The investigation into stallion reproductive workload showed that the primary means of ensuring the production of mature yearlings for sales was by artificially truncating the breeding season in December. Breeders attempt to breed as many mares as possible before the end of the artificially imposed breeding season by breeding multiple mares per day to a stallion, especially during October–November when a large number of foaled mares return to oestrus cycle post-foaling. There was a heavy selection bias based on stallion pedigree and offspring performance, as it is heavily associated with yearling sales price. This resulted in the short commercial life and limited oportunity for stallions to enter the top tier. The findings support that the breeding sector is increasingly commercial. The management patterns are heavily driven by economic forces around optimising financial return and overcoming reproductive constraints.
Data availability
The data that support this study is available upon request to the corresponding author.
References
Allen WR, Wilsher S (2012) The influence of mare numbers, ejaculation frequency and month on the fertility of Thoroughbred stallions. Equine Veterinary Journal 44, 535-541.
| Crossref | Google Scholar |
Bosh KA, Powell D, Shelton B, Zent W (2009) Reproductive performance measures among Thoroughbred mares in central Kentucky, during the 2004 mating season. Equine Veterinary Journal 41, 883-888.
| Crossref | Google Scholar |
Chin YY, Rogers CW, Gee EK, Stafford KJ, Cameron EZ (2021) The pattern of breeding within the New Zealand Thoroughbred breeding industry 2005–2015. 2. The mare population. Animal Production Science
| Google Scholar |
Dicken M, Gee EK, Rogers CW, Mayhew IG (2012) Gestation length and occurrence of daytime foaling of Standardbred mares on two stud farms in New Zealand. New Zealand Veterinary Journal 60, 42-46.
| Crossref | Google Scholar |
East IJ (2009) The role of land use patterns in limiting the spread of equine influenza in Queensland during the 2007 epidemic. Transboundary and Emerging Diseases 56, 292-302.
| Crossref | Google Scholar |
Fenessey PF (2010) An overview of the New Zealand thoroughbred industry. Proceedings of the New Zealand Society of Animal Production 70, 137-139.
| Google Scholar |
Gee EK, Rogers CW, Bolwell CF (2017) Commercial equine production in New Zealand. 1. Reproduction and breeding. Animal Production Science 60, 2145-2154.
| Crossref | Google Scholar |
Ghasemi A, Zahediasl S (2012) Normality tests for statistical analysis: a guide for non-statisticians. International Journal of Endocrinology and Metabolism 10, 486-489.
| Crossref | Google Scholar |
Guerin MV, Wang XJ (1994) Environmental temperature has an influence on timing of the first ovulation of seasonal estrus in the mare. Theriogenology 42, 1053-1060.
| Crossref | Google Scholar |
Hanlon DW, Stevenson M, Evans MJ, Firth EC (2012) Reproductive performance of Thoroughbred mares in the Waikato region of New Zealand: 1. Descriptive analyses. New Zealand Veterinary Journal 60, 329-334.
| Crossref | Google Scholar |
Leadon DP, O’Toole D, Duggan VE (2012) A demographic survey of unwanted horses in Ireland 2005–2010. Irish Veterinary Journal 65, 3.
| Crossref | Google Scholar |
Legg KA, Gee EK, Cochrane DJ, Rogers CW (2021) Preliminary examination of the biological and industry constraint on the structure and pattern of Thoroughbred racing in New Zealand over thirteen seasons:2005/06–2017/18. Animals 11, 2807.
| Crossref | Google Scholar |
Nagy P, Guillaume D, Daels P (2000) Seasonality in mares. Animal Reproduction Science 60–61, 245-262.
| Crossref | Google Scholar |
New Zealand Thoroughbred Breeders (2017) NZ breeding, sales & export statistics (1995–2017). Available at https://www.nzthoroughbred.co.nz/nz-breeding-stats/. [Accessed 29 October 2021]
NIWA Ltd (2010) Mean daily maximum temperatures (1981–2010). Available at https://niwa.co.nz/education-and-training/schools/resources/climate/maxairtemp.
R Core Team (2017). R: A language and environment for statistical computing. R Foundation for Statistical Computing, Vienna, Austria. Available at https://www.R-project.org/.
Rogers CW, Gee E (2011) Selection decisions in Thoroughbred broodmares. Proceedings of the New Zealand Society of Animal Production 71, 122-125.
| Google Scholar |
Rogers CW, Gee EK, Firth EC (2007) A cross-sectional survey of Thoroughbred stud farm management in the North Island of New Zealand. New Zealand Veterinary Journal 55, 302-307.
| Crossref | Google Scholar |
Rogers CW, Gee EK, Bolwell CF (2014) Reproductive production constraints within the New Zealand racing industry. Journal of Equine Veterinary Science 34, 164.
| Crossref | Google Scholar |
Squires E, Pickett BW, Amann RP (1979) Effect of successive ejaculation on stallion seminal characteristics. Journal of Reproduction and Fertility 27, 7-12.
| Google Scholar |
Stowe CJ, Ajello B (2010) A hedonic price analysis of differentiated products of unknown quality: freshman sire stud fees in the Thoroughbred breeding industry. Journal of Agribusiness 28, 19-30.
| Crossref | Google Scholar |
Tanner JC, Rogers CW, Firth EC (2013) The association of 2-year-old training milestones with career length and racing success in a sample of Thoroughbred horses in New Zealand. Equine Veterinary Journal 45, 20-24.
| Crossref | Google Scholar |
Velie BD, Knight PK, Thomson PC, Wade CM, Hamilton NA (2013) The association of age at first start with career length in the Australian Thoroughbred racehorse population. Equine Veterinary Journal 45, 410-413.
| Crossref | Google Scholar |
Waldron KL (2011) Investigation into the influence of yearling sale production parameters on the future career longevity and success of New Zealand Thoroughbred race horses, MSc Thesis, Agricultural Science (equine), Massey University, Palmerston North, New Zealand. https://mro.massey.ac.nz/handle/10179/4184
Waldron K, Rogers CW, Gee EK, Bolwell CF (2011) Production variables influencing the auction sales price of New Zealand Thoroughbred yearlings. Proceedings of the New Zealand Society of Animal Production 71, 92-95.
| Google Scholar |