

Comparative enteric-methane emissions of dairy farms in northern Victoria, Australia
Sineka Munidasa A , Brendan Cullen A , Richard Eckard A , Saranika Talukder A , Lachlan Barnes B and Long Cheng A *
A Faculty of Science, The University of Melbourne, Melbourne, Vic., Australia.
B Murray Dairy, 255 Ferguson Road, Tatura, Vic. 3616, Australia.
Abstract
Enteric methane (CH4) is a source of greenhouse gas (GHG) in agriculture, which needs to be reduced. A variety of feeding systems for dairy production is being used in south-eastern Australia, but there are few studies that compare CH4 emissions and emission intensity (EI) of milk production across these systems.
The objective was to estimate the lactating cows’ enteric-CH4 emissions, EI and their seasonal changes, across different feeding systems in northern Victoria, Australia.
A Tier 2 inventory methodology was used to estimate the enteric-CH4 emissions and EI. Four case-study farms were selected to represent a range of feeding systems, Farms A, B, C and D were categorised as System 4–5 (hybrid–total mixed ration system), System 4 (hybrid system), System 2 (moderate–high bail system) and System 2 respectively. Monthly feed, animal and production data were sourced from June 2019 to May 2020.
Average enteric-CH4 emissions of Farms A and B (13.1 and 12.9 kg CO2e/head.day respectively) were greater than those of Farms C and D (11.7 and 11.6 kg CO2e/head.day respectively). Furthermore, CH4 EI was greater in Farms C and D (0.49 and 0.48 CO2-e kg/kg fat- and protein-corrected milk (FPCM) respectively) and it was lower in both Farms A and B (0.46 CO2-e kg/kg FPCM). Overall, Farms A and B using Feeding-system 4–5 with greater-producing cows produced more CH4 but with less CH4 EI than did the Farms C and D, which are mainly pasture-based.
These findings suggest that to reduce CH4 EI requires a move towards Feeding-system 4–5. However, on the basis of the results of the current study, pasture-based systems have an advantage over hybrid/total mixed ration feeding systems, as these farms have lower absolute CH4 emissions, which helps address climate change.
Estimation of CH4 emissions, EI and seasonal changes in them gives farmers the opportunity to identify the mitigation strategies and plan specific strategies that fit the particular feeding system and season. However, more research needs to be conducted to check the feasibility of doing this.
Keywords: Australia, bovine, climate change, emissions, evaluation, greenhouse gas, lactating cattle, sustainability.
Introduction
As the world human population is increasing, access to sustainable diets, which are nutritionally balanced, economically viable and produced responsibly, is crucial. The dairy industry has an important role to support global sustainable food production. Therefore, working towards more productive and environmentally friendly dairy production systems is essential (Miller and Auestad 2013). The dairy industry in Australia is the third-largest rural industry, producing approximately 8.6 billion litres of milk in 2021–22 (Dairy Australia 2022). Wales and Kolver (2017) highlighted that Australian dairy farms must be operated with a vision of reducing the environmental footprint, so as to allow the dairy industry to remain competitive in the changing global dairy markets.
According to the Department of Agriculture and Water Resources ABARES (2020), the most important agricultural commodity in Victoria is milk and dairy production in Victoria represents 63.4% of total national milk production. Dairy production in Victoria is distributed over three major dairy regions namely, northern Victoria, south-western Victoria and Gippsland. Among them, northern Victoria is one of the most diverse dairy production regions in terms of feeding systems, accounting for nearly 19% of the national milk production (Agriculture Victoria 2021). Traditionally, dairy production in northern Victoria has relied heavily on grazing irrigated pasture (Wood et al. 2007). In recent years, the diverse geography, climatic conditions and volatile milk and water prices in the region have induced major changes in dairy farming systems. Farmers have moved towards more brought-in/supplementary feed-based systems (Murray Dairy 2019). This leads to changes in feed management, milk production but also livestock emissions.
Enteric CH4 is a major environmental pollutant that results from dairy operations, which affects environmental degradation while causing inefficiencies (e.g. represents 2–12% of gross energy-intake loss; Johnson and Johnson 1995) in the dairy production systems. Enteric CH4 is a by-product of microbial fermentation in the rumen (Johnson and Johnson 1995). Mitigating enteric-CH4 emissions is crucial for reducing the carbon footprint of the Australian dairy industry (Moate et al. 2016) and optimising production efficiency (Eckard et al. 2010).
Presently, there are limited assessments of emissions from different dairy systems in northern Victoria, apart from Christie et al. (2012) and Gollnow et al. (2014), despite this being an important assessment to establish baseline/benchmark and support decision-making in sustainable dairy production. Further, apart from estimating the annual CH4 emissions, the profiling of seasonal CH4 emission changes on a farm is also an important aspect to be considered (Orcasberro et al. 2021). Such information provides the opportunity to utilise different mitigation strategies at different times of the year by using locally available resources (e.g. tannin-containing grape marc is produced in autumn and summer in Australia; Wu et al. 2022). Therefore, the aim of this study was to estimate lactating dairy cows’ annual and seasonal enteric-CH4 emissions by using a case study approach in northern Victoria.
Materials and methods
This study was conducted to estimate the enteric-CH4 emissions and its intensity differences of lactating dairy cows (except dry cows and replacement stocks) in northern Victoria. To achieve this, four case-study farms (Farms A, B, C and D) with diverse feeding strategies were investigated. A purposive sampling method was used to select case-study farms with available data to ensure that the diverse feeding systems in northern Victoria were covered. The case-study farms were classified into the Australian five farm-feeding systems (Table 1) on the basis of the amount of pasture and concentrate feeding and feeding infrastructure on the farm (Wales and Kolver 2017). According to the classifications, Farm A showed characteristics between two consecutive systems as a result of feed availability in different seasons. For instance, Farm A showed several characteristics of Feeding-system 4 during winter and spring. However, during summer and autumn, the milking herd was fed with the total mixed ration (i.e. Feeding-system 5; Table 1).
| Farm | System | Characteristics of the feeding system | |
|---|---|---|---|
| Farm A | System 4–5 | Offers TMR and grazing (annual ryegrass from June to October) | |
| Fully TMR (from November to May) | |||
| The herd is split into high- and low-production groups, separated by stages of lactation and litres produced | |||
| The cows producing 40 L or more (the high-producing cows) are milked three times a day, housed in the barn and are given the greatest-quality rations compared with low-producing cows | |||
| Farm B | System 4 | Pasture grazing (Italian rye/Shaftal clover) for ~ 9 months/year (from April to November/December) | |
| PMR on feed pad and grain-fed during milking | |||
| Farm C | System 2 | Pasture grazing most of the year (perennial ryegrass/white clover), forages during summer (sorghum and lucerne) and ~2.5 t DM/head.year grain fed during milking | |
| Hay fed year-round (except October) and silage fed from April to June | |||
| Farm D | System 2 | Pasture grazing (annual ryegrass and Shaftal clover, grazing barley, and grazing wheat) from April to November), ~2.2 t DM/head.year grains fed during milking | |
| Hay fed year-round, and silage fed from October to January |
TMR, total mixed ration; PMR, partial mixed ration; DM, dry matter.
Along with the different feeding systems used on the case-study farms, there were differences in herd size, calving patterns, concentrate feeding levels, cow liveweight and milk production (Table 2). In general, the more intensive feeding systems (Farms A and B) had larger herd sizes and greater milk production per cow than did the pasture-based feeding systems (Farms C and D).
| Characteristic | Farm A | Farm B | Farm C | Farm D | |
|---|---|---|---|---|---|
| Milking herd size | 853 | 720 | 105 | 276 | |
| Breed | Holstein | Holstein | Holstein | Holstein | |
| Jersey | Jersey | ||||
| Aussie Red | |||||
| Concentrate/TMR feeding (t DM/cow.year) | 8.7 (TMR) | 2.5 | 2.5 | 2.2 | |
| Calving pattern | Year-round calving | Split calving | Split calving | Split calving | |
| Average liveweight (kg) | 693 | 579 | 623 | 535 | |
| Average winter MP (kg/head.day) | 26.1 | 28.6 | 22.2 | 22.6 | |
| Average spring MP (kg/head.day) | 28.2 | 28.9 | 25.4 | 28.9 | |
| Average summer MP (kg/head.day) | 28.6 | 26.7 | 23.5 | 21.6 | |
| Average autumn MP (kg/head.day) | 26.4 | 25.4 | 22.9 | 19.0 | |
| Average MP (kg/head.day) | 27.3 | 27.4 | 23.5 | 23.0 |
DM, dry matter; TMR, total mixed ration; MP, milk production.
The Australian National Greenhouse Gas Inventory (NGGI) methodologies and algorithms (Department of Environment and Energy 2017) were used to estimate enteric-CH4 emissions. A simple and comprehensive spreadsheet was developed to collect all possible data that can be used for estimating enteric CH4. The spreadsheet was mainly categorised into two groups, as follows.
Herd structure and milk production data – liveweight (kg/head), number of lactating cows (heifers and cows), monthly average milk production (L/month), monthly average milk fat (%) and milk protein (%) content
Feed-quality and -quantity data – feed types, allocation per feed type (t/month), wastage%, dry matter (DM) %, metabolisable energy (ME) content (MJ ME/kg DM), feed refusal (%)
Data from farm records for the 12-month period (June 2019–May 2020), which represent the whole four seasons (winter, spring, summer and autumn) consecutively, were used. Quality of the pasture and supplementary feeds (metabolisable energy content of the feed (MJ ME/kg DM) were provided by the farmers. Specifically, seasonal pasture-quality changes were estimated by the farmers on the basis of their experience. The liveweight gain of cows was assumed as 0 kg/head.day by assuming that any weight loss during the post-calving period was gained during the mid- to late-lactation period. Therefore, the net weight gain of the cows over a 1-year period was considered as zero (Christie et al. 2012). The dry-matter intake of a cow was calculated using the following equation:
where DMI = dry-matter intake (kg DM/head.day); W = live weight of a cow (kg); LWG = liveweight gain (kg/head.day); MR = increase in metabolic rate of the cow when producing milk (1.1); MI = additional intake for milk production (kg DM/head.day; Eqn 2).
where MP = milk production (kg/head.day); NE = net energy (3.054 MJ/kg milk; Standing Committee on Agriculture 1990); k = efficiency of use of feed ME for milk production (0.6); q = metabolisability of the diet (Eqn 3).
where MDMD = mean dry matter digestibility (%).
Mean dry-matter digestibility estimation (Minson and McDonald 1987)
where, DMD = dry-matter digestibility (%); ME = metabolisable energy content of the feed (MJ ME/kg DM).
Eqn 4 was used to find the DMD (%) of each feed component. Then MDMD (%) was obtained using approximate DMI of each feed type (kg DM/day.head) and their DMD (%). MDMD (%) was used to find the metabolisability of the diet (q) in Eqn 3.
The enteric-CH4 emissions of a lactating cow were estimated using the following equation published in Charmley et al. (2016), which is included in the Australian NGGI approach:
where DMI = dry-matter intake.
Then, seasonal estimated enteric-CH4 emissions (g CH4/head.day) values were converted to carbon dioxide equivalent (CO2e) by multiplying the global warming potential of the CH4 (i.e. 28; Eqns 1, 2, 3, and 5 were based on Australian Government Department of Industry, Science, Energy and Resources 2021).
The International Dairy Federation (IDF) equation was used to correct milk volume to a standard of 4.0% fat and 3.3% protein content (IDF 2015), as follows:
Enteric-CH4 emissions of lactating dairy cows in each farm were divided by fat- and protein-corrected milk (FPCM; kg/year) to get the enteric-CH4 EI.
Results
Dry-matter intake and relative differences of the feed quality
Lactating dairy cows on Farms A and B showed greater DMI than did those on Farms C and D, on average. Across the four seasons, the greatest relative difference in DMI was reported on Farm D (23.9%), while the smallest relative difference was on Farm B (4.5%). Moreover, the average DMD% of feed was greatest on Farm C, followed by Farms A, B and D. The greatest relative difference of feed DMD% was reported in Farm C (6.4%) and the smallest relative difference in feed DMD% was reported in Farm B (2.4%; Table 3).
| Farm | Winter | Spring | Summer | Autumn | |||||
|---|---|---|---|---|---|---|---|---|---|
| DMI | DMD% | DMI | DMD% | DMI | DMD% | DMI | DMD% | ||
| A (System 4–5) | 21.9 | 79.5 | 22.9 | 78.9 | 23.4 | 77.1 | 22.4 | 76.8 | |
| B (System 4) | 22.8 | 75.3 | 22.8 | 75.8 | 22.2 | 73.9 | 21.2 | 75.8 | |
| C (System 2) | 19.3 | 79.6 | 20.5 | 81.2 | 20.6 | 76.1 | 20.3 | 77.8 | |
| D (System 2) | 19.6 | 74.5 | 23.0 | 72.3 | 19.3 | 74.0 | 18.1 | 74.3 | |
DMI, dry matter intake (kg/head/day); DMD, dry matter digestibility (%).
Emissions per lactating dairy cow
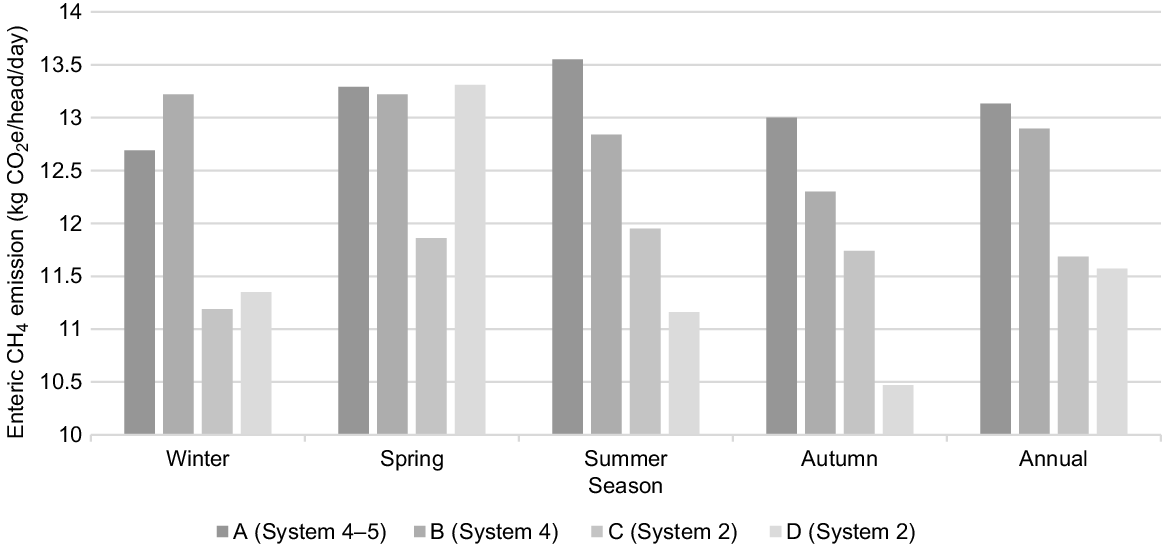
Annual average enteric-CH4 emissions of Farms A and B (13.13 and 12.9 kg CO2e/head.day) were comparatively greater than those of Farms C and D (11.69 and 11.57 kg CO2e/head.day; Fig. 1). According to the seasonal breakdown of the emissions, Farms A and C showed their smallest enteric-CH4 emissions during winter, while Farms B and D showed their smallest in autumn. In contrast, Farms A and C showed their greatest emissions in summer, while Farm D had its greatest during spring. Notably, Farm B emissions were largest during both winter and spring (Fig. 1).
Enteric-methane emission intensity (EI)
Average annual enteric-CH4 EI (kg CO2e/kg FPCM) was 6.3% and 4.3% greater on Farms C and D respectively, than on Farms A and B (Table 4). The greatest relative seasonal difference ((maximum seasonal EI − minimum seasonal EI)/((maximum EI + minimum EI)/2) × 100/1) of EI on Farms A, B, C and D was 2.2%, 8.7%, 12.2% and 14.1% respectively. Overall, Farms B, C and D reported greater relative differences in enteric-CH4 EI than did Farm A (Table 4). According to the seasonal breakdown, Farms A and D showed their greatest EI during winter, while Farms B and C showed their greatest EI during spring and summer respectively. In contrast, Farm A showed its smallest EI in all other three seasons. Farm B showed its smallest during both summer and autumn, while both Farms C and D showed their smallest during spring.
Discussion
The enteric CH4 is considered as the largest single source that contributes to the total on-farm greenhouse-gas emissions (Charmley et al. 2016). Therefore, monitoring, evaluation, and mitigation of enteric-CH4 emissions from lactating dairy cows are of great importance to emissions management on farms. In the present study, the enteric-CH4 emission factors of all four case-study farms were between 136.5 kg CH4/head.year and 176.6 kg CH4/head.year. This is similar to the findings of Gollnow et al. (2014), who collected data from 139 dairy farms across major dairy regions in Australia. That study estimated the enteric-CH4 emissions of an Australian milking cow as 122 kg CH4/head.year, ranging from 80 kg CH4/head.year to 175 kg CH4/head.year. Despite such similar results found between the present study and Gollnow et al. (2014), it is important to note that some of the methodologies and algorithms were different between the two studies. This is because methodologies and algorithms continuously update with the new research findings to support the precise estimation of CH4 (Christie et al. 2016). This highlights future research directly comparing literature and the latest study result should consider standardising calculations/models.
The absolute enteric-CH4 emissions were greater on Farms A and B than on Farms C and D. This is because of the greater DMI of the animal as a result of the greater level of milk production in Farms A and B than in Farms C and D (Table 2). Notably, O’Neill et al. (2011) reported that TMR-fed cows produced 45% greater enteric CH4 (g/cow.day) than did the dairy cows grazing perennial ryegrass. The same study also highlighted that this occurs at the expense of DMI and milk yield. Moreover, in the current study, seasonal enteric-CH4 emissions also showed differences among farming systems due to changes in milk production and feed quality.
Enteric-CH4 EI of the lactating dairy cow in the case-study farms of this study varied from 0.44 kg CO2e/kg FPCM to 0.53 kg CO2e/kg FPCM, across the seasons and among the farming systems. These findings fit into the range was found by Christie et al. (2012) and also the findings of Gollnow et al. (2014). According to Christie et al. (2012), enteric-CH4 EI of Australian dairy farms varied from 0.39 kg CO2e/kg FPCM to 0.88 kg CO2e/kg FPCM. The findings of this study fitted into the lower end of the enteric-CH4 range of Christie et al. (2012). This is because Christie et al. (2012) studied all stock classes in dairy farms, rather than depending only on the milking herd to find enteric-CH4 EI as was the method in this study. Also, it is important to note that Christie et al. (2012) studied only Farming-systems 1–3 in the Australian five farm feeding-system classification as less than 10% of farms were recognised as Feeding-system 4–5 during that time. There are differences in enteric-CH4 emissions and their intensities among the farms. Exploring the reasons for these differences will be important for finding potential mitigation strategies effectively. Importantly, the quality of the farm data is vital for the accuracy of the enteric-CH4 estimation. This emphasises the need for farmers to increase the quality of the record-keeping on the amount of feed, feed wastage and changes in the quality of supplementary feed and pasture. It is important to assist farmers by providing a set of guidelines for future record keeping for the purpose of estimating enteric-CH4 emissions. It will help farmers monitor and reduce seasonal enteric-CH4 emissions. Further, quality records will improve the accuracy of future research to a greater extent.
Under the Paris Agreement, the overall goal is to reduce absolute emissions so as to keep the increase in temperature below 1.5°C compared with the pre-industrial levels (Allen et al. 2018). Notably, 195 countries, including Australia, committed to achieving these targets, which will require a reduction in overall emissions, including enteric CH4. Therefore, on the basis of the findings of this study, pasture-based systems (Farm C and D) have an advantage over more intensive feeding systems (Farm A and B) in the future, because they have lower enteric-CH4 emissions. Importantly, the systems need to be designed to reduce absolute emissions at a greater rate than the milk production increases. By doing so, not only will absolute emissions fall, but also the EI will reduce.
The current study used the NGGI methodology-based equation (CH4 emissions = 20.7 × DMI), which was developed using a dataset from cattle fed with forage-based diets (forage >70%), including dairy cattle fed with temperate forages, beef cattle fed with temperate forages and beef cattle fed with tropical forages (Charmley et al. 2016). However, different studies reported different coefficient values. For instance, Moate et al. (2016) reported the coefficient value as 21.1 g CH4/kg DMI for dairy, which was found using a dataset from 220 Holstein-Friesian cows from eight experiments. Dijkstra et al. (2011) reported a value of 23.1 g CH4/kg DMI for the coefficient for dairy cows in Netherlands, while Hristov et al. (2013) derived a coefficient value of 19.14 g CH4/kg DMI, which is lower than the above coefficient values, which is likely to be due to high-concentrate diets fed. This showed that the diets used in different systems could lead to different coefficients, which then could change the magnitude of the enteric-CH4 emissions and CH4 EI. Since most of the diets in this study were based on the forages (including pasture, hay and silage), using the same NGGI emissions factor was considered appropriate.
In conclusion, in the NGGI methodology, DMI is the biggest driver of enteric CH4 (20.7 × DMI); and the DMI of a lactating cow is a function of liveweight, liveweight gain and milk production in the model. Therefore, Farms A and B utilising Feeding-system 4–5 with a larger body mass and greater-producing cows produced more CH4 (kg CO2e/head.day), but with less CH4 per unit of product than did the pasture-based systems in Farms C and D. These case-study findings suggest that to reduce EI requires a move towards Feeding-system 4–5 with a greater production per cow. However, there is an imperative for dairy to reduce absolute enteric-CH4 emissions to be consistent with the Paris Agreement targets, which can be achieved through pasture-based lower-input system (Feeding-system 2). However, Feeding-system 4–5 can be included in targeted mitigation strategies, if they are required to reduce absolute CH4 emissions. Importantly, enteric-CH4 emissions and EI are not only about the feeding system, but they are also about milk production and characteristics of the animal (i.e. liveweight in this study). Estimation of seasonal enteric CH4 and intensities using on-farm data will allow farmers to identify their existing level of CH4 emissions to plan specific mitigation strategies that fit the particular season. However, more research will be required to check the feasibility of doing this. Furthermore, it is important extend further research towards a cradle-to-farm-gate life-cycle analysis, as this framework provides a holistic picture of the GHG profile of a whole farming system, which will help implement targeted mitigation strategies.
References
Agriculture Victoria (2021) Victorian dairy industry fast facts. Available at https://agriculture.vic.gov.au/__data/assets/pdf_file/0011/698771/Dairy_Fast-Facts_June-2021_Final_v2.pdf [verified 7 March 2023]
Allen MR, Babiker M, Chen Y, de Coninck H, Connors S, van Diemen R, Dube OP, Ebi KL, Engelbrecht F, Ferrat M, et al. (2018) Summary for policymakers. In ‘Global Warming of 1.5°C: an IPCC Special Report on the impacts of global warming of 1.5°C above pre-industrial levels and related global greenhouse gas emission pathways, in the context of strengthening the global response to the threat of climate change, sustainable development, and efforts to eradicate poverty’. (Eds V Masson-Delmotte, P Zhai, H-O Pörtner, D Roberts, J Skea, PR Shukla, A Pirani, W Moufouma-Okia, C Péan, R Pidcock, S Connors, JBR Matthews, Y Chen, X Zhou, MI Gomis, E Lonnoy, T Maycock, M Tignor, T Waterfield). (IPCC)
Australian Government Department of Industry, Science, Energy and Resources (2021) Quarterly update of Australia’s national greenhouse gas inventory: December 2021. Available at https://www.dcceew.gov.au/sites/default/files/documents/nggi-quarterly-update-december-2021.pdf [verified 15 August 2022]
Charmley E, Williams SRO, Moate PJ, Hegarty RS, Herd RM, Oddy VH, Reyenga P, Staunton KM, Anderson A, Hannah MC (2016) A universal equation to predict methane production of forage-fed cattle in Australia. Animal Production Science 56, 169-180.
| Crossref | Google Scholar |
Christie KM, Gourley CJP, Rawnsley RP, Eckard RJ, Awty IM (2012) Whole-farm systems analysis of Australian dairy farm greenhouse gas emissions. Animal Production Science 52, 998-1011.
| Crossref | Google Scholar |
Christie KM, Rawnsley RP, Phelps C, Eckard RJ (2016) Revised greenhouse-gas emissions from Australian dairy farms following application of updated methodology. Animal Production Science 58, 937-942.
| Crossref | Google Scholar |
Dairy Australia (2022) Annual Report. Available at https://www.dairyaustralia.com.au/about/strategy-and-performance/annual-report#.Y_f0oHZBw2x [verified 24 February 2023]
Department of Agriculture and Water Resources ABARES (2020) About my region – Victoria – agricultural sector. Available at https://www.agriculture.gov.au/abares/research-topics/aboutmyregion/vic#agricultural-sector [verified 5 November 2020]
Department of Environment and Energy (2017) National inventory report. Available at https://www.industry.gov.au/sites/default/files/2020-07/national-inventory-report-2017-volume-1.pdf [verified 23 August 2020]
Dijkstra J, Van Zijderveld SM, Apajalahti JA, Bannink A, Gerrits WJJ, Newbold JR, Perdok HB, Berends H (2011) Relationships between methane production and milk fatty acid profiles in dairy cattle. Animal Feed Science and Technology 166–167, 590-595.
| Crossref | Google Scholar |
Eckard RJ, Grainger C, de Klein CAM (2010) Options for the abatement of methane and nitrous oxide from ruminant production: a review. Livestock Science 130, 47-56.
| Crossref | Google Scholar |
Gollnow S, Lundie S, Moore AD, McLaren J, van Buuren N, Stahle P, Christie K, Thylmann D, Rehl T (2014) Carbon footprint of milk production from dairy cows in Australia. International Dairy Journal 37, 31-38.
| Crossref | Google Scholar |
Hristov AN, Oh J, Lee C, Meinen R, Montes F, Ott T, Firkins J, Rotz A, Dell C, Adesogan A, Ang WZ, Tricarico J, Kebreab E, Waghorn GC, Dijkstra J, Oosting S (2013) ‘Mitigation of greenhouse gas emissions in livestock production: a review of technical options for non-CO2 emissions.’ FAO Animal Production and Health. Paper no. 177. (Eds P Gerber, B Henderson, H Makkar) (FAO: Rome, Italy)
International Dairy Federation (2015) A common carbon footprint approach for the dairy sector. International Dairy Federation. Available at https://www.fil-idf.org/wp-content/uploads/2016/09/Bulletin479-2015_A-common-carbon-footprint-approach-for-the-dairy-sector.CAT.pdf [verified 23 September 2020]
Johnson KA, Johnson DE (1995) Methane emissions from cattle. Journal of Animal Science 73, 2483-2492.
| Crossref | Google Scholar |
Miller GD, Auestad N (2013) Towards a sustainable dairy sector: leadership in sustainable nutrition. International Journal of Dairy Technology 66, 307-316.
| Crossref | Google Scholar |
Minson DJ, McDonald CK (1987) Estimating forage intake from the growth of beef cattle. Tropical Grasslands 21, 116-122.
| Google Scholar |
Moate PJ, Deighton MH, Williams SRO, Pryce JE, Hayes BJ, Jacobs JL, Eckard RJ, Hannah MC, Wales WJ (2016) Reducing the carbon footprint of Australian milk production by mitigation of enteric methane emissions. Animal Production Science 56, 1017-1034.
| Crossref | Google Scholar |
O’Neill BF, Deighton MH, O’Loughlin BM, Mulligan FJ, Boland TM, O’Donovan M, Lewis E (2011) Effects of a perennial ryegrass diet or total mixed ration diet offered to spring-calving Holstein-Friesian dairy cows on methane emissions, dry matter intake, and milk production. Journal of Dairy Science 94, 1941-1951.
| Crossref | Google Scholar |
Orcasberro MS, Loza C, Gere J, Soca P, Picasso V, Astigarraga L (2021) Seasonal effect on feed intake and methane emissions of cow–calf systems on native grassland with variable herbage allowance. Animals 11, 882.
| Crossref | Google Scholar |
Wales WJ, Kolver ES (2017) Challenges of feeding dairy cows in Australia and New Zealand. Animal Production Science 57, 1366-1383.
| Crossref | Google Scholar |
Wood M, Wang QJ, Bethune M (2007) An economic analysis of conversion from border-check to centre pivot irrigation on dairy farms in the Murray Dairy Region, Australia. Irrigation Science 26, 9-20.
| Crossref | Google Scholar |
Wu H, Zhang P, Zhang F, Shishir MSR, Chauhan SS, Rugoho I, Suleria H, Zhao G, Cullen B, Cheng L (2022) Effect of grape marc added diet on live weight gain, blood parameters, nitrogen excretion, and behaviour of sheep. Animals 12, 225.
| Crossref | Google Scholar |