

Quantification of relative stock units for horses to permit correct application within pasture-based production systems
Y. Y. Chin A * , P. J. Back B , E. K. Gee A , D. J. Horne B and C. W. Rogers A B
A School of Veterinary Science, Massey University, Private Bag 11-222, Palmerston North 4474, New Zealand.
B School of Agriculture and Environment, Massey University, Private Bag 11-222, Palmerston North 4474, New Zealand.
Abstract
Overseer® is the primary software tool used to estimate farm-level nutrient cycle and management for regulatory purposes in New Zealand. The model compares feed demand among different livestock by using ‘revised stock units’ (RSUs, the annual energy requirement of a mature ewe to raise a single lamb to weaning; 6000 MJ metabolisable energy). The RSUs for several common equine stock classes are not yet available, while those currently available within the model are based on the linear scaling of feed demand to liveweight, which does not consider allometric scaling of metabolism to liveweight or the differences in digestive physiology and nutrient metabolism between ruminants and monogastric hindgut fermenters (horses).
To compare the current RSU values used in Overseer® for different equine stock classes, with the equineRSU values calculated using equine-specific models.
Weighted average estimates of the bodyweight for the different equine livestock classes were calculated from the published literature. These weighted average estimates of bodyweight were used to estimate the energy requirements on the basis of data published by National Research Council. The resulting dry-matter intake and N intake from the equineRSU values and the current RSU values in use within Overseer® were modelled using published data on diet composition, crude protein content and the digestibility of the different feeds offered.
The current RSUs in Overseer were 2.5–6.8 units higher than the equineRSU values obtained from the equine-specific models. This overestimation in feed demand resulted in N-intake estimates at an animal level being 52–108% higher than values derived using the equine-specific estimates.
The use of RSUs based on linear scaling of feed demand from ruminants on the basis of liveweight overestimates feed demand and N intake in horses. If horses are to be included within nutrient management models, feed demand must be based on published equine data for energy requirements to avoid over-inflation of N excretion. The equineRSUs calculated in this study reduce the risk of over-inflation of N intake and excretion, and subsequently the N leaching estimations.
Failure to accurately model feed demand of horses within nutrient management software would unfairly compromise stocking density and horse management on large commercial breeding farms. The implication for these errors on economic impact and restricted livestock number is greatest for the Thoroughbred breeding industry due to the scale of the operations.
Keywords: animal production, horses, modelling, nitrogen, nitrogen intake, nitrogen leaching, nutrient budget, nutrient management, nutrition.
Introduction
The stock unit (SU) system was first used in New Zealand agriculture as a guide to the production capacity of different landscapes and later as a tool to assess on-farm economic performance and has been adopted for various applications (i.e. between- and within-farm comparison, rural valuation, and farm-system analysis; Parker 1998). A single stock unit represents the annual feed demand of a 54 kg ‘standard ewe’ producing a single lamb to weaning (consuming 570–600 kg dry matter; Parker 1998). This base unit is then converted for different livestock classes and species to express the relative difference in feed demand compared with the ‘standard ewe’. The use of a stock unit permits relative comparison of feed demand by different classes of livestock and enables comparison within, and among farm systems. In part, because of this ability to use stock units to compare across livestock classes, it is frequently used as a metric by industries and enterprises where land and system productivity is important (Parker 1998). However, the stock unit is not traditionally used by the equine industry, where feed conversion efficiency and comparison of system productivity have not been the primary consideration (Rogers et al. 2017).
A modification of the SU, the revised stock unit (RSU), is used within Overseer® (Wheeler 2018a), which is the primary software tool used to estimate nutrient management at farm level for regulatory purposes in New Zealand. The RSU is the same as SU in that it represents annual feed requirement for a 54 kg ewe to rear a single lamb to weaning. However, with the RSU, this requirement is expressed in terms of megajoules (MJ) of metabolisable energy (ME) (6000 MJ ME/year) rather than on a dry-matter (DM) basis as the ME of pasture varies among regions, season and farm systems (Wheeler 2018a). This approach theoretically provides a more robust ability to compare among livestock classes and species. Within Overseer®, this value, along with the nutrient and energy content of the feed, contributes to the estimation of nutrients consumed and excreted by the animals, which influences the nutrient leaching estimation on a farm (Wheeler 2018a, 2018b).
Within the Overseer® farm model, horses are considered as an upscaled ruminant on the basis of bodyweight differences in relation to a ‘standard ewe’ (Chin et al. 2019a). This effectively assumes a linear increase in energy requirement and thus feed demand with increased liveweight, but fails to account for metabolic scaling (Kleiber 1947; West et al. 2002) or the difference in energy requirements for various physiological processes (growth, exercise, lactation, pregnancy; NRC 2007). There are also differences in nutrient metabolism and utilisation of nutrients between horses (a mono-gastric hindgut fermenter) and ruminants (Leng 2018). In horses, significant digestion and absorption of nutrients (protein, carbohydrates and fats) can occur in the small intestine, followed by further fermentation in the hindgut (Santos et al. 2011; Trottier et al. 2016; Trottier and Tedeschi 2019). In contrast to ruminants, horses cannot utilise hindgut microbial protein or recycle non-protein N (Santos et al. 2011; Trottier et al. 2016; Trottier and Tedeschi 2019). Previous deterministic modelling has identified that at a per kilogram liveweight basis there are significant differences in protein digestibility and N utilisation between horses and ruminants, particularly sheep (Chin et al. 2019b). Therefore, the current approach used to assign RSU within the Overseer model can lead to overestimation of nutrient intake and excretion in horses, and, thus, potential nutrient leaching from equine properties.
Within New Zealand, approximately half the equine population is associated with the Thoroughbred and Standardbred racing industries and thereby has a commercial focus. The temperate climate of New Zealand is reflected in a commercial equine management system that is pasture-based, with commercial Thoroughbred breeding farms managing over 370 mares during the breeding season on up to 526 ha (Rogers et al. 2007). Similar to the distribution observed in many countries, the New Zealand Thoroughbred breeding industry is concentrated in a small geographical area (south of Auckland and within the Waikato basin; Gee et al. 2020). This concentration of breeding farms means that regulatory change in relation to nutrient management on Thoroughbred breeding farms within this region would have a major effect on the New Zealand commercial Thoroughbred breeding industry. Currently, within Overseer®, horses are classified on the basis of type (pony, broodmare with foal, hack, or yearling), size (small (up to 15.2 hands) or large (500–600 kg)) and activity levels (turned out or light work), with an option to enter user-defined RSU (Wheeler 2018a). Options for other common equine classes such as pregnant broodmare, weanlings, breeding stallions, sport horses and racing Thoroughbreds are not yet available, or do not have the appropriate data collated so that valid RSU could be easily found and utilised within the model by end-users.
The aim of this paper was to model the relative stock units (RSUs) assigned for the different equine livestock classes commonly used within nutrient management software as well as other common equine stock classes in New Zealand by using published literature. These estimated RSUs were then compared with the values previously proposed and the implication on the estimations of N intake at animal level were quantified, as these will influence the N excretion and, subsequently, N leaching estimations by the Overseer® model.
Materials and methods
Published data for the feeding, management and bodyweight of the common equine stock classes in New Zealand were retrieved from a series of recent reviews (Bolwell et al. 2020; Gee et al. 2020; Rogers et al. 2020). Using a snowballing approach, studies cited in the reviews, or citing the reviews, were identified within Google scholar, to find any additional articles publishing horse bodyweight data. These data were supplemented by a structured literature search within Web of Science by using the keywords ‘bodyweight’, ‘horses’ to identify studies that reported bodyweight of horses. Studies were prioritised on the basis of the following criteria: published within the past 40 years, reported values for populations from New Zealand (using additional keyword ‘New Zealand’) or from other comparable pasture-based production systems, sample size of five or greater and from population/horses that were clinically normal. There was no restriction for the country of origin for the study on papers reporting values for the racing breeds (Thoroughbred and Standardbred, identified using additional keywords ‘Thoroughbred’, ‘Standardbred’). Overseas studies were included when there were no comparable New Zealand data available.
Weighted average bodyweight and pooled standard deviation for the different equine livestock classes were calculated using the published data (Table 1). Pooled standard deviation was calculated using the following formula: (s.d.2 × (n − 1))/(n − 1). When standard error, instead of standard deviation, was provided with the estimate of the mean, the standard error was obtained as follows: s.e. × √n.
| Study | Country | Breed | Stock class | BWT (mean) | s.d. | s.e. | n | |
|---|---|---|---|---|---|---|---|---|
| Santschi and Papich (2000) | USA | TB and QH | Lactating, 1–4 weeks after parturition | 518 | 26 | 7 | ||
| Grace et al. (1999) | New Zealand (NZ) | TB | Lactating, soon after parturition | 522 | 42.6 | 21 | ||
| Pagan et al. (2006) | USA | TB | Lactating, 1–5 months | 578 | 32.38 | 3909 | ||
| Grace et al. (1999) | NZ | TB | Lactating, 5th month | 537 | 38.49 | 8 | ||
| Santschi and Papich (2000) | USA | TB and QH | Late gestation | 578 | 33 | 7 | ||
| Bene et al. (2013) | Hungary | TB | Non-lactating | 542 | 39.45 | 110 | ||
| Williamson (2006) | NZ | TB | Racehorse | 430 | 6.14 | 14 | ||
| Ikeda et al. (2019) | Japan | TB | Racehorse | 469 | 30 | 584 | ||
| Tozaki et al. (2017) | Japan | TB | Racehorse, 2-year old | 468 | 26.1 | 535 | ||
| Tozaki et al. (2017) | Japan | TB | Racehorse, 3-year old | 473 | 28 | 851 | ||
| Tozaki et al. (2017) | Japan | TB | Racehorse, 4-year old | 478 | 27.6 | 734 | ||
| Cho et al. (2008) | Korea | TB | Racehorse | 448 | 28.77 | 8197 | ||
| Assenza et al. (2012) | Italy | TB | Race training, 2-year old | 380 | 15 | 17 | ||
| Connysson et al. (2010) | Sweden | SB | Race training | 511 | 12 | |||
| Leleu and Cotrel (2006) | France | SB | Race training | 466 | 38 | 24 | ||
| Zucca et al. (2008) | Italy | SB | Race-fit | 435 | 36 | 30 | ||
| Assenza et al. (2012) | Italy | SB | Race training 3–4 years old | 400 | 50 | 15 | ||
| Gauvreau et al. (1995) | Canada | SB | Racing | 410 | 14 | 5 | ||
| Waller and Lindinger (2006) | Canada | SB | Race-fit, 3-year olds | 481 | 47 | 13 | ||
| Buhl et al. (2013) | Sweden | SB | Race training | 510 | 34 | 30 | ||
| Gordon et al. (2007) | New Jersey, USA | SB | Race-fit | 475 | 34 | 34 | ||
| Piccione et al. (2005) | Italy | SB | Race-fit | 430 | 20 | 10 | ||
| Beaumier et al. (1987) | Canada | SB | Race-fit | 423 | 21 | 12 | ||
| Verhaar et al. (2014) | NZ | Sport horses | 533 | 5 | 158 | |||
| Fernandes et al. (2015) | NZ | Recreational horses | 547 | 67 | ||||
| Fernandes et al. (2015) | NZ | Ponies | 5 | 313 | ||||
| Dugdale et al. (2011) | Great Britain | Ponies (summer) | 246 287.8 | 50 32 | 10 | |||
| Dugdale et al. (2011) | Great Britain | Ponies (winter) | 219 259.6 | 20 19.57 | 10 | |||
| Martinson et al. (2014) | USA | Multiple breeds | Pony | 328 | 76 | 53 | ||
| Hoffmann et al. (2013) | Iceland | Icelandic | Pony | 378.92 | 25.59 | 13 | ||
| Watson et al. (1993) | UK | Shetland | Pony mares | 220 | 27 | 6 | ||
| Pagan et al. (2009) | USA | Pony hunters | 352.3 | 11.73 | 23 | |||
| Brown-Douglas and Pagan (2009) | Global | TB | Weanlings | 248.1 | 1.8 | 925 | ||
| Grace et al. (2003) | NZ | TB | Weanlings | 261 | 4.8 | 17 | ||
| Brown-Douglas and Pagan (2009) | Global | TB | Yearlings | 357.5 | 3.9 | 925 | ||
| Grace et al. (2003) | NZ | TB | Yearlings | 377 | 18.3 | 17 |
Energy requirement
The energy requirement of common stock classes kept on Thoroughbred stud farms, racehorses, sport horses and recreational horses were modelled using the obtained weighted average bodyweights from the structured literature search and equine-specific equations from NRC (2007). The equations and input values used to calculate the energy requirement for each equine livestock class are presented in Table 2. The energy requirement of horses is presented as digestible energy (MJ DE) in NRC (2007). Thus, the ME requirement (MJ ME) was obtained by multiplying DE by 1.16, assuming the urine and methane loss in horses was 16% (Chin 2018).
| Stock class | ||
|---|---|---|
| Horses/ponies/dry mare turned out | DE maintenance = 0.139 MJ DE/kg BWT | |
| Horses (light work) | DE maintenance × BWT × 1.2 Light work = mean heart rate 80 beats/min over entire exercise bout, 1–3 h per week, recreational riding, beginning of training program, show horses (occasional). | |
| Broodmare lactation | DE maintenance (lactation) + ((milk yield × GE(milk))/0.6] | |
| DE maintenance (lactation) = 0.152 MJ/kg BWT | ||
| Milk yield (kg milk/day) = a × d0.0953 × e−0.043d a = 0.0274287 × mature weight (kg) d = day of lactation | ||
| Gross energy (milk): 500 kcal/kg milk = 2.09 MJ/kg milk | ||
| Efficiency of DE for milk production: 0.6 (60%) | ||
| Broodmare pregnancy | DE maintenance + DE (maintenance accrued feto-placental tissue + DE feto-placental tissue gain) | |
| DE (maintenance accrued feto-placental tissue) = 66.6 kcal/kg tissue = 0.279 MJ/kg tissue | ||
| [(FP(lipid) × ADG (kg) × GE(lipid) (Mcal)) + [(FP(protein) tissue × ADG (kg) × GE(protein))] / 0.6 FP: 1 unit feto-placental tissue = 20% protein, 3% lipid (0.2 and 0.03) GE content (protein) = 5.6 kcal/g = 0.0234 MJ/g GE content (lipid) = 9.4 kcal/g = 0.0393 MJ/g Efficiency of DE for tissue deposition = 0.6 (60%) | ||
| Fetal weight (kg) = %birthweight × birthweight (kg) | ||
| %birthweight = 1 × 107X3.5512 (R2 = 0.929), X = days of gestation Birthweight = 0.097 × maternal BWT (kg) | ||
| Placental tissue and uterine development: 0.09 g/kg BWT per day | ||
| Foal up to weaning | RSU = energy intake 1–5 months of age (MJ ME)/6000 Energy intake 1–5 months of age (MJ ME) = ∑1–5 months [DMI (kg DM) × Pasture ME (10 MJ ME/kg DM) × 30] DMI (kg DM) = BWT × DMI % BWT | |
| DMI % BWT: 1 month = 0% 2 months = 0.12% 3 months = 0.40% 4 months = 0.74% 5 months = 1.17% BWT of Thoroughbred foals from 1 to 5 months of age obtained from Huntington et al. (2020). DMI % BWT estimated using pasture intake data obtained from Bolzan et al. (2020) divided by BWT of foals. Bodyweight of foals (Criollo) in Bolzan et al. (2020) was estimated using growth curved expressed in % mature BWT (NRC 2007) assuming mature weight of 454 kg. | ||
| Growing horses (6–12 months) | (56.5X−0.145) × BWT + (1.99 + 1.21X – 0.021X2) × ADG X = age in months, ADG = average daily gain in kilograms BWT: growth from 6 to 12 months modelled using ADG and weanling weight (248 ± 54.33) as starting weight. ADG obtained from (Pagan et al. 1996; Brown-Douglas 2003; Grace et al. 2003; Brown-Douglas and Pagan 2009) | |
| Sporthorse | DE maintenance × BWT × 1.4 Moderate work = mean heart rate 90 beats/min over entire exercise bout, 3–5 h per week, school horses, training/breaking, show horses, polo, ranch work (NRC 2007). | |
| Racing TB | DE maintenance × BWT × 1.9 Heavy work = mean heart rate 110–150 beats/min over entire exercise bout, racing, Elite 3 day event (NRC 2007). |
Equations and values used were obtained from NRC (2007) unless indicated otherwise in the table.
DE, digestible energy; BWT, bodyweight; DMI, dry-matter intake; GE, gross energy; ME, metabolisable energy.
Equine revised stock unit (equineRSU)
For each equine stock class, using the weighted average value previously calculated, the estimated daily energy requirement (MJ ME) was derived using the published equations (NRC 2007) and multiplied by 365 to obtain the ME requirement per annum. This value was divided by 6000 to obtain the equineRSU.
To account for a Thoroughbred broodmare producing a single viable foal and nursing the foal through to weaning, the calculation of annual feed demand included the lactation and non-lactation feed demand of the foal up to weaning (5 months of age on commercial Thoroughbred farms; Rogers et al. 2017; Gee et al. 2020; Table 2).
Estimated DM intake
The dry-matter intake per day, and as a percentage of horse bodyweight, was estimated assuming a consistent pasture ME value of 10 MJ ME/kg DM (to reflect the average for New Zealand dairy and equine pasture over a year; Hoskin and Gee 2004; Valentine and Kemp 2017) and using the weighted averages or the default reference weights within Overseer®.
Estimated N intake
The N intake of different stock classes was estimated using DM intake obtained in this study and assumptions for diets, crude protein content and digestibility of feeds previously described in Chin et al. (2019a).
Results
Weights and weighted averages
The bodyweights (kg) for different equine livestock classes obtained from the structured literature review are presented in Table 1. The initial search returned 1544 potential papers; of these, 26 met the selection criteria and presented measures of central tendency (mean) and distribution (either standard deviation or standard error). The most abundant data were available for racing Thoroughbreds (eight publications, n = 10 932 animal records) and the least was for sport horses (1 publication, n = 313 animal records) and recreational horses (1 publication, n = 158 animal records) when the literature review scope was limited to New Zealand population.
The weighted mean and standard deviation calculated for the different livestock classes are presented in Table 3. This table also includes the default reference bodyweight and RSU values presented within Overseer®. The weighted mean bodyweights of a Thoroughbred broodmare (576 ± 32.65 kg), sport horses (533 ± 62.85 kg) and recreational horses (547 ± 67 kg) were within the weight range used to define a large hack (500–600 kg). Thoroughbred and Standardbred racehorses were equivalent to the Overseer category of a small hack (as bodyweight was below the threshold for a large hack). No default bodyweight values were available within Overseer® for ponies and yearlings, despite these being listed as a default livestock class.
| Stock class | N | Weighted Mean (kg) | Pooled s.d. (kg) | Default reference range within Overseer | RSU value within Overseer | |
|---|---|---|---|---|---|---|
| Broodmare | 3264 | 576 | ±32.65 | 500–600 kg (large hack) | 14 | |
| Racing TB | 10 548 | 454 | ±28.5 | NA | NA | |
| Racing SB | 189 | 460 | ±35.13 | NA | NA | |
| SporthorsesA | 158 | 533 | ±62.85 | 500–600 kg (large hack light work) | 12 | |
| Recreational horsesA | 76 | 547 | ±67 | 500–600 kg (large hack light work) | 12 | |
| Ponies | 246 | 334 | ±94.06 | NA | 6 | |
| Weanlings | 942 | 248 | ±54.33 | NA | NA | |
| Yearlings | 942 | 357.8 | ±118 | NA | NA | |
| Small hack (up to 15.2 hands) in light work | NA | 6 |
AData labelled are not pooled due to only one source being available.
RSU and equineRSU
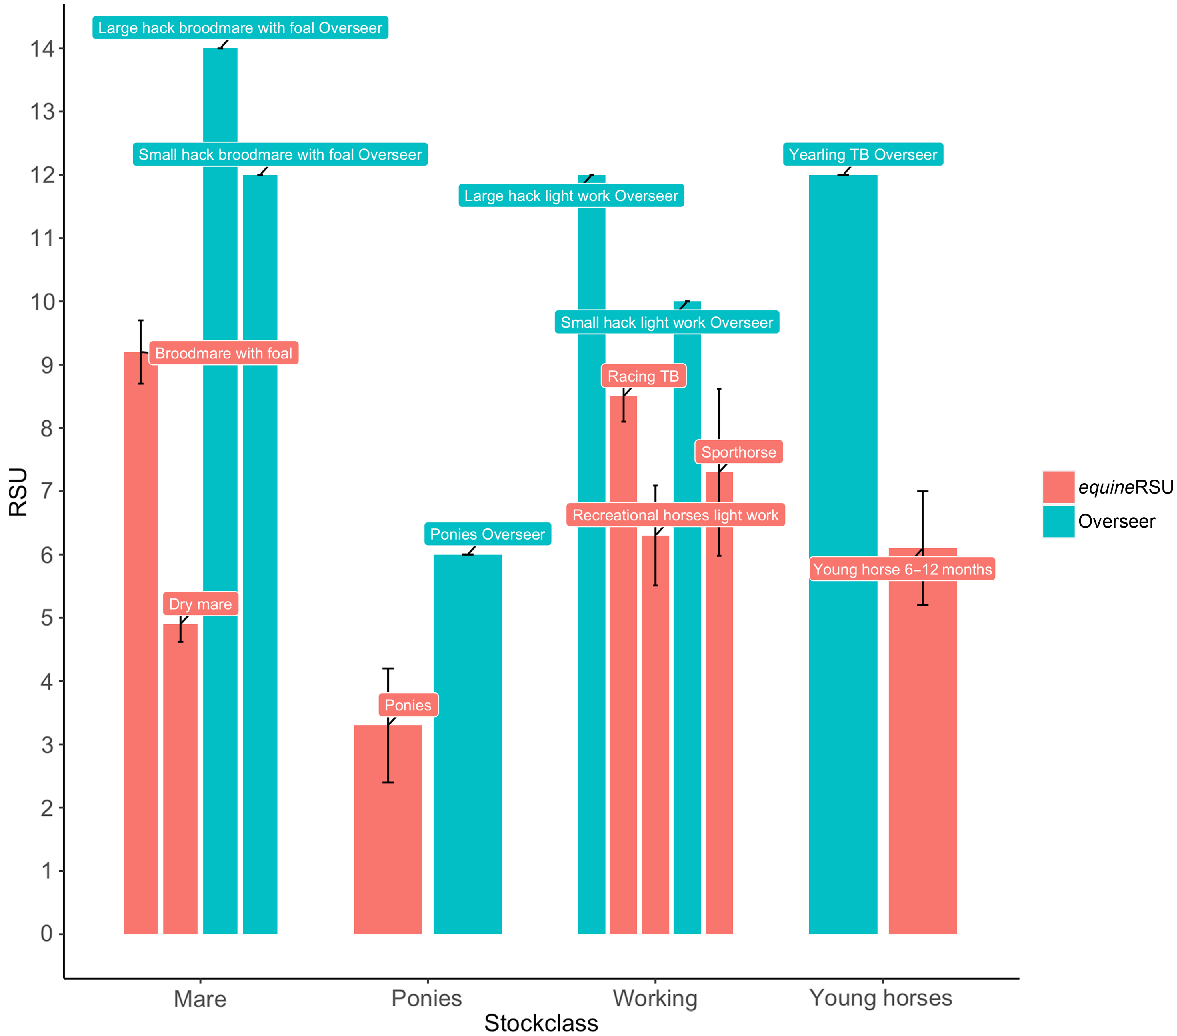
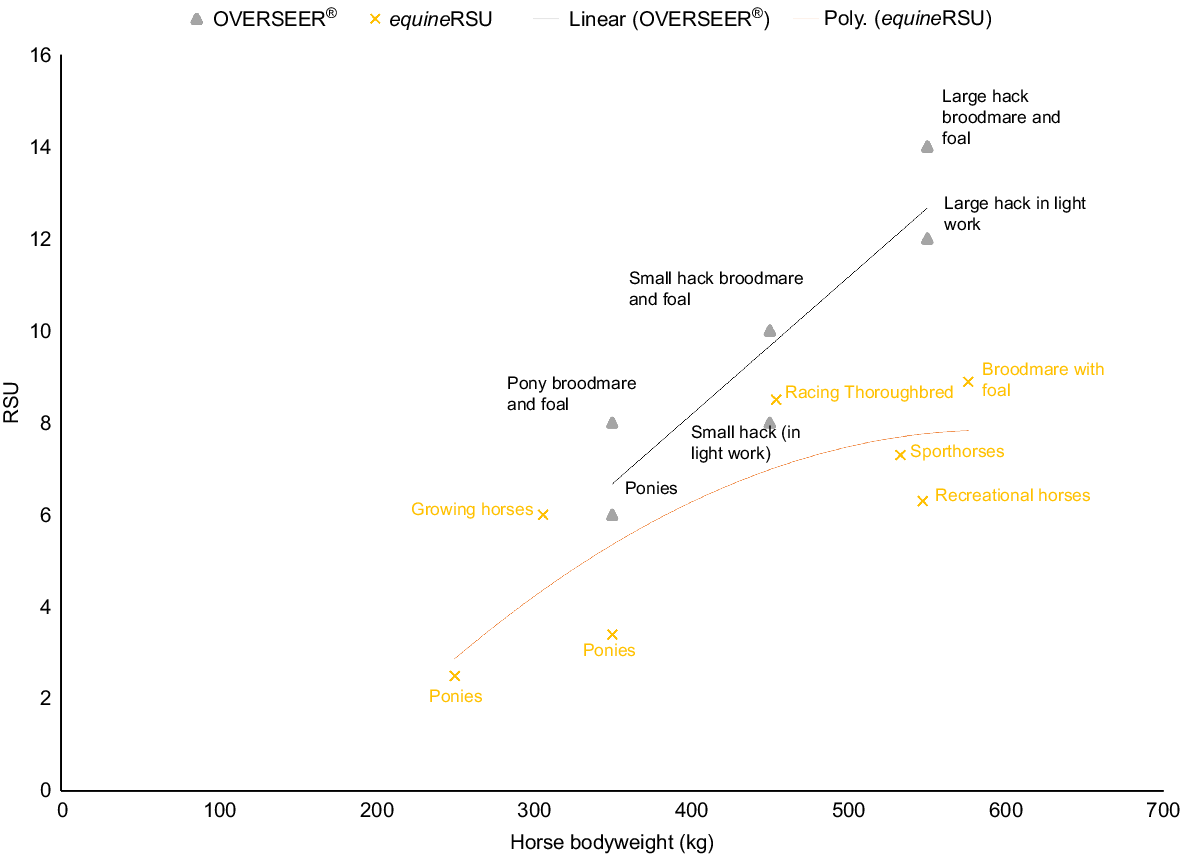
The comparison of the RSU and the equineRSU for each livestock class is presented in Fig. 1. There was a consistent pattern across all livestock classes of the equineRSU being lower than the RSU (range 2.7–6.8 units). This difference equated to the RSU providing a 52–84% greater mean estimated DM intake than did the equineRSU (Table 4). At a per animal level, this resulted in the RSU providing a 52–108% higher estimated mean N intake (Table 4). In some situations, the RSU was associated with plausible DM intakes (DMI), but in others, such as small and large hack broodmare and foal, large hack in light work and Thoroughbred yearlings, it provided a DMI estimate of 4–5% of bodyweight (Table 5). The relationship between RSU and bodyweight is presented in Fig. 2. The RSU increased linearly with bodyweight and the equineRSU approximates a logarithmic relationship with bodyweight.
The equineRSU derived using equine-specific model (NRC 2007) and mean bodyweight collated from reviewing published literature and the RSU currently in use within the Overseer model.
| Stock class | Annual energy requirement (mean ± s.d.) | Annual energy requirement (Overseer) | ME difference | ME difference vs Overseer (%) | Estimated DMI (kg/year) | Estimated DMI (Overseer) | DMI difference vs Overseer (%) | N intake (kg/year) | N intake (Overseer) | N-intake difference (%) | |
|---|---|---|---|---|---|---|---|---|---|---|---|
| Broodmare and foal | 55 409 ± 3000 | 84 000 | 25 800 ± 3000 | 63 ± 4 | 5520 | 8400 | 52 ± 5 | 147.67 ± 16.69 | 224.72 | 52 ± 9 | |
| Sport horse | 44 019 ± 7928 | NA | NA | NA | NA | NA | |||||
| Ponies | 19 565 ± 5535 | 36 000 | 16 435 ± 5535 | 84 ± 28 | 1956 ± 554 | 3600 | 84 ± 28 | 52.32 ± 15.40 | 96.31 | 76 ± 22 | |
| Broodmare (Empty) | 29 223 ± 1656 | NA | NA | NA | NA | NA | |||||
| Recreational horses (light work) | 37 730 ± 4742 | 60 000 | 22 200 ± 4742 | 58% ± 13 | 3780 | 6000 | 58% ± 13 | 101.12 ± 26.36 | 161 | 59 ± 25 | |
| Racing TB | 50 773.67 ± 3194 | NA | NA | NA | NA | NA | |||||
| Young horses (6–12 months) | 36 707 ± 5413 | 72 000 | 35 400 ± 5413 | 96 ± 15 | 3660 | 7200 | 96 ± 15 | 87.2 ± 14.4 | 181.91 | 108% ± 17 |
Overseer annual energy required was calculated on the basis of the published RSU multiplied by the ME for a single stock unit (6000 MJ ME/year).
| Stock class | DMI (kg/day) | DMI (% BWT) | |
|---|---|---|---|
| Broodmare and foal | |||
| NRC (2007) | 15.1 ± 0.8 | 2.6 ± 0.8 | |
| Small hack (Overseer) | 19.7 | 4–5 | |
| Large hack (Overseer) | 23 | 4–5 | |
| Working horses | |||
| Recreational horses light work (NRC 2007) | 10.4 ± 1.3 | 1.9 ± 1.9 | |
| Racing TB (NRC 2007) | 13.9 ± 0.9 | 3.1 ± 0.03 | |
| Sport horse (NRC 2007) | 12 ± 2.2 | 2.6 ± 0.05 | |
| Small hack light work (Overseer) | 16.4 | 3–4 | |
| Large hack light work (Overseer) | 19.7 | 4–5 | |
| Ponies | |||
| NRC (2007) | 5.4 ± 1.5 | 1.3 ± 0.3 | |
| Overseer | 9.9 | 2–4% | |
| Growing horses | |||
| Thoroughbred 6–12 months (NRC 2007) | 10 ± 1.5 | 3.3 ± 0.1 | |
| Thoroughbred yearling (Overseer) | 19.7 | 4–5% | |
| Broodmare (empty) | 8.1 ± 0.5 | 1.4 ± 0.1 | |
Horses classified as small in Overseer were assumed to have bodyweight between 400 and 500 kg, those classified as large were 500–600 kg. Similar bodyweight (353 ± 105 kg) used for calculating DMI (%BWT) for ponies and ponies (Overseer).
The revised stock unit (RSU) and equineRSU derived using equine-specific model (NRC 2007) at different equine bodyweights (kg).
Discussion
At present, the RSU for several common equine classes are not yet available within Overseer, while those currently in use within Overseer overestimate the energy requirements and, subsequently, the feed demand in comparison to values obtained using equine-specific models. The estimated DMI associated with the Overseer-based RSU values (4–5% of bodyweight) also exceeds the accepted physiological range of DMI in horses (2–3% of bodyweight; NRC 2007; Chin 2018). The assumption of linearity in feed demand with an increasing bodyweight and failure to moderate the differences in requirements and feed conversion between horses and ruminants appears to be the primary source of this bias.
The greatest economic implications for errors in input data with the nutrient management software are for the commercial racing and breeding sector of the equine industry. The large scale of these operations, in both number of mares and youngstock during the breeding season and the economic contribution to the local and national economy, means that even small errors in the reference data could have severe consequences for the ability of the industry to operate commercially (Chin et al. 2019a, 2019b). For example, a difference in 1 RSU would result in a difference in estimated crude protein and N intake of 65–110 kg and 10.4–17.6 kg per animal per year respectively. Within the Overseer model, energy requirement is used to estimate feed intake, which is subsequently used along with feed nutrient content to obtain the nutrient intake and N deposited as urine (main source of N leaching in the Overseer; Wheeler 2018a, 2018b, 2018c). For a commercial farm with 200–300 animals, errors in the farm-level N loss estimations may then be amplified by 600–2100 times.
The bodyweights reported for Thoroughbred and Standardbred horses within the literature had little variation among populations. Within the racing industries, there is limited variation in management practice, resulting in a similar environment for growth and racing across the major racing nations (Huntington et al. 2020). There is also a large inter exchange of genetic material and the operation of closed studbooks with the racing breeds (Thoroughbred and Standardbred), which results in only subtle differences in genotype among racing countries (McGivney et al. 2020). The low variation in bodyweight in Thoroughbred and Standardbred horses enables tight estimation of RSU values which represent the feed demand of these stock classes.
In contrast to the large scale of operations of the Thoroughbred industry, the sport horse industry consists of many breeders or owners with a smaller land area and number of horses (George et al. 2013). Many of the land holdings that have sport horses are classified as ‘lifestyle blocks’ rather than commercial farms and thus fall under the minimum effective area required to comply with a nutrient management plan. The economic or management implications for errors in estimation of RSU with these horses are therefore less than with the commercial part of the equine industry. The bodyweights reported for sport horses were surprisingly homogeneous, given the differences in genotype and phenotype between sports such as eventing and dressage. The limited variation in bodyweight meant that the estimated RSU for sport horses should cover the typical sport horse in New Zealand. In contrast, there was large variation in bodyweight reported for both ponies and recreational horses, due to greater variation in breeds and genotypes within this group (Verhaar et al. 2014; Fernandes et al. 2015). However, the implication of this variation may be small in the context of estimating farm-level nutrient output due to the lower densities, and lower relative numerical representation of this class of equine livestock on commercial farms (Rosanowski et al. 2012; George et al. 2013).
The equine feed requirements proposed by the NRC (2007) were derived from published data, and therefore represent the current consensus on the best estimates for equine feed requirements. Recent surveys of racehorse feeding and the published NRC requirements are in close agreement with daily energy intake, with the NRC values for a Thoroughbred in heavy training being 139 ± 8.75 MJ ME/day versus 140.9 ± 3.13 MJ ME/day being reported as what was offered New Zealand Thoroughbreds in race training (Wood et al. 2019). The NRC estimates for a broodmare during pregnancy and lactation are in close agreement with the French (INRA) and German horse-feeding standards (Coenen et al. 2011; Martin-Rosset 2015; Chin 2018). The consistency of these values across studies or those with methodologies different from that used to derive the NRC estimates indicates that there should be a relative degree of precision in the NRC values used as the basis for the derivation of the equineRSU. The logarithmic relationship between the equineRSU and bodyweight demonstrated that the effects of allometric scaling on metabolism can be addressed, reducing the overestimation of feed demand, particularly at heavier bodyweights. Therefore, the equineRSU as proposed in Table 6 should be used in the modelling of on-farm nutrient cycling as these reflect the biology of the horse and account for metabolic scaling with an increasing bodyweight.
| Stock class | equineRSU | Current RSU (Overseer) | |
|---|---|---|---|
| TB Broodmare and foal | 9.21 | 14 | |
| Working horses | |||
| Recreational horses light work | 6.29 | 12 | |
| Racing TB | 8.46 | – | |
| Sport horse | 7.34 | 12 | |
| Ponies | 6 | ||
| 250–350 kg | 2.5 | ||
| 350–450 kg | 3.4 | ||
| Growing Thoroughbred 6–12 months | 6.12 | – |
Conclusions
Findings here showed that the current RSU used in Overseer overestimates the feed demand of horses and the dry-matter intake estimated exceed the physiological range observed in horses. The primary driver for this error appears to be an inability of the RSU values to account for metabolic scaling and differences in digestive physiology between ruminants and horses. As a result, the estimated N intake was 52–108% higher than was the N intake estimated using the equineRSU presented in this study. Over-estimation of N intake translates to over-inflation of N excretion and subsequent N leaching estimations. Given the large scale of commercial pasture-based equine breeding operations, this may erroneously result in nutrient management regulations restricting total equine stock numbers and equine stock density, particularly during the busy breeding season. We therefore recommend the use of the equineRSU presented in this paper when modelling nutrient cycling on pasture-based equine properties.
Data availability
The data that support this study are available for request to the corresponding author.
References
Assenza A, Tosto F, Piccione G, Fazio F, Nery J, Valle E, Bergero D (2012) Lipid utilization pathways induced by early training in Standardbred trotters and Thoroughbreds. Journal of Equine Veterinary Science 32, 704-710.
| Crossref | Google Scholar |
Beaumier PM, Fenwick JD, Stevenson AJ, Weber MP, Young LM (1987) Presence of salicylic acid in Standardbred horse urine and plasma after various feed and drug administrations. Equine Veterinary Journal 19, 207-213.
| Crossref | Google Scholar |
Bene S, Giczi A, Nagy Z, Benedek Z, Szabó F, Polgár P (2013) Live weight and body measurement of Hungarian Thoroughbred broodmares. Journal of Central European Agriculture 14, 99-109.
| Crossref | Google Scholar |
Bolwell CF, Rogers CW, Gee EK, Rosanowski SM (2020) Commercial equine production in New Zealand. 3. The racing and sport industries. Animal Production Science 60, 2164-2174.
| Crossref | Google Scholar |
Bolzan AMS, Bonnet OJF, Wallau MO, Basso C, Neves AP, Carvalho PCdF (2020) Foraging behavior development of foals in natural grassland. Rangeland Ecology & Management 73, 243-251.
| Crossref | Google Scholar |
Buhl R, Petersen EE, Lindholm M, Bak L, Nostell K (2013) Cardiac arrhythmias in Standardbreds during and after racing – Possible association between heart size, valvular regurgitations, and arrhythmias. Journal of Equine Veterinary Science 33, 590-596.
| Crossref | Google Scholar |
Chin YY, Back P, Gee EK, Rogers CW (2019a) Deterministic modelling of nitrogen utilisation by horses managed under pasture-based, intensive and semi-intensive systems with different levels of pasture intake. New Zealand Journal of Animal Science and Production 79, 1-7.
| Google Scholar |
Chin YY, Back PJ, Gee EK, Rogers CW (2019b) Livestock and pasture management on commercial Thoroughbred breeding farms: implications for estimating nitrogen loss. New Zealand Journal of Animal Science and Production 79, 65-70.
| Google Scholar |
Cho K-H, Son S-K, Cho B-W, Lee H-K, Kong H-S, Jeon G-J, Park K-D (2008) Effects of change of body weight on racing time in Thoroughbred racehorses. Journal of Animal Science and Technology 50, 741-746.
| Crossref | Google Scholar |
Coenen M, Kienzle E, Vervuert I, Zeyner A (2011) Recent German developments in the formulation of energy and nutrient requirements in horses and the resulting feeding recommendations. Journal of Equine Veterinary Science 31, 219-229.
| Crossref | Google Scholar |
Connysson M, Essén-Gustavsson B, Lindberg JE, Jansson A (2010) Effects of feed deprivation on Standardbred horses fed a forage-only diet and a 50:50 forage-oats diet. Equine Veterinary Journal 42, 335-340.
| Crossref | Google Scholar |
Dugdale AHA, Curtis GC, Harris PA, Argo CMC (2011) Assessment of body fat in the pony: Part I. Relationships between the anatomical distribution of adipose tissue, body composition and body condition. Equine Veterinary Journal 43, 552-561.
| Crossref | Google Scholar |
Fernandes KA, Rogers CW, Gee EK, Bolwell CF, Thomas DG (2015) Body condition and morphometric measures of adiposity in a cohort of Pony Club horses and ponies in New Zealand. Proceedings of the New Zealand Society of Animal Production 75, 195-199.
| Google Scholar |
Gauvreau GM, Staempfli H, McCutcheon LJ, Young SS, McDonell WN (1995) Comparison of aerobic capacity between racing standardbred horses. Journal of Applied Physiology 78, 1447-1451.
| Crossref | Google Scholar |
Gee EK, Rogers CW, Bolwell CF (2020) Commercial equine production in New Zealand. 1. Reproduction and breeding. Animal Production Science 60, 2145-2154.
| Crossref | Google Scholar |
Gordon ME, McKeever KH, Betros CL, Manso Filho HC (2007) Plasma leptin, ghrelin and adiponectin concentrations in young fit racehorses versus mature unfit standardbreds. The Veterinary Journal 173, 91-100.
| Crossref | Google Scholar |
Grace ND, Pearce SG, Firth EC, Fennessy PF (1999) Concentrations of macro- and micro-elements in the milk of pasture-fed Thoroughbred mares. Australian Veterinary Journal 77, 177-180.
| Crossref | Google Scholar |
Grace ND, Rogers CW, Firth EC, Faram TL, Shaw HL (2003) Digestible energy intake, dry matter digestibility and effect of increased calcium intake on bone parameters of grazing Thoroughbred weanlings in New Zealand. New Zealand Veterinary Journal 51, 165-173.
| Crossref | Google Scholar |
Hoffmann G, Bentke A, Rose-Meierhöfer S, Ammon C, Mazetti P, Hardarson GH (2013) Estimation of the body weight of Icelandic horses. Journal of Equine Veterinary Science 33, 893-895.
| Crossref | Google Scholar |
Hoskin SO, Gee EK (2004) Feeding value of pastures for horses. New Zealand Veterinary Journal 52, 332-341.
| Crossref | Google Scholar |
Huntington PJ, Brown-Douglas CG, Pagan JD (2020) Growth and development of Thoroughbred horses. Animal Production Science 60, 2093-2102.
| Crossref | Google Scholar |
Ikeda Y, Ishihara A, Nakajima M, Yamada K (2019) Risk factors for superficial digital flexor tendinopathy in Thoroughbred racing horses in Japan. Journal of Equine Science 30, 93-98.
| Crossref | Google Scholar |
Kleiber M (1947) Body size and metabolic rate. Physiological Reviews 27, 511-541.
| Crossref | Google Scholar |
Leleu C, Cotrel C (2006) Body composition in young Standardbreds in training: relationships to body condition score, physiological and locomotor variables during exercise. Equine Veterinary Journal 38, 98-101.
| Crossref | Google Scholar |
Leng RA (2018) Unravelling methanogenesis in ruminants, horses and kangaroos: the links between gut anatomy, microbial biofilms and host immunity. Animal Production Science 58, 1175-1191.
| Crossref | Google Scholar |
Martinson KL, Coleman RC, Rendahl AK, Fang Z, McCue ME (2014) Estimation of body weight and development of a body weight score for adult equids using morphometric measurements. Journal of Animal Science 92, 2230-2238.
| Crossref | Google Scholar |
McGivney BA, Han H, Corduff LR, Katz LM, Tozaki T, MacHugh DE, Hill EW (2020) Genomic inbreeding trends, influential sire lines and selection in the global Thoroughbred horse population. Scientific Reports 10, 466.
| Crossref | Google Scholar |
Pagan JD, Jackson SG, Caddel S (1996) A summary of growth rates of Thoroughbreds in Kentucky. Pferdeheilkunde 12, 285-289.
| Crossref | Google Scholar |
Pagan JD, Martin OA, Crowley NL (2009) Relationship between body condition and metabolic parameters in sport horses, pony hunters and polo ponies. Journal of Equine Veterinary Science 29, 418-420.
| Crossref | Google Scholar |
Parker WJ (1998) Standardisation between livestock classes: the use and misuse of the stock unit system. Proceedings of the New Zealand Grassland Association 60, 243-248.
| Crossref | Google Scholar |
Piccione G, Fazio F, Giudice E, Grasso F, Caola G (2005) Exercise-induced changes in the clotting times and fibrinolytic activity during official 1600 and 2000 meters trot races in the standardbred horses. Acta Veterinaria Brno 74, 509-514.
| Crossref | Google Scholar |
Rogers CW, Gee EK, Firth EC (2007) A cross-sectional survey of Thoroughbred stud farm management in the North Island of New Zealand. New Zealand Veterinary Journal 55, 302-307.
| Crossref | Google Scholar |
Rogers CW, Gee EK, Bolwell CF, Rosanowski SM (2020) Commercial equine production in New Zealand. 2. Growth and development of the equine athlete. Animal Production Science 60, 2155-2163.
| Crossref | Google Scholar |
Rosanowski SM, Cogger N, Rogers CW, Benschop J, Stevenson MA (2012) A description of the demographic characteristics of the New Zealand non-commercial horse population with data collected using a generalised random-tessellation stratified sampling design. Preventive Veterinary Medicine 107, 242-252.
| Crossref | Google Scholar |
Santos AS, Rodrigues MAM, Bessa RJB, Ferreira LM, Martin-Rosset W (2011) Understanding the equine cecum-colon ecosystem: current knowledge and future perspectives. Animal 5, 48-56.
| Crossref | Google Scholar |
Santschi EM, Papich MG (2000) Pharmacokinetics of gentamicin in mares in late pregnancy and early lactation. Journal of Veterinary Pharmacology and Therapeutics 23, 359-363.
| Crossref | Google Scholar |
Tozaki T, Kikuchi M, Kakoi H, Hirota K-I, Nagata S-I (2017) A genome-wide association study for body weight in Japanese Thoroughbred racehorses clarifies candidate regions on chromosomes 3, 9, 15, and 18. Journal of Equine Science 28, 127-134.
| Crossref | Google Scholar |
Trottier NL, Tedeschi LO (2019) Dietary nitrogen utilisation and prediction of amino acid requirements in equids. Animal Production Science 59, 2057-2068.
| Crossref | Google Scholar |
Trottier NL, Bott RC, Woodward A, Greene EA, Williams CA, Westendorf ML, Swinker AM, Mastellar SL, Martinson K (2016) Gastrointestinal nitrogen metabolism of equids and impact on protein requirement. Journal of Equine Veterinary Science 45, 78-86.
| Crossref | Google Scholar |
Verhaar N, Rogers CW, Gee EK, Bolwell CF, Rosanowski SM (2014) The feeding practices and estimated workload in a cohort of New Zealand competition horses. Journal of Equine Veterinary Science 34, 1257-1262.
| Crossref | Google Scholar |
Waller A, Lindinger MI (2006) Hydration of exercised Standardbred racehorses assessed noninvasively using multi-frequency bioelectrical impedance analysis. Equine Veterinary Journal 38, 285-290.
| Crossref | Google Scholar |
Watson TDG, Burns L, Packard CJ, Shepherd J (1993) Effects of pregnancy and lactation on plasma lipid and lipoprotein concentrations, lipoprotein composition and post-heparin lipase activities in Shetland pony mares. Reproduction 97, 563-568.
| Crossref | Google Scholar |
West GB, Woodruff WH, Brown JH (2002) Allometric scaling of metabolic rate from molecules and mitochondria to cells and mammals. Proceedings of the National Academy of Sciences 99, 2473-2478.
| Crossref | Google Scholar |
Wheeler DM (2018a) Animal model. OVERSEER® ® technical manual. p. 58. (OVERSEER Limited) Available at https://assets.ctfassets.net/bo1h2c9cbxaf/6DSWeSyKXicvJrY2nnbCRp/1b5bec83bf319eac81737de67601cdd9/TMC_Animal_Model_v6.3_June_2018.pdf
Wood LJ, Lancaster BE, Rogers CW (2019) The feeding and management of Thoroughbred and Standardbred Racehorses displaying clinical signs of recurrent exertional rhabdomyolysis. New Zealand Journal of Animal Science and Production 79, 26-31.
| Google Scholar |
Zucca E, Ferrucci F, Croci C, Di Fabio V, Zaninelli M, Ferro E (2008) Echocardiographic measurements of cardiac dimensions in normal Standardbred racehorses. Journal of Veterinary Cardiology 10, 45-51.
| Crossref | Google Scholar |