

Skim-Nanopore sequencing for routine genomic evaluation and bacterial pathogen detection in cattle
H. J. Lamb A * , L. T. Nguyen A , T. E. Briody A , R. K. Ambrose B , B. J. Hayes A , T. J. Mahony A and E. M. Ross A
A Centre for Animal Science, Queensland Alliance for Agriculture and Food Innovation, The University of Queensland, St Lucia, Qld 4072, Australia.
B Department of Agriculture and Fisheries, Animal Science, Agriscience Queensland, Dutton Park, Qld 4102, Australia.
Animal Production Science 63(11) 1074-1085 https://doi.org/10.1071/AN22451
Submitted: 12 December 2022 Accepted: 17 April 2023 Published: 25 May 2023
© 2023 The Author(s) (or their employer(s)). Published by CSIRO Publishing. This is an open access article distributed under the Creative Commons Attribution-NonCommercial-NoDerivatives 4.0 International License (CC BY-NC-ND)
Abstract
Context: Genotyping-by-sequencing, the use of sequence reads to genotype single-nucleotide polymorphisms (SNPs), has seen an increase in popularity as a tool for genomic prediction. Oxford Nanopore Technologies (Nanopore) sequencing is an emerging technology that produces long sequence reads in real-time. Recent studies have established the ability for low-coverage Nanopore sequence data to be used for genomic prediction. However, the value proposition of Nanopore sequencing for individuals could be improved if both genotyping and disease diagnosis are achieved from a single sample.
Aims: This study aimed to demonstrate that Nanopore sequencing can be used for both rapid genotyping and as a disease diagnostic tool using the same sample in livestock.
Methods: Total DNA extracts from nasal swabs collected from 48 feedlot cattle presenting with clinical signs of bovine respiratory disease (BRD) were sequenced using the Nanopore PromethION sequencer. After 24 h of sequencing, genotypes were imputed and genomic estimated breeding values (GEBVs) for four traits were derived using 641 163 SNPs and corresponding SNP effects. These GEBVs were compared with GEBVs derived from SNP array genotypes and calculated using the same SNP effects. Unmapped sequence reads were classified into taxa using Kraken2 and compared with quantitative real-time polymerase chain reaction (qPCR) results for five BRD-associated pathogens of interest.
Key results: Sequence-derived genotypes for 46 of the 48 animals were produced in 24 h and GEBV correlations ranged between 0.92 and 0.94 for the four traits. Eleven different BRD-associated pathogens (two viruses and nine bacterial species) were detected in the samples using Nanopore sequence data. A significant (P < 0.001) relationship between Nanopore and qPCR results was observed for five overlapping species when a maximum threshold cycle was used.
Conclusions: The results of this study indicated that 46 cattle genomes can be multiplexed and accurately genotyped for downstream genomic prediction by using a single PromethION flow cell (ver. R9.4) in 24 h. This equates to a cost of AUD35.82 per sample for consumables. The concordance between qPCR results and pathogen proportion estimates also indicated that some pathogenic species, in particular bacterial species, can be accurately identified from the same test.
Implications: Using Nanopore sequencing, routine genotyping and disease detection in livestock could be combined into one cost-competitive test with a rapid turnaround time.
Keywords: bovine respiratory disease, feedlot cattle, genomics, genomic selection, genotyping-by-sequencing, Oxford Nanopore sequencing, pathogen diagnostics, rapid diagnostics.
Introduction
Genomic prediction relies on the accurate genotyping of thousands of single-nucleotide polymorphisms (SNPs) across the genome of interest. SNP-array genotyping is one method that has been extremely popular for genotyping in livestock production systems. SNP arrays use short oligonucleotides that share homology with regions of interest to genotype SNPs with 99.9% accuracy (Gardner et al. 2013). However, they are limited by their ability to genotype only SNPs and short insertions/deletions. SNP arrays are also able to genotype a only set of pre-determined SNP markers of a particular targeted species, and do not have the ability to detect new sequences ad hoc.
An alternative genotyping method that has gained popularity recently is genotyping-by-sequencing (GBS; Elshire et al. 2011). GBS uses genomic sequence reads produced by next-generation sequencing platforms, with Illumina being the most frequently used technology in published studies (Huang et al. 2010; Torkamaneh et al. 2016; Katsumura et al. 2019). Sequence reads are aligned to a reference genome and reads overlapping SNP loci are used to call the SNP genotype. Two popular methods for GBS exist. The first is reduced representation genotyping-by-sequencing (rr-GBS; Elshire et al. 2011), which uses restriction enzymes to fragment DNA and thereby reduce the complexity of the genome for sequencing. This results in much greater sequencing depths at desirable loci from which SNP genotypes can be accurately called; however, this method has the potential to also introduce a number of different types of bias (Davey et al. 2013). The second method is referred to as skim-genotyping-by-sequencing (skim-GBS; Huang et al. 2009) and involves whole-genome sequencing of samples at very low coverage (less than 0.5×). After aligning reads to a reference genome, genotypes are called at loci with sufficient depth (this can be as low as 1× coverage) and the remaining loci with low or no coverage are imputed using SNP reference panels. This method is particularly useful in organisms with high-quality SNP reference panels (Scheben et al. 2017). Both skim-GBS and rr-GBS have gained significant traction over the past decade for a number of applications in plants and animals. The cost of both methods has also decreased substantially over time (Poland and Rife 2012; Davey et al. 2013; De Donato et al. 2013; Torkamaneh et al. 2021), and the flexibility of both methods means that novel sequences and variants can be detected without the need to significantly alter the genotyping consumables.
Oxford Nanopore Technologies (Nanopore) is a rapidly emerging third generation sequencing technology that produces long sequence reads. These longer reads, although being more error prone, can map more accurately and at higher rates to reference genomes, particularly across complex genomic regions (De Roeck et al. 2019; Amarasinghe et al. 2020). Nanopore offers a range of sequencing devices, including their portable Flongle, MinION and PromethION P2sequencers as well as their high-throughput GridION, PromethION P24 and PromethION P48 sequencers. The PromethION sequencer is capable of producing up to 250 Gb of data (Oxford Nanopore Technologies 2022) from a single flow cell and can run either 2, 24 or 48 flow cells simultaneously.
The portability and rapid turnaround time that Nanopore sequencing offers has led to applications in rapid diagnostics and epidemiology. Some examples of which include disease outbreaks, such as Zika (Faria et al. 2016), Ebola (Hoenen et al. 2016; Quick et al. 2016), African swine fever (O’Donnell et al. 2019) and COVID-19 (Barbé et al. 2022). However, the utility of Nanopore sequencing for GBS has not been thoroughly investigated.
Previously, Lamb et al. (2022) established an imputation strategy for deriving accurate genomic estimated breeding values for cattle from Nanopore sequence data subsampled to ~0.1× sequencing coverage. Here, we aimed to implement this imputation strategy to derive genomic estimated breeding values for 48 feedlot cattle from a single PromethION flow cell, at a cost below AUD40 per sample for all consumables. We simultaneously tested the hypothesis that the same data could be used to accurately detect pathogens associated with bovine respiratory disease (BRD) by using non-bovine sequence reads and comparing these results to quantitative real-time PCR (qPCR) pathogen-detection assays.
Materials and methods
Ethics
Nasal swabs from 60 feedlot cattle were collected under the animal ethics approval number 2022/AE000166. Tail hairs from two Droughtmaster heifers were also collected from The University of Queensland cattle research farm, under the ethics approval number SVS/301/18.
Sample collection
Nasal swabs were taken from 60 feedlot cattle, each of which had presented with clinical signs associated with BRD. DNA extractions were performed using the Gentra® PureGene® DNA extraction kit (Qiagen) by using the supplied buccal cell extraction protocol. The DNA pellet was suspended in 20 μL of DNA hydration solution. DNA concentrations were quantified using a Qubit™ dsDNA broad-range assay kit (Invitrogen) as per the manufacturer’s instructions. All samples were then diluted to a concentration of 20 ng/μL of DNA by using DNA hydration solution. Purity of the extracted DNA was determined with the NanoDrop ND1000 (Thermo Fisher Scientific) and the 48 samples with the highest 260:230 ratio were selected for sequencing.
Sequencing
Sequencing libraries were prepared from 140 ng of DNA for each of the 48 samples by using the Nanopore Rapid Native barcoding kit for 96 samples (SQK-RBK110.96; Oxford Nanopore Technologies). The library was prepared as per the manufacturer’s instructions, with the exception of increasing both barcode incubation times from 2 min to 10 min. This was undertaken to allow more time for the rapid barcodes to ligate to the DNA sample and therefore increase the pore occupancy.
The prepared library was then quantified on the Qubit and 912 ng of DNA from the prepared library was loaded onto a PromethION R9.4.1 flow cell. The library was sequenced for 24 h, and base calling was performed using Nanopore’s high-accuracy setting.
SNP-array genotyping
DNA (400 ng) from each sample was used to genotype the 48 sequenced feedlot animals on the 50K GGP TropBeef SNP array (Illumina). The 50 k SNP-array genotypes were then imputed to high density (700 k) by using FImpute (Sargolzaei et al. 2014), as described by Hayes et al. (2019).
Nanopore genotyping and imputation
A bioinformatics pipeline was used to map reads, impute genotypes and calculate genomic estimated breeding values in real-time. Sequence reads were aligned to the Bos taurus reference genome ARS-UCD v1.2 (Rosen et al. 2020) by using Minmap2 (Li 2018) with the map-ont setting. Genotypes were called and imputed from the aligned reads using QUILT (Davies et al. 2021), with a reference panel of 15 000 408 SNPs and 1208 animals from the 1000 Bull genomes project (Hayes and Daetwyler 2019). The 15 000 408 SNPs were subset from the original 48 208 338 SNPs in the 1000 Bull reference panel by using a minor allele-frequency filter of 0.1, as described in (Lamb et al. 2022). GNU Parallel (Tange 2018) was used to impute each chromosome on a single computer thread and Bcftools (Danecek et al. 2021) was then used to combine the imputed chromosomes. A subset of 641 163 SNPs with SNP effects was then subset out and used for genomic prediction.
The 50 k SNP-array genotypes were correlated against the imputed Nanopore-derived genotypes for 40 878 overlapping SNP loci. The genotyping error rate, defined as the number of genotype errors divided by the total number of genotype calls was also calculated.
The overlapping 40 878 SNPs were also used to investigate whether systematic errors were present in the Nanopore genotypes. The Nanopore genotyping error rate was used to estimate the number of errors expected at each locus by chance across the 48 samples. Systematic errors were then defined as loci where genotyping errors were observed at a particular locus in a significant number of samples (P < 0.05).
Genomic estimated breeding values
A subset of 641 163 SNPs from the 15 000 408 SNPs imputed were used to calculate genomic estimated breeding values (GEBVs) for the following four traits: heifer puberty score, bodyweight, body condition score and hip height, as described in Lamb et al. (2021). SNP effects for these 641 163 were previously calculated from the Northern Genomics project data in Hayes et al. (2019). The imputed SNP-array genotypes were also used to calculate GEBVs by using the same SNP effects and all 641 163 SNPs. Linear regressions were used to compare the SNP array GEBVs to the Nanopore GEBVs and the correlation and regression coefficients were reported.
The effect of genotyping accuracy and sequencing coverage on GEBV accuracy was investigated using linear models. Sequencing coverage and genotyping accuracy were fitted separately for each trait, by using the model
where y is a vector of the absolute difference between SNP-array GEBV and Nanopore-derived GEBV for each animal and X is a vector of either sequencing coverage or genotyping accuracy for each animal, and e is the error term. Both vectors had dimensions 1 × 46 (total number of animals minus the two failed animals). Sequencing coverage was defined as the total mapped data for each sample divided by the size for the B. taurus reference genome (2.7 Gbp). Genotyping accuracy for each animal was defined as the correlation between SNP-array genotypes and Nanopore genotypes for the 40 878 overlapping SNP loci.
Pathogen detection
Reads that did not align to the B. taurus reference genome (ARS-UCD v1.2) were run through Kraken2 (Lu et al. 2022), by using a database of all complete genomes in RefSeq for the bacterial, viral and archaeal domains, as well as all plasmid sequences and the B. taurus reference genome. Bracken (Lu et al. 2017) was then used to estimate the abundance of pathogens in each sample. A number of BRD-associated pathogens are opportunistic and otherwise ubiquitous in the bovine upper respiratory tract; therefore, unmapped sequence reads from two tail-hair samples from Droughtmaster heifers sequenced to 0.5× coverage in Lamb et al. (2021) were used as negative controls. By using tail hair as a negative control, the absence of BRD pathogens could be ensured. The same approach was used to estimate the metagenomic species abundance in these two samples as the 48 feedlot samples.
A multiplex qPCR was also used to test for the presence of viral genetic material for bovine alphaherpesvirus 1 (BoHV-1) and bacterial genetic material for Mannheimia haemolytica, Pasteurella multocida, Histophilus somni, and Mycoplasma bovis in these samples (Table S1–S3 available as Supplementary material). The qPCR assay for the detection of BoHV-1 was performed in a multiplex assay as described previously by Horwood and Mahony (2011). The bacterial qPCR was also performed as a multiplex reaction with primer and probe concentrations of 0.2 μM. Both assays were performed using the QuantiTect Multiplex RT-PCR Kit (Qiagen) with omission of the QuantiTect Multiplex RT mix (enzyme) for the bacterial assay. The Qiagen Rotor-Gene® Q machine was used to perform the viral assay by using conditions as previously described (Horwood and Mahony 2011). The bacterial assay was conducted on the CFX96 Touch Real-Time PCR Detection System (Bio-Rad) by using the following amplification parameters: enzyme activation at 95°C for 15 min and 40 cycles of denaturation at 94°C for 60 s and annealing/extension at 60°C for 90 s, with the machine set to acquire fluorescence on the VIC, ROX, FAM and Cy5 channels. Samples were considered positive if the threshold cycle (Ct) value was <35.
Abundance estimates from Braken and Ct values from the qPCR were compared for the five overlapping BRD pathogens. Linear models were also used to evaluate the relationship between the Ct value and the abundance estimates, by using the following equation:
where Ct is a vector of the qPCR Ct value for each pathogen in each sample and A is a vector of abundance estimates derived from the unmapped Nanopore reads, and e is the error term. Linear models with A were run with and without taking into account the ratio of host to non-host reads. Initially, A was defined as the abundance estimate derived from the unmapped Nanopore reads, i.e. not taking into account the ratio of host to non-host data. A was later redefined as being the abundance estimate divided by the sequencing coverage of the sample, to take into account the proportion of host to non-host reads.
Results
Nanopore sequencing
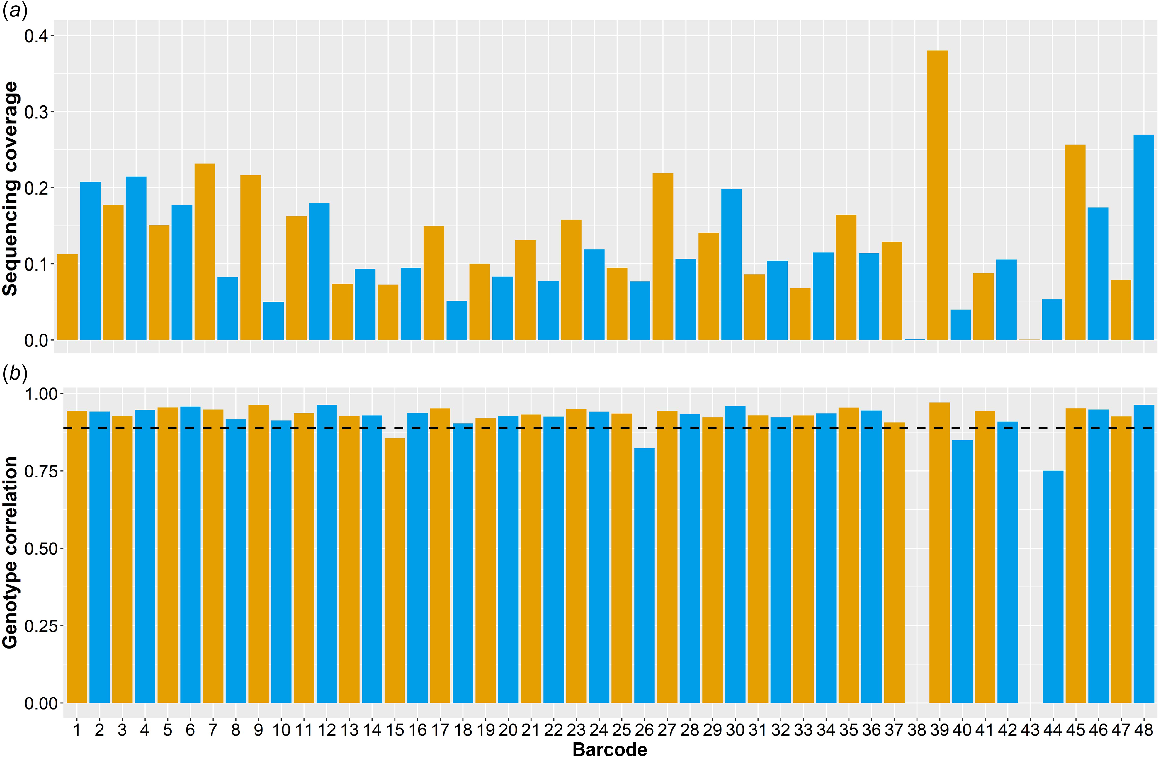
After 24 h of sequencing, 25.02 Gbp of data were produced with an N50 of 6.52 kbp. The mean sequencing coverage was 0.13× ± 0.069× (Fig. 1a) with respect to the bovine genome (ARS-UCD v1.2). However, two samples (Barcode 38 and Barcode 43) yielded only 0.001× and 0.0004× sequencing coverage respectively, and were subsequently excluded from further analysis. For the remaining samples, the mean number of reads unaligned per sample was 18 481 ± 7399 (mean ± s.d.).
Summary statistics for each sample after 24 h of sequencing on a single PromethION flow cell. Barcodes 38 and 43 did not yield enough data for analysis. (a) Sequencing coverage of each barcoded sample relative to the Bos taurus reference genome, ARS-UCD v1.2. (b) Genotype correlations for each sample at 40 878 SNPs overlapping between the 50 k TropBeef GGP array- and the Nanopore sequence-imputed genotypes. The average correlation across the 46 samples was 0.96 ± 0.034 dashed line).
Genotyping
After imputation, genotype correlations between the 50 k GGP TropBeef SNP array-derived and the imputed Nanopore-derived genotypes were calculated. The average correlation between the 40 878 overlapping SNPs was 0.93 ± 0.039 (Fig. 1b). The genotype error rate across all samples was 3.4%. Of all SNP loci, 6.9% had at least one error, of which 1.3% had two incorrectly called alleles, while 98.7% had only a single incorrectly called allele. In addition, sequencing coverage was found to have a significant (P < 0.05) effect on the genotyping correlation, and the two were positively correlated (0.57).
Potential systematic errors were also identified at 2628 loci (6.4% of the 40 878 SNPs); that is, they were incorrectly called in eight or more of the 46 samples (Supplementary material Fig. S1), the probability of which was less than 0.02% by chance. Removing these 2628 SNP loci from the 40 878 overlapping SNP loci increased the average genotype correlation to 0.96 ± 0.034. A principal-component analysis (PCA) containing the 46 feedlot animals and the 1208 animals in the imputation reference panel indicated that the feedlot animals were not genetically diverse from the reference animals, and therefore these systematic errors were not likely to be a result of divergent populations (Fig. S2).
GEBVs
GEBV correlations between the imputed Nanopore prediction and the SNP array predictions were 0.93, 0.92, 0.94 and 0.95 for bodyweight, hip height, heifer puberty score and body condition score respectively (Fig. 2a). The regression coefficient for SNP array-derived GEBV on the Nanopore-derived GEBV for the four traits was 0.96 for bodyweight, 0.98 for hip height (Fig. 2b), 0.85 for heifer puberty and 0.83 for body condition score, indicating very little bias.
Accuracy of genomic estimated breeding values (GEBVs) derived from Oxford Nanopore Technologies (Nanopore) sequence data as compared to GEBVs derived from low-density SNP-array genotypes imputed to high density. (a) Correlations between the Nanopore-derived GEBVs and GEBVs derived from low-density SNP-array genotypes imputed to high density. The solid black line represents the correlation limit, and the dashed black line represents a correlation of 0.9. Error bars indicate the 95% confidence interval. (b) Regression of GEBVs for hip height derived from imputed low-density SNP-array genotypes on GEBVs for hip height derived from imputed Nanopore sequence data (solid black line). The dashed line represents the ideal case where the GEBVs are identical and unbiased, i.e. regression coefficient is equal to 1. (c) Re-ranking of animals within heifer puberty quintiles between the Nanopore-derived GEBVs and the GEBVs derived from the imputed low-density SNP-array genotypes.
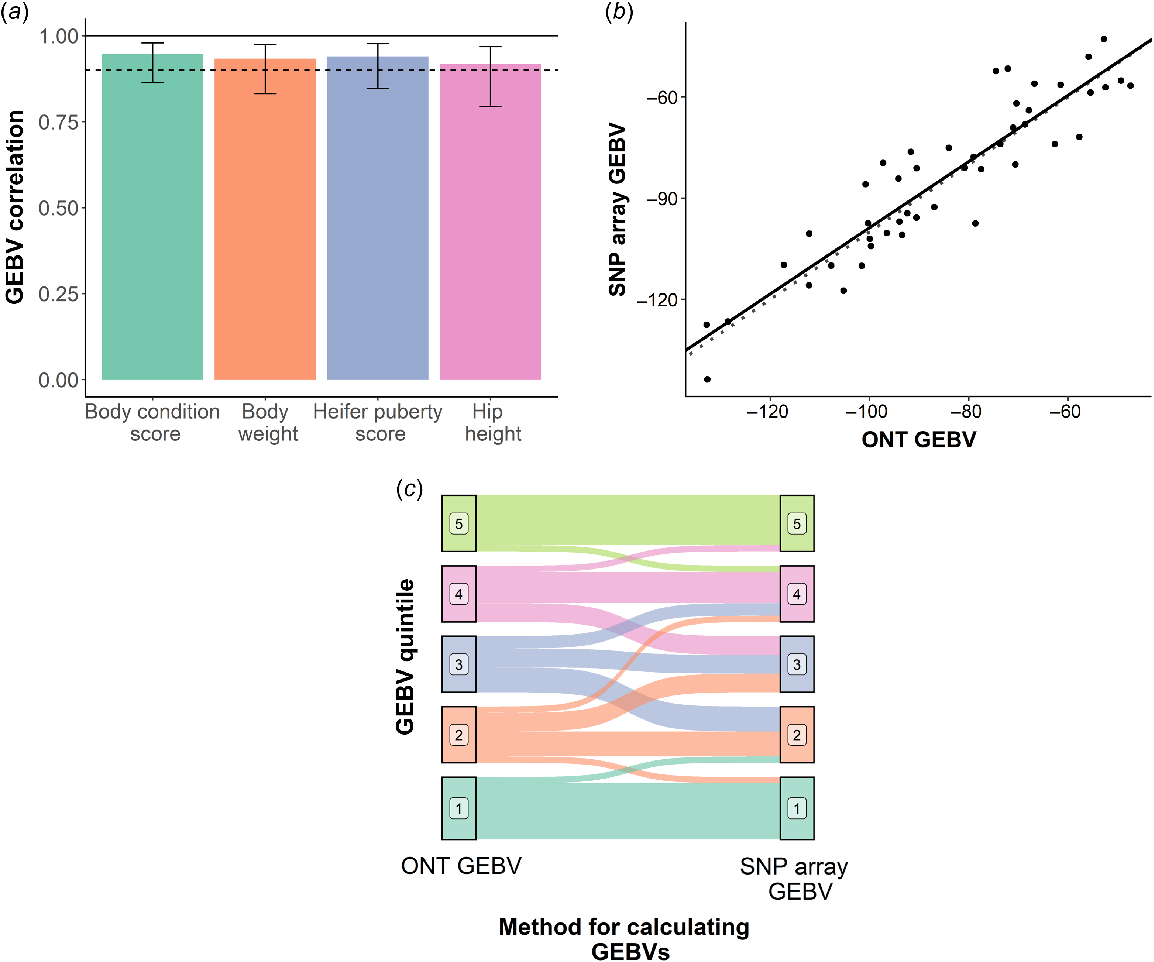
Animals were split into quintiles on the basis of GEBVs for each of the four traits. Some minor re-ranking of animals between the two genotyping methods was observed (Fig. 2c), particularly for the middle quintiles (animals ranked between the 20th percentile and 80th percentile). For animals in the top and bottom 20%, 26.5% (n = 19) were re-ranked on average across the four traits. This was significantly less than the 51.3% (n = 27) of animals that were re-ranked on in the middle quintiles. This suggests animals of high and low genetic merit can be more accurately ranked from the remaining animals, than for animals of average genetic merit.
Both sequencing coverage and genotyping accuracy had a significant (P < 0.05) negative effect on the absolute deviation of GEBVs between the SNP array and Nanopore method for bodyweight and body condition score. For hip height and heifer puberty score, neither sequencing coverage nor genotyping accuracy had a significant (P > 0.05) effect on GEBV accuracy.
Abundance estimates
Across the 46 feedlot samples sequenced and genotyped, 86 unique bacteria were detected from the unmapped Nanopore sequence reads. Across these samples Clostridium botulinum, Francisella halioticida, Escherichia coli, H. somni and Mannheimia pernigra were the five most abundant species in the unmapped reads (Table 1). Together C. botulinum and F. halioticida made up 88.9% of the unmapped reads. In the negative-control samples, C. botulinum was again the most abundant bacterial/viral species at 98.5% of the unmapped reads. It was also the only species of the five most abundant species in the BRD samples to overlap with the negative controls; however, it was in significantly (P < 0.05)greater abundance. No BRD-associated pathogens were detected in either of the two negative-control samples.
| Species | BRD samples (mean ± s.d.) (%) | Negative controls (Rep1, Rep2) (%) |
|---|---|---|
| Clostridium botulinum | 70.6 ± 7.5 | 98.8, 98.0 |
| Francisella halioticida | 17.6 ± 4.1 | – |
| Escherichia coli | 5.6 ± 9.0 | – |
| Histophilus somni | 1.6 ± 2.9 | – |
| Mannheimia pernigra | 1.0 ± 1.8 | – |
| Bacillus cereus | 0.02 ± 0.08 | 0.6, 0.2 |
| Pantoea eucrina | – | 0.8, – |
| Pantoea anthophila | – | 0.2, – |
| Stenotrophomonas maltophilia | – | –, 0.2 |
A dash indicates that the species is not present in the sample/samples.
After removing reads belonging to C. botulinum and F. halioticida, 20.1% of the remaining reads could be classified as belonging to a BRD-related pathogen. The most abundant of which was H. somni, followed closely by Mannheimia species and then Moraxella species (Fig. 3). Across the 46 samples, an average of 4.0 ± 1.2 pathogenic BRD-related bacterial species were detected per sample. On top of the two negative controls, two other samples (Barcodes 26 and 33) had no BRD-related pathogens in the unmapped reads.
Correlation matrix-based hierarchical clustering of the samples based on the proportion of unmapped reads belonging to different bovine respiratory disease related non-host species after Clostridium botulinum and Francisella halioticida sequence reads were removed.
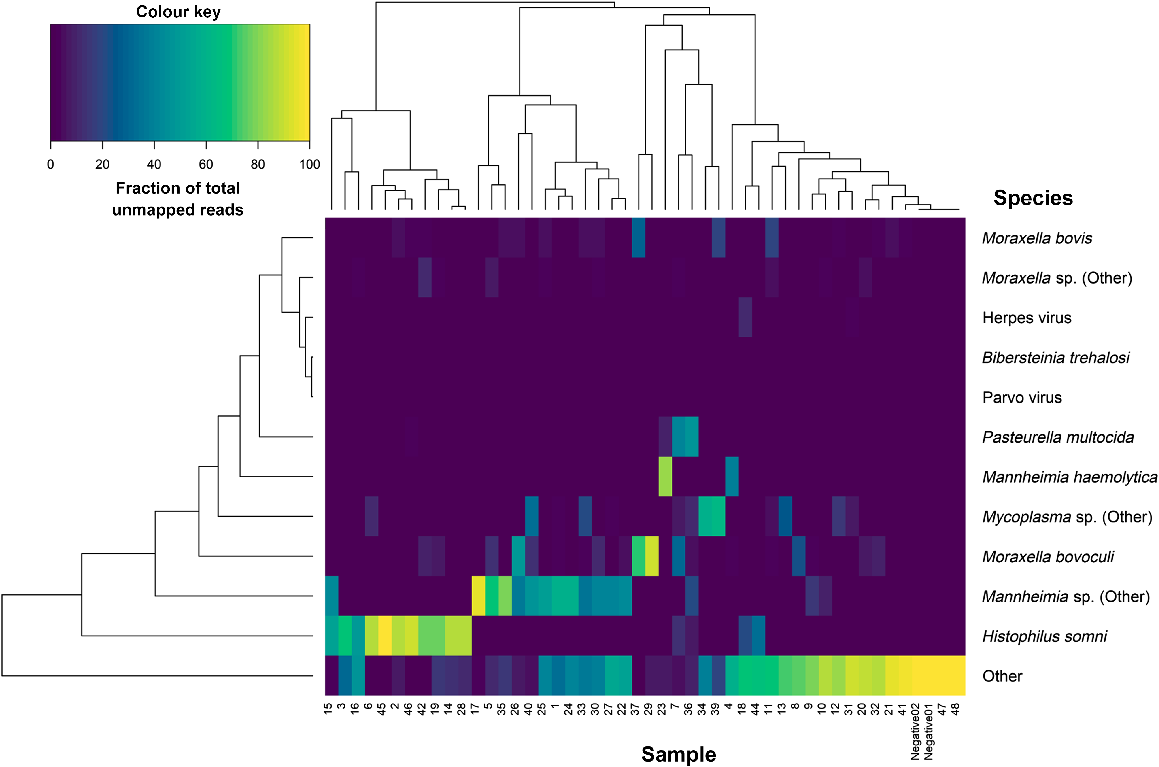
Ungulate erythroparvovirus 1 (identified in Barcodes 10 and 18) and BoHV-1 (identified in Barcodes 18 and 32) were the only viruses detected in the unmapped reads of the BRD nasal swabs. No viruses were detected in the unmapped reads of the two negative-control samples.
Overlap between qPCR and Nanopore abundance estimates
The number of overlapping pathogens detected between the qPCR results and Nanopore reads was also compared. When the original maximum Ct threshold of 35 was used to filter the qPCR results, significantly more pathogens were detected using qPCR than by the Nanopore reads (Fig. 4a). However, when a maximum Ct threshold of 30 was introduced, greater concordance between the qPCR and Nanopore results was observed (Fig. 4b).
Comparison between the number of pathogens of interest identified by quantitative real-time PCR (qPCR) and the unmapped Oxford Nanopore Technology (Nanopore) reads for two different scenarios. (a) The difference between the number of pathogens of interest detected by qPCR and the unmapped Nanopore reads with no maximum critical threshold (Ct) used. (b) The difference between the number of pathogens of interest detected by qPCR and the unmapped Nanopore reads with a maximum Ct cut-off of 30.
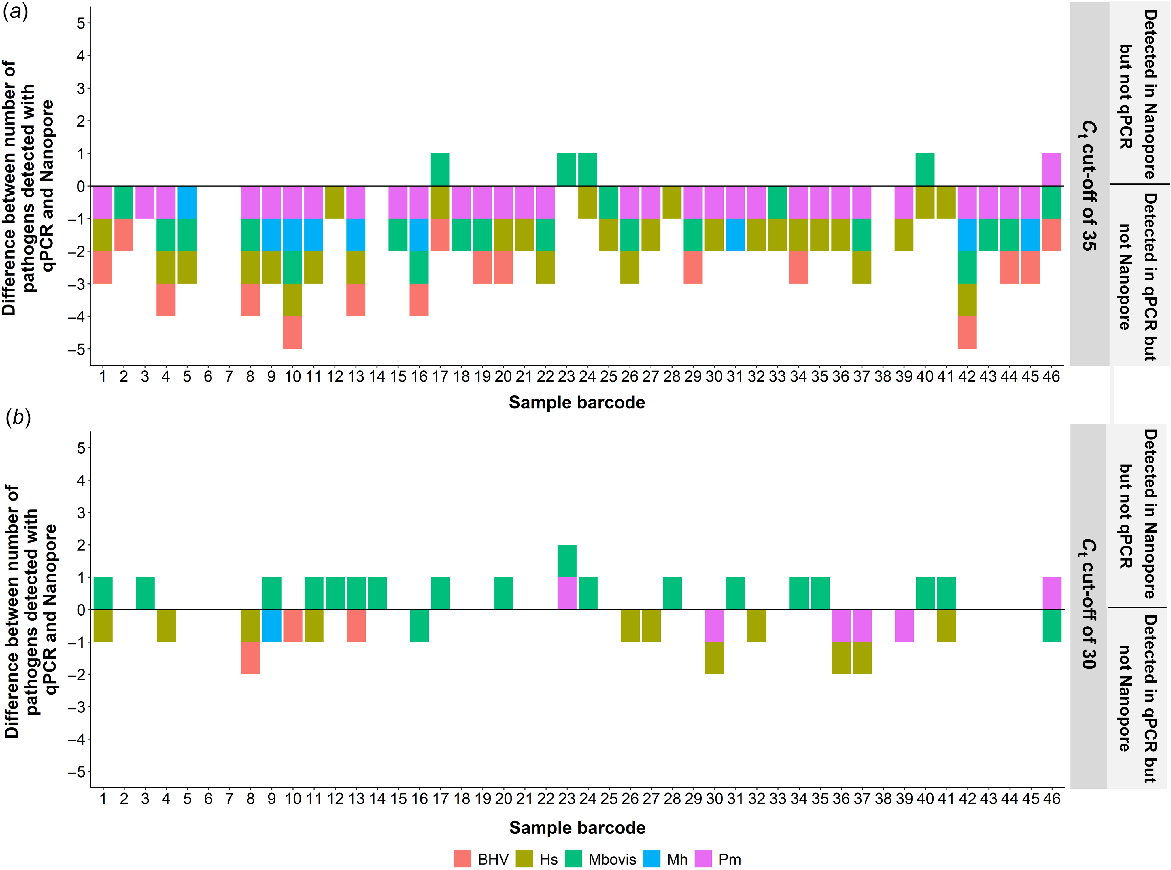
From the linear models, a significant (P < 0.05) relationship between Ct value and the proportion of pathogen in the unmapped reads was observed. However, when taking into account the sequencing coverage of each sample, the relationship was no longer significant (P > 0.05). The linear models were also run with and without the Ct threshold of 30. When no maximum Ct threshold was used in the linear model, there was no significant relationship between the Ct value and the proportion of pathogen; however, when the Ct threshold was used, the relationship was significant (P < 0.001).
Comparison of the cost of Nanopore and SNP-array genotyping
In the current study, DNA extracts from the 48 animals were submitted to a commercial service provider for SNP genotyping with the GGP TropBeef SNP Chip at a cost of AUD50.00 per sample (total cost AUD2400, excluding local taxes). This cost includes the labour component required to complete the genotyping of the samples. It should also be noted that commercial service providers charge additional costs for sample extraction that were not considered in the current study because purified DNA was provided for the analysis. The results for the genotyping were provided 16 days after the submission of the samples.
Table 2 shows the breakdown of the costs associated with the approach used in the current study for Nanopore-genotyping-by-sequencing (Nanopore-GBS). On the basis of the direct costs associated with this project, the cost per sample was estimated to be AUD35.82 (Table 2). While current Nanopore barcoding permits up to 96 samples barcoded and analysed in a single experiment, for the purposes of Nanopore-GBS, 72 is currently considered the highest feasible number. This is based on the size of the bovine genome, permitting the generation of sufficient data to impute and accurately genotype cattle, from a single flow cell, reliably. If 72 animals were barcoded and sequenced on a single flow cell, the cost per sample was estimated to be AUD26.91. However, if we assume that the same mean coverage is required for accurate genotyping, an additional 9.3 Gbp of data would be needed. We estimate this would take a further 24–48 h of sequencing on the basis of the rate of pore degradation observed in this study, making the total sequencing time 48–72 h.
| Procedure | Cost per animal (AUD) | Details of consumables | |
|---|---|---|---|
| Current study (n = 48, sequencing time = 24 h) | Theoretical study (n = 72, sequencing time = 72 h) | ||
| Sample acquisition | Not considered | Not considered | |
| Sample processing | Not considered | Not considered | |
| Sample extraction | 2.78 | 2.78 | PureGene® DNA extraction kit (Qiagen) |
| DNA quantification | 1.2 | 1.2 | Qubit dsDNA BR assay kit (Thermo Fisher Scientific) |
| Library construction | 5.12 | 5.12 | Rapid Native barcoding kit for 96 samples (Nanopore) |
| Flow cellA | 26.72 | 17.81 | R9.4 Flow cell (Nanopore) |
| Total | 35.82 | 26.91 | |
All values are shown in Australian dollars and labour costs have been excluded.
AFlow-cell cost is based on the Nanopore price when purchasing 96 PromethION flow cells.
Discussion
Here we used high-throughput Nanopore sequencing on a PromethION P24 to genotype 46 feedlot cattle to calculate GEBVs and demonstrate the scalability of Nanopore-GBS. A key advantage of sequence-derived genotyping is the potential to characterise the DNA of other species present in the sample extracts being analysed. As the population used in this study was cattle undergoing treatment for BRD at the time of sampling, this provided the opportunity to explore the potential for simultaneous detection of pathogens while genotyping the host of interest. Sequencing reads corresponding to bacterial species were readily identified in the dataset that did not align to the bovine genome. Previous studies have shown that the microbiome of the bovine upper respiratory tract consists of a multitude of bacterial species that are considered commensal, pathogenic and/or opportunistically pathogenic (Chai et al. 2022). Further subsampling of the sequencing reads of those bacterial species previously associated with BRD confirmed the presence of some of these bacteria, including H. somni, M. bovis and M. haemolytica.
A potential advantage of combining host genotyping and microbiome analyses is the potential for monitoring of specific microbiome ‘traits’ of interest. As an example, the current study population was cattle affected by BRD and were undergoing treatment for the disease through the administration of antimicrobials. With the identification of antimicrobial resistance as a global issue in human health, there is increased scrutiny on the use of these drugs in animals, particularly in food-producing animals (Patel et al. 2020; Emes et al. 2022). While continued use of therapeutic antimicrobials is essential to maintain animal health and welfare, combining monitoring for antimicrobial-resistance genes with Nanopore-GBS has the potential to improve antimicrobial stewardship. Freeman et al. (2022) previously demonstrated that this is possible with Nanopore sequencing by identifying antimicrobial-resistance genes for seven classes of antimicrobials in samples from the bovine upper respiratory tract. However, a key difference in our approach was the absence of host depletion so as to generate sufficient data to genotype the host. However, further research is necessary to better understand the best ratio between host and microbiome data capture when fully developed Nanopore-GBS has the potential to identify the most effective treatment for chronically affected animals.
Cost
By multiplexing 48 animals on a single sequencing run, we demonstrated that the cost/animal of Nanopore-GBS is currently ~AUD35.82 per animal for cattle (even though only 46 animals were successfully genotyped). The largest cost for Nanopore-GBS remains the flow cell, which makes up almost 75% of the cost. An important point to note is that in this study, samples were sequenced only for 24 h, so as to demonstrate a rapid genotype turnaround time. However, Nanopore flow cells are designed to run for up to 96 h. Therefore, it is reasonable to assume that with a longer sequencing run, more data would be available, and therefore more samples could be multiplexed on a single flow cell. Given current flow-cell outputs, we estimate 72 animals per flow cell to be the reliable limit for a 72-h run. Buying the flow cells in bulk has further potential to save costs (approximately AUD5 per animal), although this comes at a significant upfront cost and therefore is likely to be feasible only for commercial genotyping service providers.
As a whole, these results have demonstrated that the cost of Nanopore-GBS is approaching that of more established genotyping methods for cattle, such as low-density SNP-array genotyping (AUD35–50) and Illumina reduced-representation GBS (AUD30–80; Elshire et al. 2011; De Donato et al. 2013). A yet to be exploited advantage of Nanopore-GBS is the relationship between host genome size and per sample cost. This could see the cost of Nanopore-GBS decrease significantly for species with smaller genomes (e.g. chicken and some crops and aquaculture species) because more samples can be multiplexed on a single flow cell. For species that currently do not use commercial high-throughput genotyping, the cost may be even more competitive, as those species lack the economies of scale that result in the cost-competitive bovine SNP array.
GEBVs and imputation accuracies
We previously demonstrated that at least 0.05× sequencing coverage is required for accurate GEBVs from Nanopore-GBS (Lamb et al. 2022). Greater than 0.05× sequencing coverage was achieved for 46 of the 48 samples (95.8%) in this study by using Nanopore sequencing, while SNP-array genotyping was successful for all 48 samples and the average call rate was 99.7% ± 0.0007. The two samples that did not reach 0.05× sequencing coverage after 24 h had less than 0.001× coverage, which was insufficient for imputation. As these samples were successfully genotyped on the SNP array, it is suspected that significant differences in the length of DNA molecules of these two samples led to the loss of DNA. During the magnetic bead clean-up in the library preparation, short DNA fragments are disproportionately washed out, as they do not bind to the beads as efficiently. Conversely, longer DNA is more difficult to elute from the beads and therefore can also cause DNA losses. Pulse-field gel electrophoresis could be used in the future to accurately test the DNA length of samples before sequencing; however, this adds both cost and time to Nanopore-GBS. Nonetheless, the DNA length of the two samples that did not reach 0.05× sequencing coverage should be investigated in the future.
These types of sequencing failures are not unusual with Nanopore sequencing and significant variability among sequencing yields from similar libraries is common (Tyler et al. 2018; Lamb et al. 2021). For Nanopore-GBS to become a competitive method of commercial genotyping in agriculture, consistent sequencing yields must be achievable such that 0.05× can be robustly produced for every sample when multiplexing is used. Automation of DNA extraction and library preparation hold significant potential to help achieve this; so too does Nanopore’s barcode balancing feature, which allows particular barcodes to be enriched or depleted in real-time during a sequencing run (Oxford Nanopore Technologies 2022). Currently this innovation is available only as a beta release on the PromethION, but barcode balancing could be used to better equalise sequencing coverages across multiplexed samples. In theory, barcode balancing would not change the required DNA input and would decrease the required sequencing time by prioritising the sequencing of under-represented samples. Ideally, with the help of automated DNA extraction and library preparation to increase the reproducibility of sequencing libraries, DNA quantification prior to sequencing would not be necessary. This would remove the most labour-intensive steps of Nanopore-GBS.
The high genotype correlations between overlapping SNPs in the 50 k TropBeef GGP array and the imputed Nanopore genotypes, similar to those reported by Teng et al. (2022), indicated that up to 46 (95.8%) animals can be accurately genotyped on a single flow cell. This is further supported by the correlations between GEBVs derived from the 50 k TropBeef GGP array and GEBVs from Nanopore-GBS, which were all over 0.9 for the four traits examined in this study.
The regression coefficient of the SNP array-derived GEBV on Nanopore-GBS-derived GEBV indicated some modest bias in the Nanopore-GBS-derived GEBVs for heifer puberty and body condition score. However, it is important to note that the imputation of SNP genotypes from low density to high density or sequence density is also not 100% accurate; therefore, perfect correlations and bias estimates were not expected. In fact, by using 0.5× sequencing coverage, we previously demonstrated that Nanopore-GBS may be more accurate than is imputing low-density genotypes to high density in crossbred beef cattle populations, such as those in northern Australia (Lamb et al. 2022). This previous study also demonstrated that at 0.1× sequencing coverage, Nanopore-GBS had the same GEBV accuracy as did low-density genotypes that were imputed up to high density. This implies that when compared with the true breeding values, the Nanopore-GBS GEBVs derived here may in fact have the same accuracy as do the low-density SNP-array GEBVs, while also providing the added benefit of pathogen detection, all of which can be provided for a similar price.
A possible explanation for the observed bias in the GEBVs for some of the traits may be the presence of systematic errors in the imputed Nanopore-GBS genotypes. Cytosine methylation in mammals and homopolymer, heteropolymer and trinucleotide repeats are known weaknesses of Nanopore sequencing (Delahaye and Nicolas 2021) and may contribute to these systematic errors. Another possible explanation is that the imputation reference panel does not contain accurate haplotypes at these loci for this particular population of animals, although the PCA plot suggests that the breeds sampled in our study are adequately represented in the reference panel.
When comparing the ranking of animals between the SNP array-derived GEBVs and Nanopore-GBS-derived GEBVs, a significant amount of re-ranking occurred for animals closest to the mean. However, the Nanopore-GBS-derived GEBVs could accurately distinguish the top- and bottom-performing animals. This indicates that Nanopore-GBS could be used to rapidly segregate animals into groups on the basis of genetic merit, particularly where the exact rank of intermediate/average animals is not required. This would be useful particularly for commercial breeders, where the breeding objective is to improve the herds’ overall genetics.
Pathogen detection
Two viruses were detected in 2 of the 46 samples and at much lower proportions than for the detected bacterial species. The low abundance of viruses can be partially attributed to sequencing libraries being constructed using total DNA extracts, thus biasing detection towards viruses with DNA genomes, such as the two detected BoHV-1 and ungulate parvovirus. However, the majority of the viruses associated with BRD have RNA genomes (Ng et al. 2015; Zhang et al. 2019) and therefore these viruses are undetectable without a complementary DNA-synthesis step in the sample-preparation protocol. DNA extraction method also has an effect on the representation of species in metagenomic studies (Wesolowska-Andersen et al. 2014; Angelakis et al. 2016; Sui et al. 2020) and may have influenced the representation of viruses in the samples.
When evaluating the sensitivity of Nanopore sequencing to detect BRD-associated pathogens, the relationship between qPCR Ct value and Nanopore sequence-based abundance estimates indicated that unmapped Nanopore reads alone, i.e. without host depletion, can be used to detect BRD-associated pathogens. However, in the current study this approach did not have the sensitivity of qPCR and therefore enabled only the detection of pathogens with high titres as indicated by Ct values of <30. For example, BoHV-1 was detected in 15 of the 48 samples using qPCR. Of the 15 positive samples, only two had Ct values of <20 (Barcode 18 and Barcode 32), suggesting that these were present in high titres. These two samples were the only samples identified as containing BoHV-1 DNA using the Nanopore unmapped reads. The remaining 13 samples had an average Ct value of 32 ± 2.38, indicating a low viral titre and therefore likely explaining the inability to detect the virus in these samples.
Consequently, without host depletion it may be difficult to detect the full repertoire of viruses in animals at the start or end of the infection cycle. Future development of Nanopore technology may improve the breadth of how sequencing data from a single experiment can be utilised. Currently, adaptive sequencing can be used to increase the frequency of sequence reads associated with microbiomes, as demonstrated by Ong et al. (2022). The recently released Nanopore approach of barcode balancing could enable more robust multiplexing of complex samples. Combining these two approaches, if feasible, could enable the most value to be derived from the sequencing of a sample by giving a robust Nanopore-GBS and an associated microbiome when it is of interest. We believe this could be achieved by sequencing the host genome to approximately 0.1× coverage by using barcode balancing, then switching to host-depletion by adaptive sampling to detect pathogens.
On the basis of the results in this study, we suggest that the capacity of Nanopore-GBS to capture both host and non-host genomic information has a number of other applications for various sample types. For instance, saliva or faecal samples could be used for a combination of genotyping the host animal, characterising its microbiome and studying grazing patterns on the basis of species of flora detected. However, each sample type and application would face unique challenges, such as determining the optimal DNA extraction method as well as the most appropriate enrichment/depletion technique and analysis pipeline to ensure accurate representation of all species in the sample of interest.
Conclusions
Here we have demonstrated that up to 46 cattle can be genotyped in under 24 h by using the Nanopore PromethION sequencer. The resulting genotypes have a genotype correlation greater than 0.93 when compared with SNP-array genotypes and GEBVs calculated using these Nanopore genotypes could be used to accurately identify animals with the highest and lowest genetic merit in the study population. Sequence data from the same experiment could also be used to test for the presence of various pathogens when present at high titres. However, host sequence depletion, bioinformatically, is likely to be necessary to accurately detect pathogens in acutely infected animals. By multiplexing 48 animals, we have also demonstrated that the price-point of Nanopore-GBS is AUD35.82 per animal, excluding labour for accurate SNP genotyping and pathogen detection. This cost is likely to decline further as the technologies and analytical methods for Nanopore-GBS are refined.
Acknowledgements
The authors thank the partner feedlot for their participation in this study as well as Mrs Christie Warburton for her help in collecting samples.
References
Amarasinghe SL, Su S, Dong X, Zappia L, Ritchie ME, et al. (2020) Opportunities and challenges in long-read sequencing data analysis. Genome Biology 21, 30.
| Crossref | Google Scholar |
Angelakis E, Bachar D, Henrissat B, Armougom F, Audoly G, et al. (2016) Glycans affect DNA extraction and induce substantial differences in gut metagenomic studies. Scientific Reports 6, 26276.
| Crossref | Google Scholar |
Barbé L, Schaeffer J, Besnard A, Jousse S, Wurtzer S, et al. (2022) SARS-CoV-2 whole-genome sequencing using oxford nanopore technology for variant monitoring in wastewaters. Frontiers in Microbiology 13, 889811.
| Crossref | Google Scholar |
Chai J, Capik SF, Kegley B, Richeson JT, Powell JG, et al. (2022) Bovine Respiratory Microbiota of Feedlot Cattle and Its Association with Disease. Veterinary Research 53, 4.
| Crossref | Google Scholar |
Danecek P, Bonfield JK, Liddle J, Marshall J, Ohan V, et al. (2021) Twelve years of SAMtools and BCFtools. GigaScience 10, giab008.
| Crossref | Google Scholar |
Davey JW, Cezard T, Fuentes-Utrilla P, Eland C, Gharbi K, et al. (2013) Special features of RAD sequencing data: implications for genotyping. Molecular Ecology 22, 3151-3164.
| Crossref | Google Scholar |
Davies RW, Kucka M, Su D, Shi S, Flanagan M, et al. (2021) Rapid genotype imputation from sequence with reference panels. Nature Genetics 53, 1104-1111.
| Crossref | Google Scholar |
De Donato M, Peters SO, Mitchell SE, Hussain T, Imumorin IG (2013) Genotyping-by-Sequencing (GBS): a novel, efficient and cost-effective genotyping method for cattle using next-generation sequencing. PLoS ONE 8, e62137.
| Crossref | Google Scholar |
De Roeck A, De Coster W, Bossaerts L, Cacace R, De Pooter T, et al. (2019) NanoSatellite: accurate characterization of expanded tandem repeat length and sequence through whole genome long-read sequencing on PromethION. Genome Biology 20, 239.
| Crossref | Google Scholar |
Delahaye C, Nicolas J (2021) Sequencing DNA with nanopores: troubles and biases. PLoS ONE 16, e0257521.
| Crossref | Google Scholar |
Elshire RJ, Glaubitz JC, Sun Q, Poland JA, Kawamoto K, et al. (2011) A robust, simple genotyping-by-sequencing (GBS) approach for high diversity species. PLoS ONE 6, e19379.
| Crossref | Google Scholar |
Emes D, Naylor N, Waage J, Knight G (2022) Quantifying the relationship between antibiotic use in food-producing animals and antibiotic resistance in humans. Antibiotics-Basel 11, 66.
| Crossref | Google Scholar |
Faria NR, Sabino EC, Nunes MRT, Alcantara LCJ, Loman NJ, et al. (2016) Mobile real-time surveillance of Zika virus in Brazil. Genome Medicine 8, 97.
| Crossref | Google Scholar |
Freeman CN, Herman EK, Abi Younes J, Ramsay DE, Erikson N, et al. (2022) Evaluating the potential of third generation metagenomic sequencing for the detection of BRD pathogens and genetic determinants of antimicrobial resistance in chronically ill feedlot cattle. BMC Veterinary Research 18, 211.
| Crossref | Google Scholar |
Gardner SN, Thissen JB, McLoughlin KS, Slezak T, Jaing CJ (2013) Optimizing SNP microarray probe design for high accuracy microbial genotyping. Journal of Microbiological Methods 94, 303-310.
| Crossref | Google Scholar |
Hayes BJ, Daetwyler HD (2019) 1000 bull genomes project to map simple and complex genetic traits in cattle: applications and outcomes. Annual Review of Animal Biosciences 7, 89-102.
| Crossref | Google Scholar |
Hayes BJ, Fordyce G, Landmark S (2019) Genomic predictions for fertility traits in tropical beef cattle from a multi-breed, crossbred and composite reference population. In ‘Proceeding of the Association for the Advancment of Animal Breeding and Genetics, Armidale’. (Association for the Advancment of Animal Breeding and Genetics: Armidale, NSW). Available at http://www.aaabg.org/aaabghome/AAABG23papers/69Hayes23282.pdf
Hoenen T, Groseth A, Rosenke K, Fischer RJ, Hoenen A, et al. (2016) Nanopore sequencing as a rapidly deployable Ebola outbreak tool. Emerging Infectious Diseases 22, 331-334.
| Crossref | Google Scholar |
Horwood PF, Mahony TJ (2011) Multiplex real-time RT-PCR detection of three viruses associated with the bovine respiratory disease complex. Journal of Virological Methods 171, 360-363.
| Crossref | Google Scholar |
Huang X, Feng Q, Qian Q, Zhao Q, Wang L, et al. (2009) High-throughput genotyping by whole-genome resequencing. Genome Research 19, 1068-1076.
| Crossref | Google Scholar |
Huang X, Wei X, Sang T, Zhao Q, Feng Q, et al. (2010) Genome-wide association studies of 14 agronomic traits in rice landraces. Nature Genetics 42, 961-967.
| Crossref | Google Scholar |
Katsumura T, Oda S, Mitani H, Oota H (2019) Medaka population genome structure and demographic history described via genotyping-by-sequencing. G3 Genes|Genomes|Genetics 9, 217-228.
| Crossref | Google Scholar |
Lamb HJ, Hayes BJ, Randhawa IAS, Nguyen LT, Ross EM (2021) Genomic prediction using low-coverage portable Nanopore sequencing. PLoS ONE 16, e0261274.
| Crossref | Google Scholar |
Lamb HJ, Nguyen LT, Copley JP, Engle BN, Hayes BJ, et al. (2022) Imputation strategies for near real-time genomic prediction using nanopore sequencing. Research Square
| Crossref | Google Scholar |
Li H (2018) Minimap2: pairwise alignment for nucleotide sequences. Bioinformatics 34, 3094-3100.
| Crossref | Google Scholar |
Lu J, Breitwieser FP, Thielen P, Salzberg SL (2017) Bracken: estimating species abundance in metagenomics data. PeerJ Computer Science 3, e104.
| Crossref | Google Scholar |
Lu J, Rincon N, Wood DE, Breitwieser FP, Pockrandt C, et al. (2022) Metagenome analysis using the Kraken software suite. Nature Protocols 17, 2815-2839.
| Crossref | Google Scholar |
Ng TFF, Kondov NO, Deng X, Van Eenennaam A, Neibergs HL, et al. (2015) A metagenomics and case-control study to identify viruses associated with bovine respiratory disease. Journal of Virology 89, 5340-5349.
| Crossref | Google Scholar |
Ong CT, Ross EM, Boe-Hansen GB, Turni C, Hayes B, et al. (2022) Technical note: overcoming host contamination in bovine vaginal metagenomic samples with nanopore adaptive sequencing. Journal of Animal Science 100, skab344.
| Crossref | Google Scholar |
O’Donnell VK, Grau FR, Mayr GA, Sturgill Samayoa TL, Dodd KA, et al. (2019) Rapid sequence-based characterization of African swine fever virus by use of the oxford nanopore minION sequence sensing device and a companion analysis software tool. Journal of Clinical Microbiology 58, e01104-19.
| Crossref | Google Scholar |
Patel SJ, Wellington M, Shah RM, Ferreira MJ (2020) Antibiotic stewardship in food-producing animals: challenges, progress, and opportunities. Clinical Therapeutics 42, 1649-1658.
| Crossref | Google Scholar |
Poland JA, Rife TW (2012) Genotyping-by-sequencing for plant breeding and genetics. The Plant Genome 5, 92-102.
| Crossref | Google Scholar |
Quick J, Loman NJ, Duraffour S, Simpson JT, Severi E, et al. (2016) Real-time, portable genome sequencing for Ebola surveillance. Nature 530, 228-232.
| Crossref | Google Scholar |
Rosen BD, Bickhart DM, Schnabel RD, Koren S, Elsik CG, et al. (2020) De novo assembly of the cattle reference genome with single-molecule sequencing. GigaScience 9, giaa021.
| Crossref | Google Scholar |
Sargolzaei M, Chesnais JP, Schenkel FS (2014) A new approach for efficient genotype imputation using information from relatives. BMC Genomics 15, 478.
| Crossref | Google Scholar |
Scheben A, Batley J, Edwards D (2017) Genotyping-by-sequencing approaches to characterize crop genomes: choosing the right tool for the right application. Plant Biotechnology Journal 15, 149-161.
| Crossref | Google Scholar |
Sui H-Y, Weil AA, Nuwagira E, Qadri F, Ryan ET, et al. (2020) Impact of DNA extraction method on variation in human and built environment microbial community and functional profiles assessed by shotgun metagenomics sequencing. Frontiers in Microbiology 11, 953.
| Crossref | Google Scholar |
Tange O (2018) ‘GNU Parallel’. Available at https://www.gnu.org/software/parallel/
Teng J, Zhao C, Wang D, Chen Z, Tang H, et al. (2022) Assessment of the performance of different imputation methods for low-coverage sequencing in Holstein cattle. Journal of Dairy Science 105, 3355-3366.
| Crossref | Google Scholar |
Torkamaneh D, Laroche J, Belzile F (2016) Genome-wide SNP calling from genotyping by sequencing (GBS) data: a comparison of seven pipelines and two sequencing technologies. PLoS One 11, e0161333.
| Crossref | Google Scholar |
Torkamaneh D, Laroche J, Boyle B, Hyten DL, Belzile F (2021) A bumper crop of SNPs in soybean through high-density genotyping-by-sequencing (HD-GBS). Plant Biotechnology Journal 19, 860-862.
| Crossref | Google Scholar |
Tyler AD, Mataseje L, Urfano CJ, Schmidt L, Antonation KS, et al. (2018) Evaluation of oxford Nanopore’s minION sequencing device for microbial whole genome sequencing applications. Scientific Reports 8, 10931.
| Crossref | Google Scholar |
Wesolowska-Andersen A, Bahl MI, Carvalho V, Kristiansen K, Sicheritz-Ponten T, et al. (2014) Choice of bacterial DNA extraction method from fecal material influences community structure as evaluated by metagenomic analysis. Microbiome 2, 19.
| Crossref | Google Scholar |
Zhang M, Hill JE, Fernando C, Alexander TW, Timsit E, et al. (2019) Respiratory viruses identified in western Canadian beef cattle by metagenomic sequencing and their association with bovine respiratory disease. Transboundary and Emerging Diseases 66, 1379-1386.
| Crossref | Google Scholar |