

Effect of animal and diet parameters on methane emissions for pasture-fed cattle
Stefan Muetzel A * , Rina Hannaford A and Arjan Jonker A
A
Abstract
Estimates of enteric methane emissions for agricultural emissions trading schemes or national inventories can be a simple single emission factor, but the accuracy of the predictions may be affected by other diet- and animal-related parameters.
Determine the animal and dietary factors that affect methane yield (methane per unit of dry-matter intake) in pasture-fed cattle.
Methane emissions and dry-matter intake (DMI) of cattle of various ages and in different physiological stages that were fed different-quality fresh-cut pastures were quantified in respiration chambers. The animals used in the various trials were post-weaned calves, heifers and steers of various ages and some older lactating dairy cows. Diet quality of the pastures offered was determined using near-infrared spectroscopy. Mixed linear modelling was used to assess the impacts of animal and diet parameters on methane emissions.
Our results indicated that diet quality does not have a major effect on methane production. For individual composition parameters, the correlation (Pearson’s r) with methane production was less than 0.25. Only estimates of metabolisable energy (ME) content showed a higher correlation (r = 0.43). However, despite this correlation, ME, like the other diet composition variables, was not a useful parameter to predict daily methane production, as indicated by the Akaike’s information criterion (AICc). Including data on concentrate supplementation at a level of 30% of the DMI did not improve the prediction of methane production. The resulting model indicated that besides DMI, bodyweight, physiological state and sex significantly affected methane production. Methane production was mostly explained by DMI. This was illustrated by the observation that when methane production is expressed per kilogram DMI (methane yield, g kg−1 DMI) none of the diet or animal related characteristics showed a significant correlation with methane yield. The model performed well, but needs to be validated with an independent dataset.
For ryegrass-based pasture dry-matter intake is the single most important factor that affects methane yield, while pasture composition has no effect and animal-related factors such as physiological stage and age only appear to modulate methane emissions.
Our findings have implications for methane accounting and national inventories in pastoral agricultural systems, which account for the majority of ruminant production systems.
Keywords: cattle, enteric, grazing, greenhouse gases, inventory, lactation, methane, pasture, pasture composition.
Introduction
Globally, agriculture contributes ~15% to overall greenhouse-gas (GHG) emissions, and livestock methane emissions account for roughly half of global greenhouse gas emissions from agriculture (Gerber et al. 2013). New Zealand agricultural GHG emissions account for approximately 50% of the national GHG emissions, of which 49% are enteric methane emissions from cattle (Ministry for the Environment 2020).
The approach adopted in the New Zealand GHG inventory calculates annual methane emissions from dairy and beef cattle by using the estimated demand of dietary metabolisable energy (ME) of the national cattle herd based on statistics of the livestock population, livestock sales, and animal product sales (Pickering et al. 2022). These data are collected or extrapolated at monthly steps, which are then used to estimate a dry-matter demand by dividing the animal’s ME demand by the monthly ME content of New Zealand pasture. This estimated dry-matter demand is then multiplied by the methane emission factor for cattle on pasture. The emission factor currently adopted for New Zealand cattle is 21.6 g methane per kilogram dry-matter intake (DMI). This factor is based on studies conducted in New Zealand by using the SF6 tracer technique to estimate methane emissions from cattle grazing ryegrass-based pasture (Clark et al. 2003). However, under grazing conditions, neither the methane emissions nor the DMI can be measured directly or quantitatively, and both values have to be estimated using SF6 as a tracer in the case of methane estimation and intake marker (e.g. alkanes, titanium dioxide) or back-calculating intake based on animal requirements to estimate DMI. It has been found that both the use of the SF6 method and having to estimate DMI result in some errors in the methane yield estimate (Appuhamy et al. 2016; Jonker et al. 2020). Therefore, additional trials were conducted in New Zealand by using respiration chambers (Pinares-Patiño et al. 2018) to measure both methane emissions and DMI of cattle fed on cut ryegrass-based pasture (Jonker et al. 2016, 2017). These measurements suggested that a fixed methane yield would still be appropriate, but the methane yield was 23.4 g kg−1 DMI and is higher than the 21.6 g kg−1 DMI currently used.
In addition to DMI, other factors such as the choice of ingredients for cattle diets (Beauchemin and McGinn 2006; Brask et al. 2013), dietary nutrient composition, digestibility of the diet, and feeding level (Yan et al. 2000; Sauvant et al. 2018) can influence methane yield in ruminants. In New Zealand studies with sheep fed on ryegrass pasture, it was observed that animal age was a factor affecting methane yield and that methane yield decreases with an increasing DMI (Swainson et al. 2018); however, data for cattle are scarce.
The objectives of the current study were to extend the dataset of pasture-fed cattle in New Zealand (Jonker et al. 2017), with a focus on younger livestock and concentrate supplementation to re-evaluate the effect of diet composition, intake level, animal age, and physiological stage on methane yield in cattle.
Materials and methods
All animal manipulations reported here were conducted in compliance with the AgResearch Institutional Code of Ethical Conduct for the Use of Animals in Research, Testing and Teaching, as prescribed in the Animal Welfare Act of 1999 and its amendments (New Zealand). Manipulations were approved by the AgResearch Grasslands Animal Ethics Committee for several studies in which methane emissions from cattle were measured (Approval numbers 13 246, 13 977, 14 150, 14 275, 14 316, 14 618 and 14 649).
In all studies, the cattle were transported to the New Zealand Ruminant Methane Measurement Centre (AgResearch Grasslands Research Centre, Palmerston North, New Zealand) and weighed on arrival, departure, and fortnightly during their time in the facility.
Measurements from young livestock
The objective was to measure methane emissions of young cattle fed on fresh-cut pasture. Three groups of growing young (Hereford × Friesian) cattle aged 8, 12, and 16 months (the group numbers, sex and liveweight are described in Table 1) were transported from Aorangi farm (AgResearch, Manawatu, New Zealand) to the New Zealand Ruminant Methane Measurement Centre. The animals were adapted over 2–3 weeks to cut pasture, handling, and the indoor environment in covered yards or calf pens. The three groups of animals were adapted to individual confinement in metabolic crates for 2 days before placement in respiration chambers. Methane emissions and DMI were determined in the respiration chamber facility consisting of four chambers (Pinares-Patiño et al. 2018). The pasture was cut daily approximately 11:00 hours, divided into two meals, and stored at 4°C until offered to the animals in the afternoon and the next morning. A daily subsample of the cut grass was collected and analysed as described below. The feed was offered ad libitum and replaced with a fresh allocation twice a day at approximately 08:30 hours and 15:30 hours. The refusals were removed before fresh feed was offered and a subsample was taken for DM content determination. Fresh water was always available.
| Treatment | Treatment level | Animals (n) | Class | Sex | Weight (kg) | s.d. | |
|---|---|---|---|---|---|---|---|
| Supplement group | Low intake | 8 | Beef | Mixed | 341 | 10.5 | |
| Medium intake | 11 | Dairy | Female | 410 | 23.8 | ||
| High intake | 12 | Dairy | Female | 474 | 23.1 | ||
| Age group | 2.5 months A | 23 | Beef | Male | 59 | 5.0 | |
| 4 months | 6 | Beef | Male | 147 | 10.0 | ||
| 8 months | 11 | Beef | Male | 200 | 20.3 | ||
| 12 months | 12 | Beef | Female | 282 | 19.5 | ||
| 16 months | 9 | Beef | Female | 411 | 18.1 |
In a separate experiment, 24 female Hereford × Friesian calves were collected from a commercial farm at 4 days of age, transported to the New Zealand Ruminant Methane Measurement Centre, and randomly allocated into two groups of 12. All animals were housed in a calf shed on a bedding of bark chips. Transition milk was fed to ease the introduction of reconstituted calf milk replacer (CMR). One group of calves received a limited amount of CMR (4 L day−1) and had unlimited access to concentrate starter pellets (SealesWinslow Calf 20% Pellets). The other group had a higher allowance of CMR (up to 8 L day−1) and access to ryegrass-dominant pasture in a paddock adjacent to the calf shed and no concentrate supplementation. Pasture hay and fresh water were available ad libitum to both groups. The CMR and starter pellets were fed using a CalfSMART automated milk and pellet feeding system (Zeddy, Palmerston North, New Zealand). At 2.5 month of age, methane measurements were conducted in respiration chambers. These calves were transferred to the respiration chambers directly from the calf shed. While in chambers, the calves received milk together with either starter pellets or fresh pasture as described previously. Methane emissions of these animals were re-measured post-weaning at 4 months of age while being fed cut pasture as described above.
Effect of concentrate supplementation and three levels of intake
For this trial, a high-starch concentrate feed (multi-feed nuts; Sharpes Stock Feeds, Carterton, New Zealand) was used and fed at approximately 30% of the DM. The pasture was offered ad libiturm. The supplement was offered to three groups of cattle that had a different level of DMI. The first group consisted of 18-month-old Hereford × Friesian cattle representing a low-intake group with an average DMI of 6 kg day−1. The second group (medium-intake group) consisted of late-lactating Jersey × Holstein cows with an average DMI of 12 kg day−1, and the high-intake group was represented by early lactating Holstein dairy cows that consumed approximately 20 kg day−1. Relative to the bodyweight, these intakes represented 1.7%, 2.9% and 3.3% of bodyweight for the low-, medium- and high-intake groups. The concentrate was offered as two equal meals in the morning and afternoon before new pasture was allocated. Lactating dairy cattle were milked twice a day by using mobile milking units (DeLaval, MacDougalls Agri Services, Palmerston North, New Zealand). The pasture was cut at Aorangi farm daily and delivered around midday to the trial site, where it was offered ad libitum and replaced with a fresh allocation in the afternoon and the next morning. Refusals were removed for DM determination before fresh feed was offered and fresh water was always available. The animals were weighted on arrival and after methane measurements. The weight at the end of the measurements was recorded (Table 1).
Methane and DMI measurements
The gases methane, hydrogen and carbon dioxide were quantified in four open-circuit respiration chambers. Each chamber is 15.4 m3 (3.5 m long × 2 m wide × 2.2 m high) with an airflow rate set at ~0.5–2.0 m3 min−1 (depending on animal size), which was continuously monitored by measuring differential pressure with a Venturi flowmeter. The temperature inside the respiration chambers was, on average, approximately 20°C and the relative humidity was, on average, approximately 79%. All gases were measured at ~2.8 min intervals by using a 4900C Continuous Emission analyser (Servomex Group, East Sussex, UK), and the daily production of each gas was calculated from the difference between concentration flowing in and that flowing out of the chamber, corrected for temperature, pressure, and humidity (Pinares-Patiño et al. 2018). Respiration chambers were opened twice daily (~20 min each time for growing cattle and ~ 45 min for lactating dairy cattle) for cleaning, feed refusal collection, feeding, and milking for lactating cows. No measurements were performed during the period when chambers were opened, and missing data were interpolated by taking the average of the last 12 values (~45 min) before the doors were opened.
Similar to the adaptation in crates, refusals were also collected and analysed during the time in the respiration chambers. Subsamples of the refusals and the feed offered were dried at 105°C for 24 h to determine the dry-matter (DM) content. Daily DMI of the animals were determined from the difference between the DM offered and refused. Feeding level as a multiple of maintenance metabolisable energy requirements was calculated using the Australian Feeding Standard (Freer et al. 2007).
Additional samples from each pasture delivery were collected, dried at 65°C in a ventilated oven for 48 h and ground to pass a 1 mm sieve. Diet samples were analysed for crude nutrient composition by using near-infrared spectroscopy by Massey Nutrition Laboratories (Palmerston North, New Zealand), as described by Corson et al. (1999) (Table 2).
| Treatment group | Treatment level | Ash | s.d. | CP | s.d. | Lipid | s.d. | SSS | s.d. | NDF | s.d. | ADF | s.d. | ME | s.d. | |
|---|---|---|---|---|---|---|---|---|---|---|---|---|---|---|---|---|
| Supplement group | Low intake | 98.0 | na | 217.5 | na | 39.0 | na | 160.8 | na | 402.5 | na | 189.5 | na | 12.3 | na | |
| Medium intake | na | na | na | na | na | na | na | |||||||||
| High intake A | 84.5 | 1.5 | 164.5 | 9.2 | 24.8 | 1.3 | 69.5 | 8.7 | 472.8 | 9.5 | 270.8 | 4.6 | 10.1 | 0.2 | ||
| High intake A | 72.7 | 4.9 | 111.1 | 20.8 | 34.1 | 1.5 | 138.7 | 13.2 | 487.9 | 16.8 | 257.7 | 12.1 | 11.0 | 0.4 | ||
| Supplement feed B | 46.0 | 120.0 | 70.0 | nd | 100.0 | nd | 12-0 | |||||||||
| Age group | 2.5 months | 75.7 | 3.5 | 127.0 | 15.5 | 25.7 | 1.1 | 119.7 | 21.7 | 477.7 | 21.4 | 270.5 | 8.7 | 10.4 | 0.3 | |
| Calf starter | 32.5 | 200.0 | 35.0 | nd | 244.5 | 93.0 | 12-0 | |||||||||
| 4 months | 92.4 | 5.4 | 168.6 | 12.9 | 25.7 | 2.1 | 33.4 | 12.1 | 519.9 | 29.2 | 290.4 | 10.8 | 9.3 | 0.2 | ||
| 8 months | 96.5 | 3.1 | 210.0 | 11.8 | 34.5 | 2.4 | 54.9 | 19.5 | 502.0 | 28.9 | 252.8 | 12.7 | 10.5 | 0.3 | ||
| 12 months | 89.2 | 4.3 | 186.2 | 17.4 | 21.4 | 3.3 | 23.1 | 8.1 | 454.2 | 20.0 | 268.7 | 12.7 | 9.3 | 0.3 | ||
| 16 months | 69.8 | 2.9 | 101.8 | 15.0 | 30.0 | 1.6 | 112.3 | 4.3 | 522.3 | 12.3 | 287.5 | 9.3 | 10.2 | 0.2 |
CP, crude protein; SSS, soluble sugars and starch; NDF, neutral detergent fibre; ADF, acid detergent fibre; ME, predicted metabolisable energy content; s.d., standard deviation; na, not available; nd, not determined.
Statistical analyses
The statistical analysis was performed using R (ver. 4.13, R Core Team 2021). In the exploratory data analysis step we used correlations to determine which numerical variables showed signs of a relationship with the response variable of interest, methane (CH4) output.
In the modelling step, we fitted linear mixed models with the function lmer from the R package ‘lme4’, ver. 1.1-30 (Bates et al. 2015; Kuznetsova et al. 2017). The numerical variables evaluated as predictors for the linear mixed-effects model, based on the correlation analysis, were individual diet chemical components, feeding level, bodyweight, DMI and age. In addition, the factors breed, physiological state, sex and supplementation level were also considered as fixed effects. The animal ID was used as a random effect to account for variation among the animals.
Note that to make the variable bodyweight more comparable to the other variables in the model, we converted it to a more common scale. This was achieved by redefining bodyweight such that a unit change in weight is 10 kg instead of just one. The rescaled bodyweight variable is named BW.
Initially, we fitted a full model with all these variables as well as respiration-chamber ID and measurement day as fixed effects. We found that there were no differences in measurements among respiration chambers, on average, but the measurement day did have an effect. For the development of the final predictive model for CH4 production of pasture-fed cattle, chamber ID was thus removed from the dataset and measurement day included in the model as a random effect.
The model selection was a two-step process. In the first step, we compared model of all possible subsets of the fixed-effect components of interest using the function dredge from the R package ‘MuMIn’, ver. 1.46 (Barton 2022). The models were compared using the corrected Akaike’s information criterion (AICc), where a lower value indicates a better model. The 10 models with the lowest AICc values are shown in Table 3. The model with the lowest AICc included the diet/supplement parameter, an indicator variable representing the animals that were supplemented with 30% concentrate. This model was excluded as the number of supplemented animals were too low to make it useful for prediction.
| Model | AICc | d.f. | Intercept | Age | BW | Sup | DMI | Phys_state | |
|---|---|---|---|---|---|---|---|---|---|
| 1 | 4651.91 | 10 | −5.26 | 4.40 | 2.18 | + | 10.33 | + | |
| 2 | 4659.76 | 9 | −6.25 | 5.06 | 2.21 | − | 10.27 | + | |
| 3 | 4663.71 | 9 | −4.46 | 2.27 | + | 10.60 | + | ||
| 4 | 4675.01 | 8 | −5.30 | 2.32 | − | 10.66 | + | ||
| 5 | 4764.53 | 9 | 36.88 | 6.41 | + | 14.01 | + | ||
| 6 | 4775.09 | 8 | 36.67 | 6.82 | − | 14.14 | + | ||
| 7 | 4776.49 | 8 | 2.02 | 6.54 | 1.56 | + | 13.52 | − | |
| 8 | 4788.96 | 8 | 41.33 | + | 14.57 | + | |||
| 9 | 4794.57 | 7 | 2.44 | 6.72 | 1.54 | − | 13.78 | − | |
| 10 | 4802.10 | 7 | 41.29 | − | 14.83 | + |
−, not included in the model; +, included in the model.
In the second step, we calculated the variance inflation factor (VIF) scores, using the VIF function from the ‘car’ R package, ver. 3.1 (Fox and Weisberg 2019), of the predictors in each of the listed models. If a component has a VIF value greater than 10, then this indicates that the model has a problem with collinearity. We then selected the highest-ranking model (with the lowest AICc value) that had no collinear predictors.
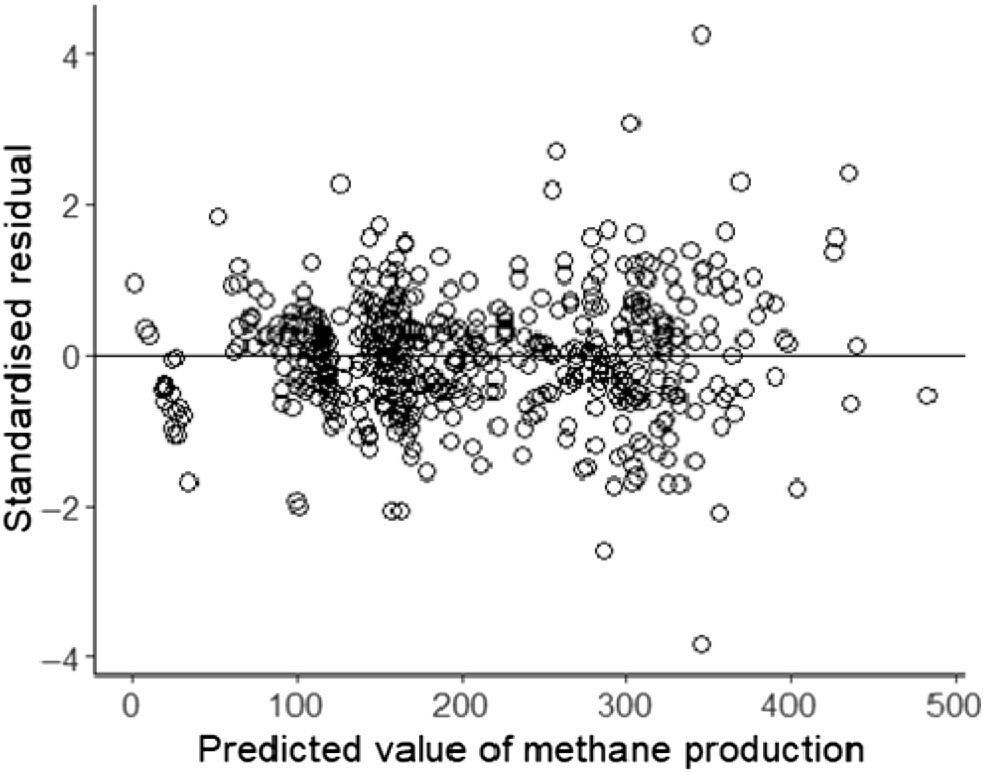
Inspection of the residual plot for the final model of the CH4 production predictions highlighted a degree of heteroscedasticity, but the violation was not severe enough to warrant a log-transformation of the data. The emmeans function from the R package ‘emmeans’ 1.7.5 (Barton 2022; Russell 2022) was used to compute predicted values on the basis of the final model.
Note that a linear mixed model with CH4 yield as the response was ruled out, given that in the exploratory data-analysis step, we found that none of the possible numerical predictors was significantly correlated with CH4 yield.
Results
The average DMI and CH4 production of the young animals increased with age, except for the oldest group at 16 months of age (Table 4). The pasture that this group of cattle received was of poor quality with very low protein content (Table 2). The average CH4 yield of these five groups of animals varied from 18.4 to 26.3 g kg−1, but no apparent trend with age was observed.
| Treatment group | Treatment level | n = | DMI (kg day−1) | s.d. | pM (g day−1) | s.d. | yM (g kg−1 DMI) | s.d. | |
|---|---|---|---|---|---|---|---|---|---|
| Supplement group | Low intake | 8 | 5.8 | 1.66 | 138 | 29.9 | 24.5 | 4.68 | |
| Medium intake | 11 | 12.0 | 2.44 | 288 | 41.5 | 24.6 | 4.30 | ||
| High intake | 12 | 15.9 | 3.06 | 363 | 63.9 | 23.6 | 5.57 | ||
| Age group | 2.5 monthsA | 12 | 0.6 | 0.22 | 14 | 4.2 | 25.6 | 13.86 | |
| 4 months | 6 | 3.0 | 0.77 | 79 | 8.0 | 27.6 | 7.63 | ||
| 8 months | 11 | 5.8 | 1.08 | 105 | 11.1 | 18.4 | 2.24 | ||
| 12 months | 12 | 8.0 | 1.23 | 160 | 14.0 | 20.3 | 2.36 | ||
| 16 months | 9 | 5.9 | 0.66 | 149 | 16.5 | 25.2 | 1.84 | ||
| s.e.d. | 0.69 | 16.5 | 1.95 | ||||||
| P-value | <0.001 | <0.001 | <0.001 | ||||||
| Jonker et al. (2017) | 191 | 9.3 | 3.60 | 218 | 81.3 | 23.9 | 3.68 |
The DMI levels for the low, medium and high intake groups of the concentrate supplemented animals were on average 5.8, 12.0 and 15.9 kg DM day−1, respectively (Table 4). On average, supplementation at a level of 30% of the dry matter offered did not affect CH4 yield.
Exploratory analysis of the combined dataset
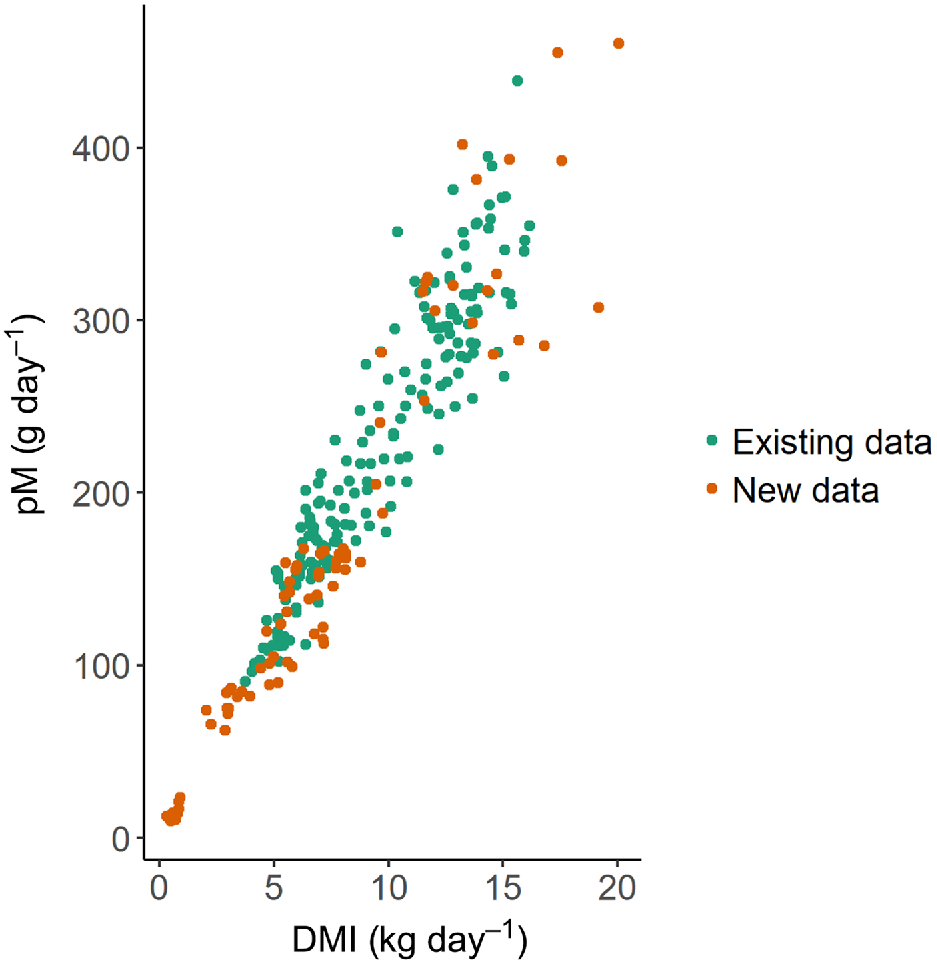
The results of the animal trials described above were analysed with data generated previously (Jonker et al. 2016, 2017). These were two previous datasets of CH4 emissions from growing beef cattle and non-lactating and lactating dairy cattle fed on 100% fresh-cut pasture, totalling 191 measurements over 16 different pasture-feeding periods. The new data presented here added another 81 measurements to the combined dataset. The distribution of the CH4 production (g day−1) data of the previous and the new dataset is highly correlated to DMI (Fig. 1). The new dataset extended the range mostly to the lower DMI ranges, but also added some high-DMI data.
Relationship between methane production (pM) and dry-matter intake (DMI) for the existing dataset reported previously (Jonker et al. 2016, 2017) and the new dataset reported here.
The exploratory data analysis showed that the highest correlation of CH4 production was observed for DMI (r = 0.956), followed by feeding level, expressed as multiples of the maintenance energy requirements (r = 0.852), BW of the animal (r = 0.773) and age (r = 0.735) (Fig. 2). However, some of these variables were highly intercorrelated, with pair-wise r values ranging from 0.490 to 0.913.
Pearson correlation matrix of animal and pasture parameters. CH4, methane production; yM, methane yield; dm, dry-matter content; ca, crude-ash content; cp, crude-protein content; cl, crude-lipid content; ss, soluble sugar content; ndf, neutral detergent fibre content; adf, acid detergent fibre content; me, metabolisable energy content; weight, bodyweight; fl, feeding level as multiples relative to maintenance energy requirements; dmi, dry-matter intake; age, animal age; bw, body weight.
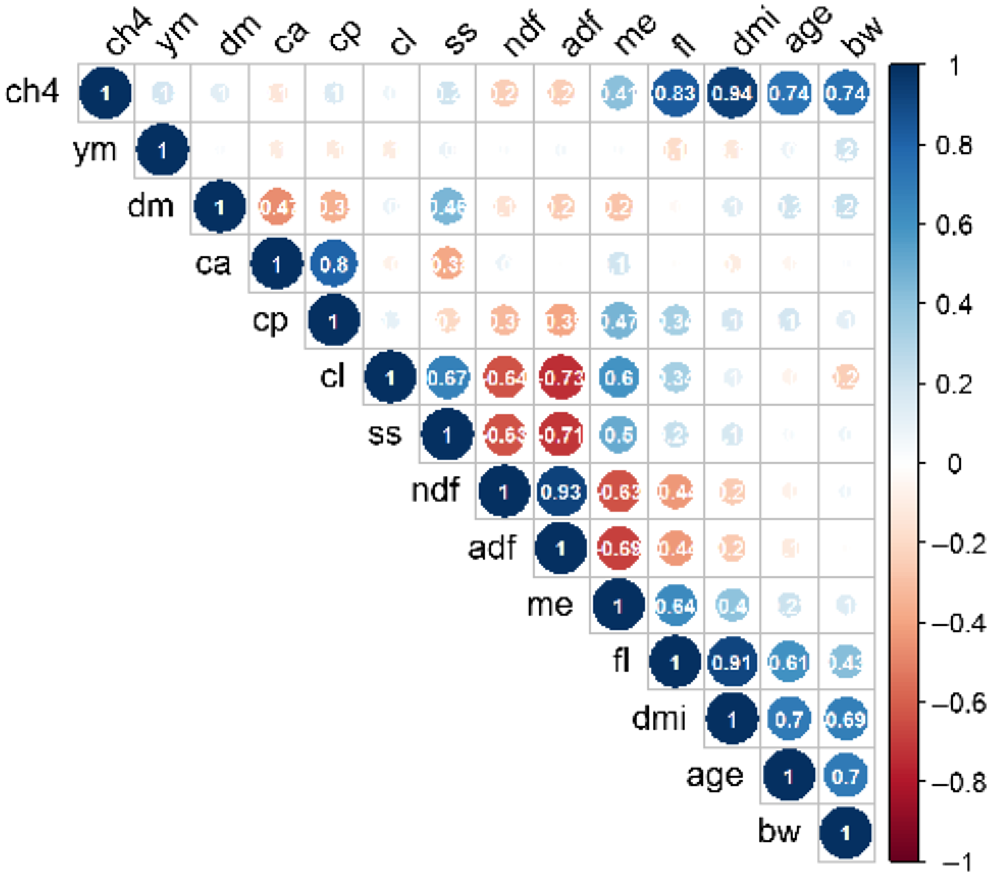
The correlation of all diet composition parameters with CH4 production were low. Methane production was only slightly positively correlated with crude protein (r = 0.19) and soluble sugar content (r = 0.20), while it was a slightly negatively correlated with the fibre fractions acid detergent fibre (r = −0.24) and neutral detergent fibre (r = −0.23) and there was a negligible relation with the lipid (r = 0.06) and the DM content of the diet (r = 0.11). Diet composition was expressed as a proportion of total DM and therefore all these parameters are intercorrelated, with r values ranging from −0.75 to 0.93. The highest correlation of CH4 production with any diet parameter was observed for ME content of the diet (r = 0.43) (Figs 2, 3).
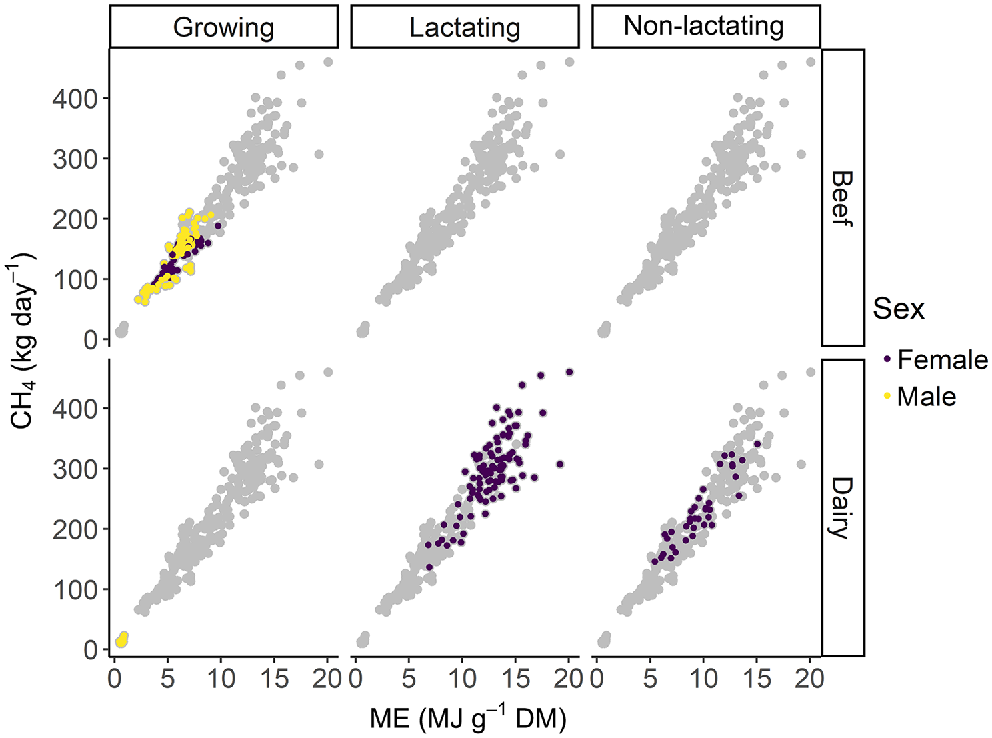
Relationship between methane production (CH4) and metabolisable energy (ME) content of the pasture in male and female growing, lactating and non-lactating beef and dairy cattle.
When DMI was accounted for by expressing CH4 production per kilogram of DMI, neither dietary nor animal factors were strongly correlated with CH4 yield. The highest correlation (r = 0.242) was observed between CH4 yield and BW of the animals.
Methane prediction model
The selected model for predicting CH4 emissions contains DMI, physiological state, BW and age as main effects (Table 5) because it had a low AICc and no collinearity was identified, as indicated by the general VIFs (Table 6), which were all below the critical value of 10. The model equation is given as follows:
| Variable | Sum of squares | Mean squares | Numerator degrees of freedom | Denominator degreees of freedom | F-value | P-value | |
|---|---|---|---|---|---|---|---|
| Age | 3203 | 3203 | 1 | 356.32 | 16.02 | 0.0001 | |
| BW | 29 236 | 29 236 | 1 | 472.71 | 146.21 | 0.0000 | |
| DMI | 81 748 | 81 748 | 1 | 424.84 | 408.84 | 0.0000 | |
| Phys_state | 31 105 | 15 553 | 2 | 462.70 | 77.78 | 0.0000 |
The package ‘lmerTest’, ver. 3.1-3, was used to compute the Satterthwaite approximations for the F statistic degrees of freedom (DF).
| Variable | GVIF | d.f. | GVIF (1 (2 × d.f.)−1) | |
|---|---|---|---|---|
| Age | 3.357 | 1 | 1.832 | |
| BW | 2.683 | 1 | 1.638 | |
| DMI | 2.476 | 1 | 1.573 | |
| Phys_state | 3.872 | 2 | 1.403 |
The units for dry-matter intake (DMI) and rescaled bodyweight (BW) are kg day−1 and kg respectively. The basal value for the physiological stage is growing animals.
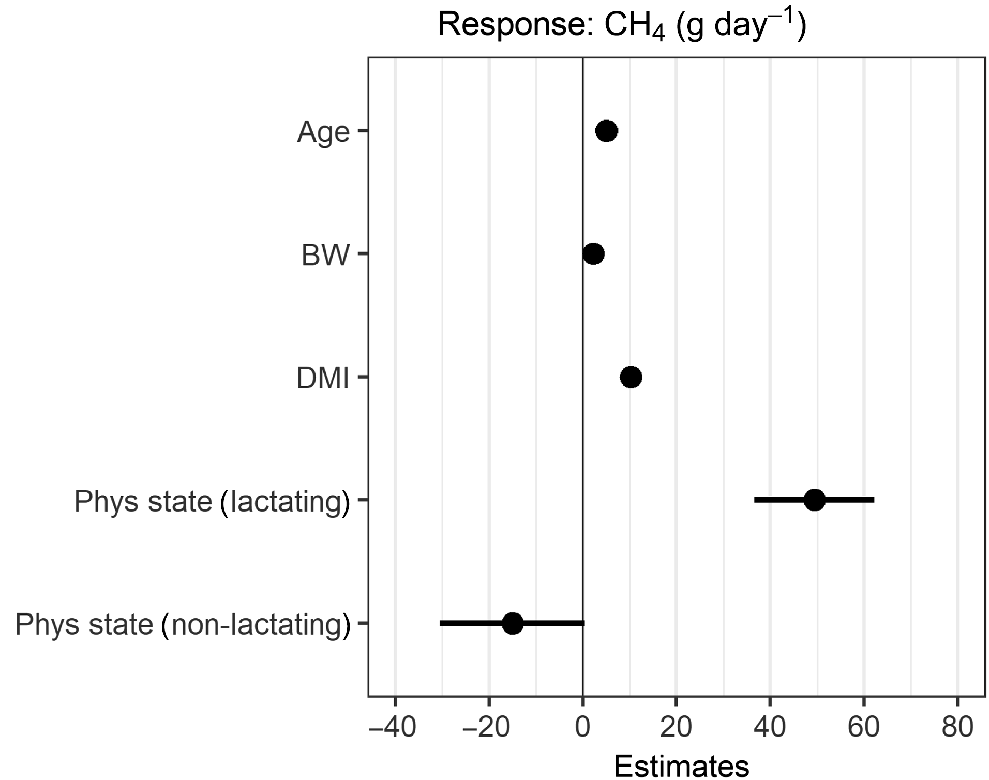
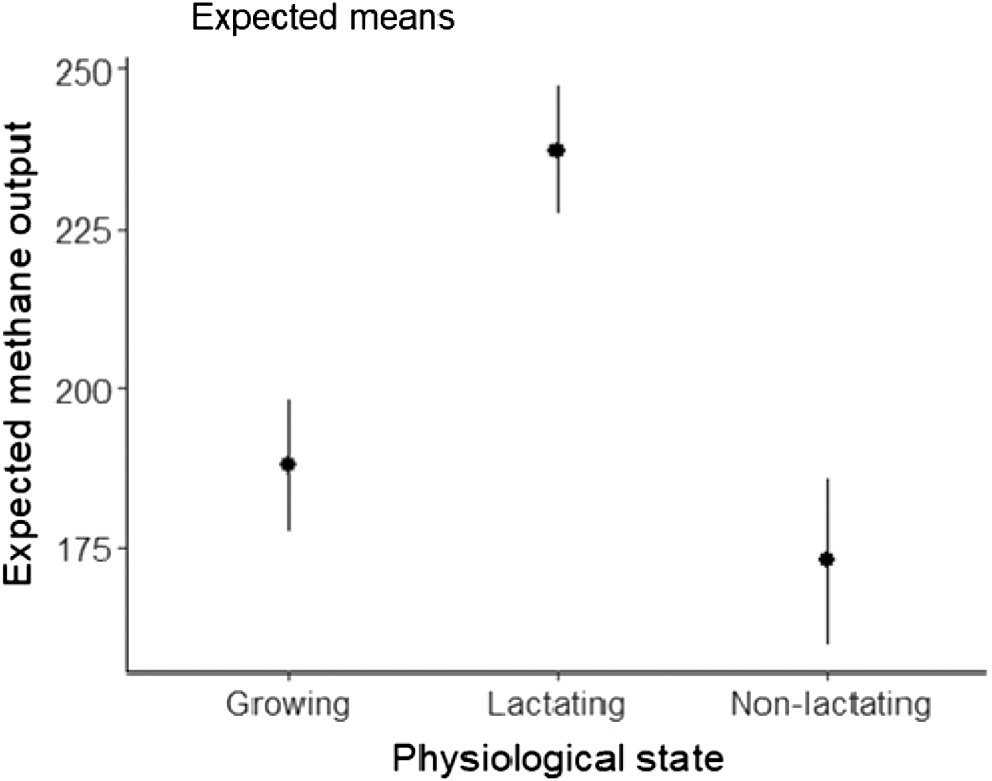
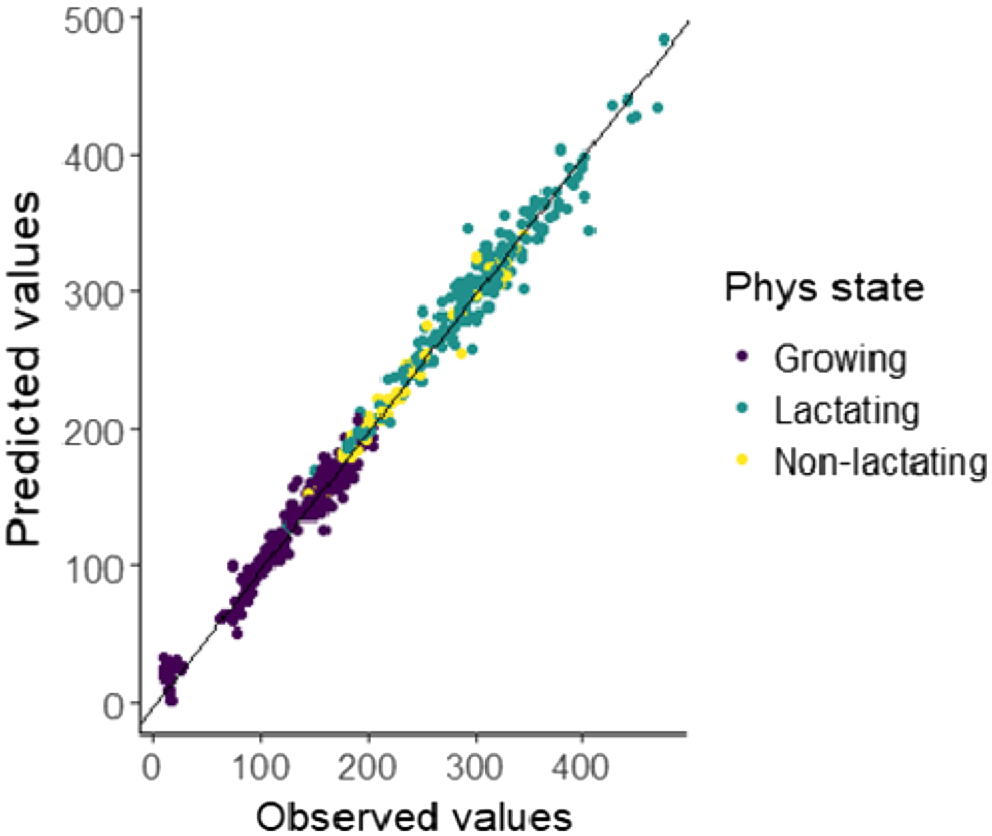
The estimated model coefficients and their uncertainty are shown in Fig. 4. On the basis of the model parameters, DMI and the lactating animals have the largest influence on CH4 production (Fig. 5). Male animals are predicted to have a higher CH4 production than females, all other things being equal. The predictions indicate that lactating animals had the highest CH4 production at the same intake level (Fig. 6). The comparison of predicted with measured CH4 production data showed that the predictions from the model follow the observations well (Fig. 7).
Model coefficients and their errors for dry-matter intake (DMI), bodyweight (BW), physiological stage (Phys.state) and sex. Note: coefficient for BW is based on 10 kg bodyweight increase.
Predicted CH4 yield
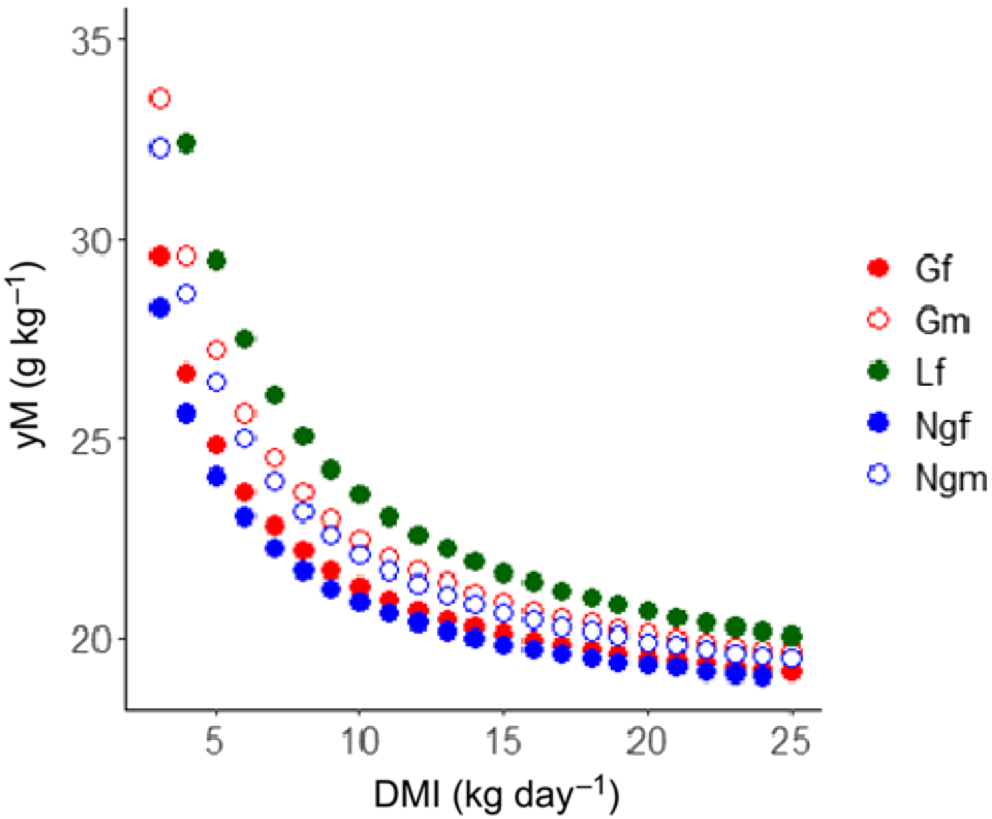
When the predictions of CH4 production (g day−1) are converted into CH4 yield (g kg−1 DMI), it becomes evident that the model predicts a lower CH4 yield because the DMI increases for each class of animal (Fig. 8). When the classes are compared at a fixed DMI, for instance 10 kg, the CH4 yields of the growing females, growing males, lactating females, non-lactating females and mature males were 21.30, 22.50, 23.62, 20.91 and 22.11 g kg−1 respectively. These data indicated that at a given DMI, lactating cattle have the highest CH4 yield across the groups. The predicted CH4 yield averaged over the observed DMI range was 24.08, 26.21, 22.12, 21.00 and 22.23 g kg−1 DMI for growing females, growing males, lactating females, non-growing females and non-growing males respectively.
Raw predictions of methane yield (yM; g kg−1 DMI; i.e. predicted methane production divided by dry-matter intake) in response to increasing DMI levels for growing females (Gf), growing males (Gm), lactating females (Lf), non-lactating females (Ngf), and non-growing males (Ngm) at intake levels measured.
Discussion
Accurate predictions of enteric CH4 emissions from livestock are becoming increasingly important for national GHG inventories, international reporting and emissions trading schemes. The majority of the ruminal CH4 is formed by using the hydrogen released during the fermentation of feed to reduce carbon dioxide (Ungerfeld 2020). Consequently, CH4 production is mainly driven by the amount of feed eaten but also by the overall feed digestibility (Moe and Tyrrell 1979) because both these parameters drive hydrogen production. However, different diets also lead to fermentation pathways that result in different amounts of hydrogen produced per unit of carbohydrate fermented (Wolin 1960). This would suggest that changes in seasonal pasture composition could affect the overall CH4 production. In the absence of inhibitory compounds or alternative hydrogen sinks, the interplay among feed intake, feed digestibility, and feed composition determine the amount of CH4 produced by a ruminant consuming a given diet. In fact, most CH4 prediction equations operate with one or more of these parameters (Mc Court et al. 2006; Yan et al. 2009; Niu et al. 2018; van Lingen et al. 2019).
The feed basis for cattle in New Zealand is limited and consists mainly of good-quality, intensively managed, ryegrass-dominant pastures. In general, little supplementation is used and it is mainly confined to lactating animals or to cover pasture-growth shortages (DairyNZ 2021). However, pasture composition varies considerably across the seasons (Wilson et al. 1995; Litherland and Lambert 2007). Although the neutral and acid detergent fibre contents of the pasture were negatively correlated with CH4 production, while soluble sugar and crude protein contents were positively correlated, these correlations were very weak. This is in contrast to the observations that fibre content leads to greater acetate and, consequently, greater hydrogen and CH4 production (Beauchemin et al. 2009).
High-forage diets, on average, lead to a lower DMI and a lower CH4 production, but will result in a higher CH4 yield (Beauchemin and McGinn 2006). High-forage diets are less digestible and forage digestibility decreases with an increasing fibre content (Lopez et al. 1998), which leads to lower CH4 emissions. Increased fibre components lead to lower proportions of components that are completely fermentable, such as soluble sugars and proteins, therefore further decreasing the amount of CH4 production. However, the over-riding factor in this interplay between pasture composition and CH4 production appears to be diet digestibility. When fresh-cut pasture was fed to cattle in the current study, the forage composition had no significant effect on CH4 production prediction. This was consistent with a study on the effect of high- and low-quality grass-based forage diets in zebu cattle (Perry et al. 2017) and also with the study by Hammond et al. (2016) where the natural neutral detergent fibre content or the addition of neutral detergent fibre to a forage had no effect on CH4 yield in cattle. However, the effect of forage quality on CH4 emission was variable from experiment to experiment, as was shown in a meta-analysis by van Gastelen et al. (2019), where CH4 production was driven by gross-energy intake rather than ME intake, as was demonstrated in our model. In that study, the high-forage–high-CH4 effect was observed mainly when the ratio of forage to concentrate was changed, but was much was less apparent when forage fibre content in an all forage diet was increased.
Animal parameters such as bodyweight, sex, age, and feeding level all affected CH4 emissions in the current dataset. However, these parameters are confounded. For example, all dairy cows were female, and were, on average, older animals, heavier, and had greater energy requirements because of their physiological stage, and therefore had a greater feeding level than do growing animals. However, feeding level was not a predictor of CH4 production in our analysis. Our results were in contrast to those from the meta-analysis of dairy and beef cattle fed grass silage-based diets where feeding level was an important predictor of CH4 production (Yan et al. 2000). In contrast, in a study comparing high-forage and high-grain diets at restricted and ad libitum feeding levels, the CH4 yield was affected neither by the diet type or the feeding level (Beauchemin and McGinn 2006).
The effect of age on CH4 emissions is not very conclusive in the literature. Methane yield in lambs differs only in one of the four measurements at 35 weeks of age (Knight et al. 2008). In one study, cattle age did not affect the CH4 emissions per kilogram of BW gain for Simmental and Angus calves for up to 10 months (Estermann et al. 2002). However, Jiao et al. (2014a), in their analysis, found that age and BW affected CH4 production of cattle in a similar way as was observed in our analysis.
In terms of CH4 yield (model-predicted CH4 production divided by DMI), the current model predicted that lactating cattle at a given DMI had a higher CH4 yield than did growing and non-lactating cattle. This is in contrast to a meta-analysis of the Australian cattle systems where no differences in CH4 production for growing and dairy cattle were observed (Charmley et al. 2016). Similarly, the predictions of CH4 emissions from beef and lactating dairy cattle were similar in the meta-analysis of Yan et al. (2000). However, when CH4 production of the cattle was averaged over the DMI realised for growing, lactating and non-lactating cattle, the lowest CH4 yield was predicted for lactating and non-lactating cattle because the predicted CH4 yield decreased with DMI and these two groups had a higher DMI than did growing cattle.
When calculated for actual DMI, the predicted CH4 yield from dairy cows was 22.1 g kg−1 DMI, which was slightly higher than the estimates of 21.4, 18.2 and 20.1 g kg−1 DMI for Europe, the USA and elsewhere (Niu et al. 2018), but similar to values for dairy and beef cattle fed on grass silage-based diets (22.2 g kg−1 DMI) (Yan et al. 2000). Furthermore, Stergiadis et al. (2016) concluded that predictions using most models developed (such as the ones of Niu et al. 2018) underestimate CH4 emissions from animals fed at low feeding levels. This is in agreement with our predictions that show a higher CH4 yield at lower feed intakes and a negative correlation between feeding level and methane yield was observed. The parameter diet representing a single supplementation level of concentrate was not included into this analysis. However, we recommend a more detailed examination of the effect of strategic supplementation of cattle with high quality concentrates on CH4 yield, because concentrates have been shown to decrease CH4 yield in cattle (Jiao et al. 2014b; Doreau et al. 2011).
Conclusions
Dry-matter intake by far explains most of the variation in CH4 production in the current dataset. With DMI in the model, pasture composition did not improve the model predictions of CH4 production, but adding animal-related parameters including bodyweight, sex and physiological stage were useful predictors in the best performing linear model developed. However, a cross-validation dataset should be generated to independently test the model.
Data availability
The data that support this study will be shared upon reasonable request to the corresponding author.
Declaration of funding
This work was funded by the Ministry for Primary Industries, New Zealand (SOW 405030).
Acknowledgements
We gratefully acknowledge Edgar Sandoval, Sarah Maclean, German Molano, Frederick Knol and Greg Skelton for their excellent technical work with the animals and the respiration chambers. Thanks go to Katherine Lowe and David Pacheco for critically reading the manuscript.
References
Appuhamy JADRN, France J, Kebreab E (2016) Models for predicting enteric methane emissions from dairy cows in North America, Europe, and Australia and New Zealand. Global Change Biology 22, 3039-3056.
| Crossref | Google Scholar | PubMed |
Barton K (2022) MuMIn: multi-model inference. R package version 1.46.0. Available at https://cran.r-project.org/web/packages/MuMIn/MuMIn.pdf
Bates D, Machler M, Bolker B, Walker S (2015) Fitting linear mixed-effects models using lme4. Journal of Statistical Software 67, 1-48.
| Crossref | Google Scholar |
Beauchemin KA, McGinn SM (2006) Enteric methane emissions from growing beef cattle as affected by diet and level of intake. Canadian Journal of Animal Science 86, 401-408.
| Crossref | Google Scholar |
Beauchemin KA, McAllister TA, McGinn SM (2009) Dietary mitigation of enteric methane from cattle. CAB reviews: perspectives in agriculture, veterinary Science. Nutrition and Natural Resources 4, 1-8.
| Google Scholar |
Brask M, Lund P, Weisbjerg MR, Hellwing ALF, Poulsen M, Larsen MK, Hvelplund T (2013) Methane production and digestion of different physical forms of rapeseed as fat supplements in dairy cows. Journal of Dairy Science 96, 2356-2365.
| Crossref | Google Scholar |
Charmley E, Williams SRO, Moate PJ, Hegarty RS, Herd RM, Oddy VH, Reyenga P, Staunton KM, Anderson A, Hannah MC (2016) A universal equation to predict methane production of forage-fed cattle in Australia. Animal Production Science 56, 169-180.
| Crossref | Google Scholar |
Corson DC, Waghorn GC, Ulyatt MJ, Lee J-C (1999) NIRS: forage analysis and livestock feeding. Proceedings of the New Zealand Grassland Association 61, 127-132.
| Google Scholar |
Doreau M, van der Werf HMG, Micol D, Dubroeucq H, Agabriel J, Rochette Y, Martin C (2011) Enteric methane production and greenhouse gases balance of diets differing in concentrate in the fattening phase of a beef production system. Journal of Animal Science 89, 2518-2528.
| Crossref | Google Scholar | PubMed |
Estermann BL, Sutter F, Schlegel PO, Erdin D, Wettstein HR, Kreuzer M (2002) Effect of calf age and dam breed on intake, energy expenditure, and excretion of nitrogen, phosphorus, and methane of beef cows with calves. Journal of Animal Science 80, 1124-1134.
| Crossref | Google Scholar | PubMed |
Hammond KJ, Jones AK, Humphries DJ, Crompton LA, Reynolds CK (2016) Effects of diet forage source and neutral detergent fiber content on milk production of dairy cattle and methane emissions determined using GreenFeed and respiration chamber techniques. Journal of Dairy Science 99, 7904-7917.
| Crossref | Google Scholar | PubMed |
Jiao H, Yan T, Wills DA, Carson AF, McDowell DA (2014a) Development of prediction models for quantification of total methane emission from enteric fermentation of young Holstein cattle at various ages. Agriculture, Ecosystems & Environment 183, 160-166.
| Crossref | Google Scholar |
Jiao HP, Dale AJ, Carson AF, Murray S, Gordon AW, Ferris CP (2014b) Effect of concentrate feed level on methane emissions from grazing dairy cows. Journal of Dairy Science 97, 7043-7053.
| Crossref | Google Scholar | PubMed |
Jonker A, Muetzel S, Molano G, Pacheco D (2016) Effect of fresh pasture forage quality, feeding level and supplementation on methane emissions from growing beef cattle. Animal Production Science 56, 1714-1721.
| Crossref | Google Scholar |
Jonker A, Molano G, Koolaard J, Muetzel S (2017) Methane emissions from lactating and non-lactating dairy cows and growing cattle fed fresh pasture. Animal Production Science 57, 643-648.
| Crossref | Google Scholar |
Jonker A, Green P, Waghorn G, van der Weerden T, Pacheco D, de Klein C (2020) A meta-analysis comparing four measurement methods to determine the relationship between methane emissions and dry-matter intake in New Zealand dairy cattle. Animal Production Science 60, 96-101.
| Crossref | Google Scholar |
Knight TW, Molano G, Clark H, Cavanagh A (2008) Methane emissions from weaned lambs measured at 13, 17, 25 and 35 weeks of age compared with mature ewes consuming a fresh forage diet. Australian Journal of Experimental Agriculture 48(2), 240-243.
| Crossref | Google Scholar |
Kuznetsova A, Brockhoff PB, Christensen RHB (2017) lmerTest package: tests in linear mixed effects models. Journal of Statistical Software 82, 1-26.
| Crossref | Google Scholar |
Litherland AJ, Lambert MG (2007) Factors affecting the quality of pastures and supplements produced on farms. In ‘Pastures and supplements for grazing animals. Occasional Publication, no. 14’. (Eds PV Rattray, IM Brookes, AM Nicol) pp. 81–96. (New Zealand Society of Animal Production: Hamilton, New Zealand)
Lopez S, Carro MD, Gonzalez JS, Ovejero FJ (1998) Comparison of different in vitro and in situ methods to estimate the extent and rate of degradation of hays in the rumen. Animal Feed Science and Technology 73, 99-113.
| Crossref | Google Scholar |
Mc Court A, Yan T, Mayne CS, Porter MG (2006) Prediction of methane output in beef cattle from indirect respiration calorimetry data. International Congress Series 1293, 46-49.
| Crossref | Google Scholar |
Ministry for the Environment (2020) New Zealand’s greenhouse gas inventory 1990-2018. Available at https://www.mfe.govt.nz/sites/default/files/media/Climate%20Change/new-zealands-greenhouse-gas-inventory-1990-2018-vol-1.pdf [Verified 24 July 2018]
Moe PW, Tyrrell HF (1979) Methane production in dairy cows. Journal of Dairy Science 62, 1583-1586.
| Crossref | Google Scholar |
Niu M, Kebreab E, Hristov AN, Oh J, Arndt C, Bannink A, Bayat AR, Brito AF, Boland T, Casper D, Crompton LA, Dijkstra J, Eugène MA, Garnsworthy PC, Haque MN, Hellwing ALF, Huhtanen P, Kreuzer M, Kuhla B, Lund P, Madsen J, Martin C, McClelland SC, McGee M, Moate PJ, Muetzel S, Muñoz C, O’Kiely P, Peiren N, Reynolds CK, Schwarm A, Shingfield KJ, Storlien TM, Weisbjerg MR, Yáñez-Ruiz DR, Yu Z (2018) Prediction of enteric methane production, yield, and intensity in dairy cattle using an intercontinental database. Global Change Biology 24, 3368-3389.
| Crossref | Google Scholar | PubMed |
Perry LA, Al Jassim R, Gaughan JB, Tomkins NW (2017) Effect of feeding forage characteristic of wet- or dry-season tropical C4 grass in northern Australia, on methane production, intake and rumen outflow rates in Bos indicus steers. Animal Production Science 57, 2033-2041.
| Crossref | Google Scholar |
Pickering N, Gibb J, Wear S, Fick J, Tomlin H (2022) Methodology for calculation of New Zealand’s agricultural greenhouse gas emissions, Version 7. Available at https://www.mpi.govt.nz/dmsdocument/13906-detailed-methodologies-for-agricultural-greenhouse-gas-emission-calculation
Pinares-Patiño CS, Hunt C, Martin R, West J, Lovejoy P, Waghorn GC (2018) Chapter 1: New Zealand Ruminant Methane Measurement Centre, AgResearch, Palmerston North. In ‘Technical manual on respiration chamber design’. (Eds C Pinares, G Waghorn) pp. 9–28. (Ministry of Agriculture and Forestry: Wellington, New Zealand)
R Core Team (2021) ‘R: A language and environment for statistical computing.’ (R foundation for statistical computing: Vienna, Austria) Available at https://www.R-project.org
Russell VL (2022) emmeans: estimated marginal means, aka least-squares means. R package version 1.7.4-1. Available at https://CRAN.R-project.org/package=emmeans
Stergiadis S, Zou C, Chen X, Allen M, Wills D, Yan T (2016) Equations to predict methane emissions from cows fed at maintenance energy level in pasture-based systems. Agriculture, Ecosystems & Environment 220, 8-20.
| Crossref | Google Scholar |
Swainson N, Muetzel S, Clark H (2018) Updated predictions of enteric methane emissions from sheep suitable for use in the New Zealand national greenhouse gas inventory. Animal Production Science 58, 973-979.
| Crossref | Google Scholar |
Ungerfeld EM (2020) Metabolic hydrogen flows in rumen fermentation: principles and possibilities of interventions. Frontiers in Microbiology 11, 589.
| Crossref | Google Scholar |
van Gastelen S, Dijkstra J, Bannink A (2019) Are dietary strategies to mitigate enteric methane emission equally effective across dairy cattle, beef cattle, and sheep? Journal of Dairy Science 102, 6109-6130.
| Crossref | Google Scholar |
van Lingen HJ, Niu M, Kebreab E, Valadares Filho SC, Rooke JA, Duthie C-A, Schwarm A, Kreuzer M, Hynd PI, Caetano M, Eugène M, Martin C, McGee M, O’Kiely P, Hünerberg M, McAllister TA, Berchielli TT, Messana JD, Peiren N, Chaves AV, Charmley E, Cole NA, Hales KE, Lee S-S, Berndt A, Reynolds CK, Crompton LA, Bayat A-R, Yáñez-Ruiz DR, Yu Z, Bannink A, Dijkstra J, Casper DP, Hristov AN (2019) Prediction of enteric methane production, yield and intensity of beef cattle using an intercontinental database. Agriculture, Ecosystems & Environment 283, 106575.
| Crossref | Google Scholar |
Wilson GF, Moller S, Parker WJ, Hodgson J (1995) Seasonal differences in pasture composition and nutritional implications. Dairyfarming Annual 47, 46-56.
| Google Scholar |
Wolin MJ (1960) A theoretical rumen fermentation balance. Journal of Dairy Science 43, 1452-1459.
| Google Scholar |
Yan T, Agnew RE, Gordon FJ, Porter MG (2000) Prediction of methane energy output in dairy and beef cattle offered grass silage-based diets. Livestock Production Science 64, 253-263.
| Crossref | Google Scholar |
Yan T, Porter MG, Mayne CS (2009) Prediction of methane emission from beef cattle using data measured in indirect open-circuit respiration calorimeters. Animal 3, 1455-1462.
| Crossref | Google Scholar | PubMed |