

An investigation into potential genetic predictors of birth weight in tropically adapted beef cattle in northern Australia
K. L. Moore A * , D. J. Johnston A and T. P. Grant B
A AGBU, a joint venture of NSW Department of Primary Industries and University of New England, Armidale, NSW 2351, Australia.
B Queensland Department of Agriculture and Fisheries, Toowoomba, Qld 4350, Australia.
Animal Production Science 63(11) 1105-1112 https://doi.org/10.1071/AN23123
Submitted: 11 April 2023 Accepted: 27 April 2023 Published: 25 May 2023
© 2023 The Author(s) (or their employer(s)). Published by CSIRO Publishing. This is an open access article distributed under the Creative Commons Attribution-NonCommercial-NoDerivatives 4.0 International License (CC BY-NC-ND)
Abstract
Context: Birth weight can be an important trait in beef cattle through its association with dystocia and increased likelihood of calf and cow mortality. Recording large numbers of birth weights in beef cattle to obtain a suitable genetic evaluation has often been hard to achieve.
Aims: We assess if coronet circumference measurements taken at birth and weights and coronet circumference measured post-birth are suitable predictors of birth weight for use in genetic evaluation in northern Australian tropically adapted beef breeds.
Methods: Animals were recorded at birth for weight (N = 5352) and coronet circumference (N = 2552), at 3 months of age for the liveweight (N = 2848) and coronet circumference (N = 2855) and liveweight at 6 months (N = 4929). Data were from three tropically adapted beef cattle breeds (viz. Brahman, Droughtmaster and Santa Gertrudis) recorded in two northern Australia herds. Genetic parameters were estimated from a pooled dataset containing all three breeds.
Results: Birth weight had an estimated direct and maternal heritability of 0.51 (0.04) and 0.14 (0.02) respectively. Coronet circumference also had high heritabilities, with estimates at birth and 3 months of 0.50 (0.07) and 0.55 (0.06) respectively. The estimated genetic correlation between birth weight and coronet circumference measured at birth was 0.86 (0.03). Birth weight genetic correlations were 0.75 (0.05) with 3-month weight, 0.69 (0.05) with weaning weight and 0.62 (0.05) with coronet circumference at 3 months.
Conclusions: Coronet measurements could be used in genetic evaluation as a proxy for birth weight. However, the most useful coronet measure was when it was recorded at birth. This would still require catching the calf at birth, thus greatly reducing the benefit of having an alternative measure. Coronet circumference recorded in the branding cradle at 3 months of age was also a useful predictor of birth weight but added little if post-birth weights were available. Importantly, all post-birth indirect measures of birth weight require adjustment for animal age and, therefore, would need recording of the individual calf’s date of birth.
Implications: Coronet circumference recorded at birth and 3 months of age does not appear to be a suitable proxy for genetic evaluation of birth weight.
Keywords: birth weight, Bos indicus beef cattle, genetic correlation, hard-to-measure traits, heritability, hoof coronet circumference, indirect genetic selection, liveweight.
Introduction
Birth weight can be an important trait in beef cattle through its association with dystocia and increased likelihood of calf and cow mortality (Davis 1993; Tozer et al. 2002; Parish et al. 2009; Jeyaruban et al. 2016). More recently, low birth weights have been associated with an increased risk of calf losses in northern Australian breeds (Bunter and Johnston 2013; Bunter et al. 2013). Birth weight can be changed by selection and has been included in the genetic evaluation of most Australian beef breeds. Birth weight is heritable and positively genetically correlated with liveweight at 200 and 400 days of age (Davis 1993; Prayaga and Henshall 2005; Bunter and Johnston 2013), indicating that selection for increased liveweights will be associated with increased birth weights, unless selection pressure can be simultaneously placed on birth weight.
Recording large numbers of birth weights in beef cattle to obtain a suitable genetic evaluation has often been hard to achieve due to the trait being labour intensive to record, requiring portable weighing equipment, and the risk of injury from protective dams. Recording the trait in extensive grazing systems in northern Australia has additional challenges. Hoof tapes that measure coronet circumference have been reported as an indirect measure of birth weight in temperate beef breeds (Ko and Ruble 1990) and were developed as an aid for estimating calf size when assisting a difficult calving. Studies have shown that coronet circumference was positively correlated with both birth weight and calving difficulty in Bos taurus breeds (Tozer et al. 2002; Parish et al. 2009; Hiew et al. 2016), although it has been observed that there is variation in the actual birth weight for the same coronet circumference. No studies have assessed coronet circumference at birth for Bos indicus cattle breeds or whether measurements of coronet circumference recorded at older ages have a relationship with birth weight and could be used in genetic evaluation programs, such as BREEDPLAN (Graser et al. 2005). Coronet circumference at birth requires the daily catching and constraining of calves across the entire calving season. Coronet circumference measurement recorded during the branding process at 3 months of age was undertaken on a single day when each calf is restrained in a branding cradle. This study aimed to assess whether coronet circumference measurements taken at birth and weights and coronet circumference measured post-birth were suitable predictors of birth weight for use in genetic evaluation in northern Australian tropically adapted beef breeds.
Materials and methods
Animal data
Animals in the study were part of a large breeding project in northern Australia (MLA project B.NBP.0759) focused on building the size of genomic reference populations for female reproduction traits in three tropically adapted purebred beef breeds. Project details, and the overall project design, are described by Johnston et al. (2017), with animals managed according to the Code of Practice for the care and use of animals for experimental purposes and approved by the Animal Ethics Committee of the Queensland Department of Agriculture and Fisheries (SA2013/10/445). The data used in this study included Brahman, Droughtmaster and Santa Gertrudis cattle from two Queensland Department of Agriculture and Fisheries (DAF) research facilities, namely, Spyglass Beef Research Facility, 110 km north of Charters Towers, Queensland (19°23′57″S, 145°44′53″E) and Brian Pastures Research Facility, 18 km east–south-east of Gayndah, Queensland (25°39′13.60″S, 151°44′0.92″E). Briefly, Spyglass is characterised as a tropical semi-arid environment with summer-dominant rainfall (610 mm) and predominantly native pastures, with some introduced species. Brian Pastures is a subtropical environment of the subcoastal spear grass region of south-eastern Queensland, with a long-term average annual rainfall of 730 mm, consisting mainly of native pastures, with some improved grass species and legumes.
The Brahman and Droughtmaster breeds were represented at both locations, but the Santa Gertrudis breed was present only at Brian Pastures. Sires were selected within the three breeds to represent current breed populations, especially if the sire was influential and had limited information for female reproduction traits. Sires were mated to cows of the same breed. However, some Droughtmaster and Santa Gertrudis sires were mated to base Tropical Composite cows at the Brian Pastures herd (to increase base cow numbers) that were part of the previous Beef CRC genetics project (Barwick et al. 2009). Genetic linkage was generated across years and locations by the use of both artificial insemination (AI) and natural mate sires. The cow herds consisted of cows of mixed ages, and all females generated in the project were retained in the breeder herd. Within a location, all cows were managed the same, and breeds were run together at all times, apart from a 12-week mating period where the three sire breeds were run separately.
Maiden heifers and first-lactation cows were naturally mated over 12 weeks in multiple-sire mating groups. Cows from their second lactation onward were mated in a two-round fixed-time AI program, with 28 days between the AI rounds. Back-up bulls were used to follow the AI programs and were combined with the natural mating groups at each location. In Year 1 of the project (2014), all calves were the result of natural mating, regardless of the parity status of the cow.
At calving, cows were checked daily, and calves were tagged, birth weight (WT0) was recorded using hand-held spring scales, and coronet circumference (CC0) was measured using the commercially available Calfscale® (Ruble Cattle Services, US Patent No. 4 688 653). The hoof tape was placed around the coronary band of either of the front hooves, tightened, and the circumference was read. The Calfscale® tape provides a predicted birth weight on the basis of the coronet circumference. In the current study, only the actual coronet circumference measurement and not the predicted birth weight from the tape was used in subsequent analyses. Calving ease was not recorded and thus could not be considered in this study.
A tail hair sample from each calf was also obtained for subsequent DNA parentage determination. At approximately 3 months of age (average = 103 days), all calves at each location were mustered and processed through cattle-handling facilities, where calves were restrained in a branding cradle for processing, with a single operator taking measurements. Liveweight at 3 months (WT3m) was recorded using digital scales, and coronet circumference (CC3m) was measured using a standard dressmaker’s tape as the hooves were too large for the Calfscale® hoof tape. Approximately 74 days later, the calves were processed for weaning, and their liveweight (WT6m) was recorded. The numbers of records varied across traits because coronet measures were recorded only in four of the year cohorts, and the recording of coronet circumference at birth commenced after the start of the project; the 2015 cohort had the coronet circumference only at 3 months measured. The number of records was also affected by calf deaths.
Data analysis
Data for birth weight (N = 5969) and weaning weight (N = 6511) was collected on animals born from 2011 to 2019. This included project animals born from 2014, but some base cows at the start of the project also had phenotypes available. Coronet records measured at birth (N = 2778) and 3 months (N = 3204) and weight at 3 months (N = 3197) were available on a subset of years for calves born from 2015 to 2018. Records were removed if they were from a multiple birth, were not purebred due to AI straw mix-ups or mating group errors (except for the planned matings with Tropical Composite dams) and if sex, date of birth, sire, dam or the age of dam were unknown. Birth weights less than 16 kg were suspected premature births and removed as outliers. After all edits, 5352 animals remained in the dataset with a birth weight record, representing 203 sires, with an average paternal half-sib family size of 26 calves (range 1–117). Coronet circumference measured at birth had the fewest records (N = 2552) and represented 126 sires, with a mean number of progeny of 20 (range 1–99).
Significant non-genetic factors were determined using the PROC MIXED procedure of SAS (SAS Institute 2007) with sire fitted as a random effect in all models. Unless otherwise stated, all model terms were fitted as fixed-class effects. Within each breed, non-significant (P > 0.05) terms were removed using a step-wise reduction to determine within-breed models for each trait. Within-breed significant terms were then included in the final model with data from all three breeds, with the addition of a term for the breed and any significant interactions between breed and other terms in the model. There was confounding between cow age and cow breed type (Brahman, Droughtmaster, Santa Gertrudis and Tropical Composite base cows). Therefore, cow age was grouped into the following four age classes: born 2001–2005, 2006–2009 and 2010–2015 and 2016, and then concatenated into a cow-group term (i.e. herd, cow breed type, cow herd of origin and cow age group).
For all traits, the initial model included herd (Spyglass or Brian Pastures), birth cohort (herd and year of birth), calf sex (male or female), calf birth month, cow group and all first-order interactions. A sire × herd interaction term was also considered. CC3m and WT3m were recorded on a single day for each cohort, and calves differed in age by up to 12 weeks. Animal age was fitted as a linear and quadratic covariate effect for each trait. For WT6m, the initial models consisted of the same effects, with the inclusion of age at weaning being fitted as a linear and quadratic covariate.
Genetic parameters for each trait were estimated using univariate mixed linear models in ASReml software (Gilmour et al. 2009) with data from the three breeds being pooled. The mixed linear model was
where y is the vector of observations, b is the vector of fixed effects, u is the vector of random effects, e is the vector of residual effects and X and Z are the respective incidence matrix for fixed and random effects. The fixed effects fitted in the model to estimate genetic parameters were those found significant from the methodology described above.
For all traits, the herd, calf sex, birth cohort nested in herd, birth month, cow group nested in herd and breed were included in the final model. Significant interactions for WT0 were herd × birth month, calf sex × birth month, breed × birth month, breed × calf sex and breed × calf sex × birth month. No additional interactions were significant for CC0 recorded at birth. For WT3m, additional significant interactions were calf sex × birth month, herd × calf sex, breed × birth cohort nested in herd and age fitted as a linear covariate. For CC3m, additional significant interactions were calf sex × birth month, breed × birth cohort nested in herd and breed × birth month. Age (in days) was significant as a quadratic effect. The additional fixed effects for WT6m were herd × birth month, breed × birth month, breed × birth cohort nested in herd and age at weaning (in days) was fitted as linear co-variate.
An animal model was used for all traits, and maternal and maternal permanent-environment effects were fitted. However, models were simplified using the log-likelihood ratio test because, for some traits, the partitioning of maternal effects was limited by size and the existing data structure. For example, for coronet measures, only the 2015-born females had both their own record and progeny with records. A relationship matrix (N = 13 188) was used that contained up to three generations of both paternal and maternal pedigree when known.
A series of bivariate models was used to estimate genetic and phenotypic correlations among all pair-wise combinations of traits. Models used were as described for univariate analyses. Additional bivariate analyses were performed for WT0 and the post-birth traits, where the effect of animal age was removed. In previous models, age covariates were included to remove the significant effect of age on the trait that occurred due to differences in date of birth generated from the 12-week joining period within a location and year. The ability to fit age relies on an accurate date of birth being recorded in these data. However, if WT3m or CC3m were to be used as genetic predictors of birth weight, it is important to investigate what effect not knowing the age of the animal (i.e. age not fitted) has on the genetic-parameter estimates (i.e. heritabilities and genetic correlations). A subset of the full data was required because age (and sire) structures existed within the data generated from the different mating types (i.e. natural mating, two rounds of AI (and AI sires) and AI natural mate back-up sires). Simply removing age from the models from the full dataset resulted in a massive increase in the additive variances and heritabilities (e.g. WT3m h2 = 72%). This occurred because when age was not fitted, the age effects became confounded with sire effects. Therefore subsets of the data were used consisting of only post-birth data from natural mating and those sires with progeny distributed across the calving period for a given year and location. For traits recorded at 3 months, the subset consisted of 1353 and 1348 CC3m and WT3m records respectively, and 2169 WT6m records.
Genetic parameters estimated from the bivariate models were included in MTIndex software (van der Werf 2020) to estimate selection accuracies and response to selection (from a single round) for different combinations of measures, namely, as a single measure and then combinations of post-birth measures. The best linear index I = bX of the measures (X) was evaluated, where from selection-index theory, b = P−1G, the accuracy of I is σI/σA, P is the phenotypic variance–covariance matrix among the measures, G is the genetic covariance matrix relating the measures to the birth weight, σI is the standard deviation of the index, and σA is the additive genetic standard deviation of birth weight.
Results and discussion
Trait means
Raw trait statistics are presented in Table 1. On average, calves were 34.0 kg at birth, with a coefficient of variation of 16%, and had an average coronet circumference of 16.5 cm (ranging from 13.5 cm to 20 cm). At 3 months of age (average 103 days), calves were branded and were on average 133.5 kg in liveweight (ranging from 49.5 kg to 260 kg), with a mean coronet circumference of 23.6 cm (ranging from 18.0 cm to 31.5 cm). At weaning (average calf age of 180.7 days), calves weighed on average 194.1 kg (ranging from 78 kg to 322 kg).
| Trait | Records | Mean | Standard deviation | Minimum | Maximum |
|---|---|---|---|---|---|
| Birth weight (kg) | 5352 | 34.0 | 5.6 | 17.0 | 54.0 |
| Birth coronet circumference (cm) | 2552 | 16.5 | 1.10 | 13.5 | 20.0 |
| 3-month weight (kg) | 2848 | 133.5 | 32.8 | 49.5 | 260.0 |
| 3-month coronet circumference (cm) | 2855 | 23.6 | 1.8 | 18.0 | 31.5 |
| Branding age (days) | 2855 | 102.8 | 27.6 | 20.0 | 170.0 |
| 6-month weight (kg) | 4929 | 194.1 | 33.9 | 78.0 | 322.0 |
| Weaning age (days) | 4929 | 180.7 | 24.7 | 97.0 | 244.0 |
Relationship between coronet circumference and weight
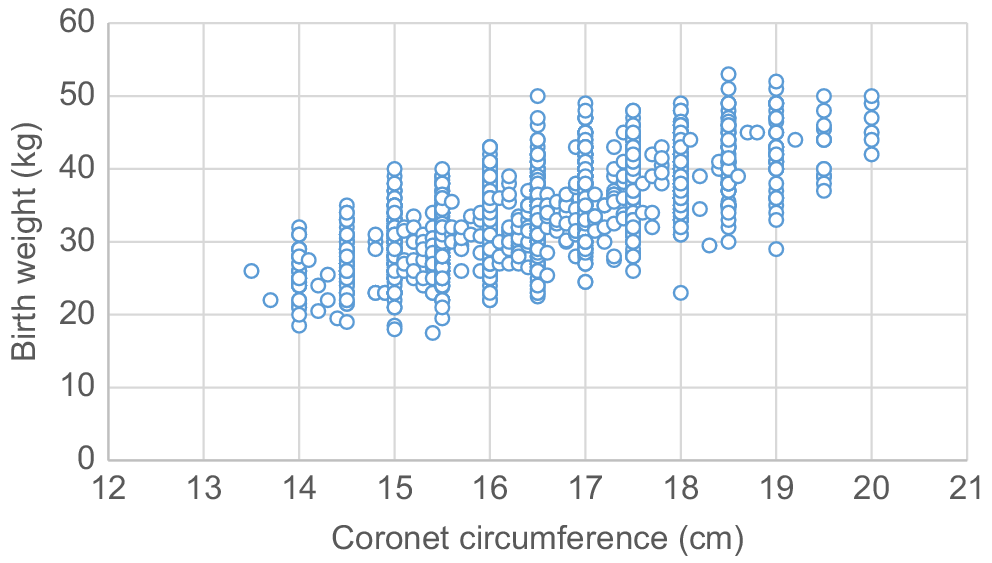
Fig. 1 shows the phenotypic relationship between observed birth weight and birth coronet circumference. A raw correlation of 0.67 existed between the two measures, and considerable variation was observed for the actual birth weight at a given coronet circumference. For example, calves with a coronet circumference of 16.5 cm varied in birth weight from 22.5 to 50.0 kg, suggesting that more than just the skeletal structure of calves influences the birth weight. Tozer et al. (2002) found a positive relationship between coronet circumference and birth weight, but also observed considerable variation in actual birth weights for a given coronet circumference measurement. Parish et al. (2009) predicted birth weights on the basis of coronet circumference measures and found a strong positive relationship (r = 0.85) between the predicted birth weight and the actual birth weight. However, of the different methods of recording birth weight analysed by Parish et al. (2009), the relationship based on coronet circumference was the weakest, with birth weights recorded using hand-held spring scales or as a visual estimate having a stronger relationship with the actual birth weight. The same study found that birth weights predicted from coronet circumference overestimated the low birth weights and underestimated the higher birth weights. M. G. Jeyaruban (2019, pers. comm.) also found, in an unpublished study of Australian Hereford data, that animals at the extremes for birth weight were over- or underestimated using the Calfscale® hoof tape, and there was a large variation in predicted birth weights.
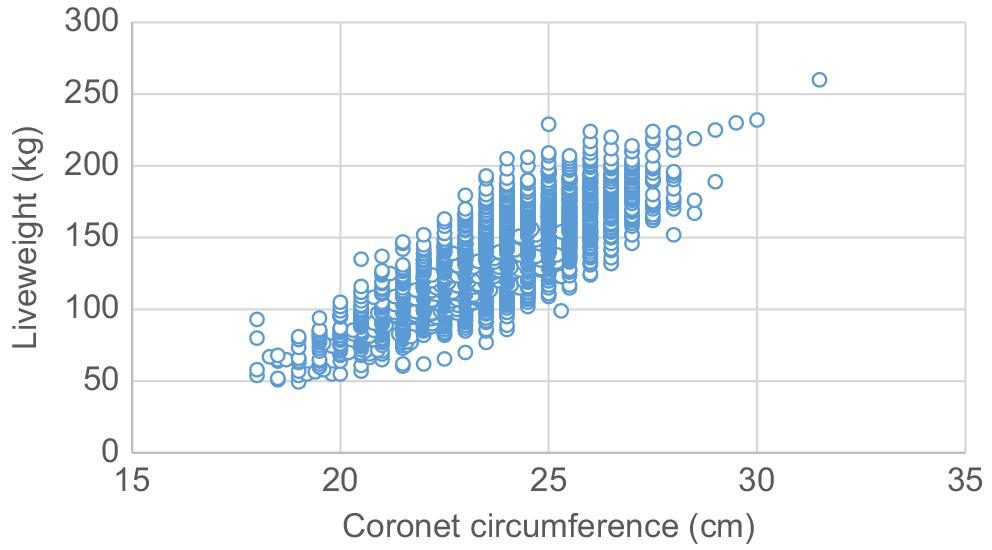
The association observed between coronet circumference and weight at 3 months was higher at r = 0.83 (Fig. 2). There is no known literature considering relationships of coronet circumference measured post-birth.
Variance components and genetic-parameter estimates
Table 2 presents variance components and heritabilities for each trait. The weight traits WT0, WT3m and WT6m had direct heritability estimates of 0.51 (0.04), 0.31 (0.06) and 0.45 (0.05) respectively, and maternal heritability estimates of 0.14 (0.02) 0.11 (0.04) and 0.13 (0.03) respectively. These estimates were similar to those reported in Tropical Composite and Brahman breeds in northern Australia (Bunter and Johnston 2013). In their study, birth weight direct and maternal heritability estimates were 0.48 and 0.13 respectively, and weaning weight estimates were 0.39 and 0.18 respectively, for direct and maternal heritability. These estimates were also within the range reported in the review of tropical cattle (Davis 1993), with heritabilities ranging from 0.23 to 0.78 for direct birth weight, from 0.03 to 0.14 for maternal birth weight, from 0.12 to 0.64 for direct weaning weight and from 0.05 to 0.36 for maternal weaning weight. Prayaga and Henshall (2005) reported slightly lower heritability estimates in a tropical crossbred population, with direct heritabilities of 0.39 and 0.23 respectively, for birth and weaning weight; however, the maternal heritability estimates were similar. Birth weight heritabilities were also slightly higher than in five temperate breeds (Jeyaruban et al. 2016), where estimates ranged for the direct component from 0.35 to 0.46 and for the maternal from 0.08 to 0.10. Chud et al. (2014) estimated in Brazilian Nellore cattle direct heritabilities of 0.32 and 0.37 for birth and weaning weight, with maternal heritability estimates of 0.10 and 0.14 respectively.
| Trait | Va | Vm | Vpe | Ve | Vp | log | (se) | (s.e.) |
|---|---|---|---|---|---|---|---|---|
| WT0 | 11.8 | 2.8 | 0.3 | 8.0 | 22.9 | −10359.4 | 0.51 (0.04) | 0.12 (0.03) |
| WT0A | 11.7 | 3.1 | – | 8.1 | 23.0 | −10359.6 | 0.51 (0.04) | 0.14 (0.02) |
| CC0 | 0.39 | 0.03 | 0.02 | 0.40 | 0.81 | −931.38 | 0.48 (0.08) | 0.02 (0.04) |
| CC0A | 0.41 | – | 0.02 | 0.38 | 0.81 | −931.60 | 0.50 (0.07) | – |
| WT3mA | 70.3 | 24.9 | 33.9 | 101.2 | 230.3 | −8920.71 | 0.31 (0.06) | 0.11 (0.04) |
| CC3m | 0.56 | 0.00 | 0.08 | 0.40 | 1.05 | −1397.30 | 0.54 (0.07) | 0.01 (0.03) |
| CC3mA | 0.57 | – | 0.08 | 0.39 | 1.05 | −1397.33 | 0.55 (0.06) | – |
| WT6mA | 182.0 | 50.6 | 43.4 | 124.5 | 400.4 | −6322.42 | 0.45 (0.05) | 0.13 (0.03) |
WT0, birth weight (kg); CC0, birth coronet circumference (cm); WT3m, 3-month weight (kg); CC3m, 3-month coronet circumference (cm); WT6m, 6-month weight (kg); Va, additive genetic variance; Vm, additive maternal variance; Vpe, permanent environment variance; Ve , residual variance; Vp, phenotypic variance; , direct heritability; , maternal heritability; s.e., standard error.
AIndicates the most parsimonious model after testing random effects for significance with the log-likelihood-ratio test.
CC0 and CC3m were also highly heritable, with estimates of 0.50 (0.07) and 0.55 (0.06) respectively. Both of these measures were estimated to have non-significant maternal heritabilities. However, the existing data structure would have limited the ability to partition maternal effects. Genetic parameters for CC0 or CC3m have not previously been published, with most studies considering only phenotypic relationships. M. G. Jeyaruban (2019, pers. comm.) estimated the direct heritability of predicted birth weight on the basis of coronet circumference and found that it was not significantly different from the heritability estimate for the actual birth weight. Meyer (1995) proposed using skeletal traits as predictor traits in beef cattle genetic evaluations; cannon bone length at birth was estimated to have moderate heritabilities in two Australian beef populations and was highly genetically correlated with birth weight, and was a useful predictor of later weights. However, cannon bone length was recorded only at birth in that study.
Genetic and phenotypic correlations among traits are shown in Table 3. WT3m and WT6m were highly genetically correlated and not significantly different from 1. Both of these traits were estimated to have strong positive genetic correlations with WT0, with estimates of 0.75 (0.05) and 0.69 (0.05) respectively, for WT3m and WT6m. The correlation estimates between WT0 and WT6m were similar to those reported in the literature, with Bunter and Johnston (2013) reporting a genetic correlation of 0.63 and Prayaga and Henshall (2005) reporting an estimate of 0.78. Lower correlation estimates were reported by Davis (1993), who reported the average correlation to be 0.55 from a review of Tropical breeds and Chud et al. (2014) in Nellore cattle who reported an estimate of 0.36.
| Trait | WT0 | CC0 | WT3m | CC3m | WT6m |
|---|---|---|---|---|---|
| WT0 | 0.86 (0.03) | 0.75 (0.05) | 0.62 (0.05) | 0.69 (0.05) | |
| CC0 | 0.64 (0.01) | 0.71 (0.07) | 0.82 (0.05) | 0.67 (0.06) | |
| WT3m | 0.53 (0.02) | 0.35 (0.02) | 0.84 (0.03) | 0.97 (0.01) | |
| CC3m | 0.42 (0.02) | 0.49 (0.02) | 0.64 (0.01) | 0.82 (0.03) | |
| WT6m | 0.46 (0.02) | 0.32 (0.02) | 0.77 (0.03) | 0.62 (0.01) |
WT0, birth weight (kg); CC0, birth coronet circumference (cm); WT3m, 3-month weight (kg); CC3m, 3-month coronet circumference (cm); WT6m, 6-month weight (kg).
Both measures of coronet circumference were strongly correlated with liveweight measured at the same time, with genetic correlations between CC0 and WT0 of 0.86 (0.03) and CC3m and WT3m of 0.84 (0.03). M. G. Jeyaruban (2019, pers. comm.) estimated a positive genetic correlation of 0.69 between the birth weight and the predicted birth weight on the basis of the coronet circumference at birth in Hereford cattle. Although the phenotypic relationship was only moderate (0.42), CC3m was estimated to have a strong genetic correlation with WT0 (0.62 (0.05)).
The strong genetic correlation between birth and weaning liveweight indicates that selection for increased weaning weight would result in a correlated increase in birth weight. Increased birth weight is generally not desirable. Therefore, it is important to collect birth weight measurements to enable the selection of animals that are born at an optimal birth weight but then grow fast to achieve the target weaning liveweights. However, birth weight is difficult to record. Jeyaruban et al. (2016) and Moore KL, Johnston DJ, Grant TP (unpubl. data) estimated positive genetic correlations between birth weight and gestation length in tropical and temperate breeds. The inclusion of gestation length into the breeding goal may also help maintain birth weight in herds utilising AI, but the use of AI in northern Australian herds is generally low. It may be possible to select animals with lower birth weights by selecting ‘curve benders’, selecting animals with low 3-month weights and high weaning weights. However, this is likely to have the undesirable effect of selecting for late-maturing animals as the growth from birth to 3 months is not considered.
Influence of fitting age
Measures that could be taken at the branding event or at another single time point (i.e. when all animals are together) are attractive because they would remove the need for daily inspection and calf catching and weighing over an entire calving period (i.e. 12+ weeks). However, it is important to note that the genetic-parameter estimates in this study were from models that included the age of the calf as a covariate. However, if the age of the animal was assumed not to be known in these data (i.e. as if the daily inspection was not undertaken), it was shown to affect both the magnitude of the genetic correlations of birth weight with the post-birth trait, as well as the heritability of the trait. For WT3m, when age was removed, the heritability reduced from 0.36 to 0.17 and the genetic correlation reduced from 0.80 to 0.62. A smaller effect was observed in CC3M when age was removed, with a reduction in heritability from 0.48 to 0.35 and the genetic correlation reduced from 0.78 to 0.62. At WT6m, removing age reduced heritability from 0.30 to 0.17, and the genetic correlation reduced from 0.67 to 0.56. Therefore, the utility of the post-birth traits as genetic predictors of birth weight was greatly reduced if age was not fitted (i.e. date of birth is not known), especially for WT3m.
Accuracies of selection for birth weight
Table 4 presents theoretical accuracies and selection response for the birth weight from various combinations of correlated traits. The single most accurate genetic predictor of WT0 was the single measure of CC0, with a 61% predicted accuracy for WT0 and with 86% of the accuracy achieved from the actual birth weight record. WT0 and CC0 require calves to be handled at birth to collect the phenotype. This removes much of the practical advantage that CC0 may have over WT0 and, with the reduced selection accuracy, suggests that CC0 is not a viable proxy for WT0. For measures taken post-birth, the accuracy of WT0 was much lower for any of the single measures (e.g. WT6m 46% accuracy) and was only slightly higher for combinations of measures (e.g. WT6m and CC3m 51% predicted birth weight accuracy). Utilising post-birth measures was predicted to achieve between 58% and 65% of the WT0 selection response and between 59% and 65% of the WT0 selection accuracy. However, with a positive genetic correlation between WT0 and post-birth weights and without applying selection pressure to decrease WT0, selection based on post-birth measures will result in increasing birth weights, which may have an undesirable impact on calving difficulties.
| Traits combination | WT0 response (kg) | Accuracy WT0 | % of WT0 accuracy |
|---|---|---|---|
| WT0 | 2.40 | 0.71 | – |
| Single measures | |||
| CC0 | 2.04 | 0.61 | 85.9 |
| WT3m | 1.40 | 0.42 | 59.2 |
| CC3m | 1.54 | 0.46 | 64.8 |
| WT6m | 1.55 | 0.46 | 64.8 |
| Post-birth measures | |||
| WT3m + CC3m | 1.61 | 0.49 | 69.0 |
| WT6m + CC3m | 1.72 | 0.51 | 71.8 |
| WT3m + WT6m | 1.59 | 0.47 | 66.2 |
| WT3m + WT6m + CC3m | 1.72 | 0.51 | 71.8 |
Conclusions
Coronet circumference measured at birth was highly heritable and had a strong genetic correlation with birth weight. Therefore, coronet circumference measured at birth could be used in the genetic evaluation of birth weight. However, there is still the requirement to handle the calf at birth, and it would need to be considered a correlated trait in the genetic evaluation. Coronet circumference measured in the branding cradle has the advantage that calves do not need to be handled at birth and could be recorded on a single day. The trait was highly heritable, but the index accuracy for predicting birth weight was no better than simply recording a 3-month or weaning liveweight. Branding or weaning weights could be used in genetic evaluation, provided the animal’s age was known, but without an actual birth weight record, the evaluation would have no capacity to identify those animals whose birth weight genetics differs from their later growth.
Acknowledgements
The authors acknowledge funding from MLA (project B.NBP.0759) and the contributions of the project collaborator institutions: AGBU, Queensland Department of Agriculture and Fisheries, Northern Territory Department of Primarily Industries and Fisheries, University of Queensland, QAAFI and ABRI. We thank the efforts of the DAF research station managers at Spyglass and Brian Pastures with their staff and the team of technicians involved in animal management and data collection at the research stations: Tracy Longhurst, Joanne Campbell, Nicholas Brazier, Kerry Goodwin, Jarud Muller, Stacey Haucke, Leanne Hardwick, Nicole Limburg, Andrew Lewis, Callum Olver, Melissah Dayman, Brad Hough, Ian Dunbar and Hannah Vicary. Thanks go to the database specialists Jim Cook and Tracy Longhurst. Finally, we acknowledge the three breed societies and their members for access to their performance and pedigree database.
References
Barwick SA, Johnston DJ, Burrow HM, Holroyd RG, Fordyce G, Wolcott ML, Sim WD, Sullivan MT (2009) Genetics of heifer performance in ‘wet’ and ‘dry’ seasons and their relationships with steer performance in two tropical beef genotypes. Animal Production Science 49, 367-382.
| Crossref | Google Scholar |
Bunter KL, Johnston DJ (2013) Genetic parameters for calf mortality and correlated cow and calf traits in tropically adapted beef breeds managed in extensive Australian production systems. Animal Production Science 54, 50-59.
| Crossref | Google Scholar |
Bunter KL, Johnston DJ, Wolcott ML, Fordyce G (2013) Factors associated with calf mortality in tropically adapted beef breeds managed in extensive Australian production systems. Animal Production Science 54, 25-36.
| Crossref | Google Scholar |
Chud TCS, Caetano SL, Buzanskas ME, Grossi DA, Guidolin DGF, Nascimento GB, Rosa JO, Lobo RB, Munari DP (2014) Genetic analysis for gestation length, birth weight, weaning weight, and accumulated productivity in Nellore beef cattle. Livestock Science 170, 16-21.
| Crossref | Google Scholar |
Davis GP (1993) Genetic parameters for tropical beef cattle in northern Australia: a review. Australian Journal of Agricultural Research 44, 179-198.
| Crossref | Google Scholar |
Graser H-U, Tier B, Johnston DJ, Barwick SA (2005) Genetic evaluation for the beef industry in Australia. Australian Journal of Experimental Agriculture 45, 913-921.
| Crossref | Google Scholar |
Hiew MWH, Megahed AA, Townsend JR, Singleton WL, Constable PD (2016) Clinical utility of calf front hoof circumference and maternal intrapelvic area in predicting dystocia in 103 late gestation Holstein-Friesian heifers and cows. Theriogenology 85, 384-395.
| Crossref | Google Scholar |
Jeyaruban MG, Johnston DJ, Tier B, Graser H-U (2016) Genetic parameters for calving difficulty using complex genetic models in five beef breeds in Australia. Animal Production Science 56(5), 927-933.
| Crossref | Google Scholar |
Johnston DJ, Grant TP, Schatz TJ, Burns BM, Fordyce G, Lyons RE (2017) The Repronomics project – enabling genetic improvement in reproduction in northern Australia. In ‘Proceedings of association for the advancement of animal breeding and genetics. Vol. 22’. pp. 385–388. (Association for the Advancement of Animal Breeding and Genetics (AAABG))
Ko JCH, Ruble MV (1990) Using maternal pelvis size and fetal hoof circumference to predict calving difficulty in beef cattle. Veterinary Medicine 85, 1030-1036.
| Google Scholar |
Parish JA, Smith T, Parish JR, Best TF, Boland HT (2009) Evaluation of four different methods of calf birth weight data collection. The Professional Animal Scientist 25(6), 716-721.
| Crossref | Google Scholar |
Prayaga KC, Henshall JM (2005) Adaptability in tropical beef cattle: genetic parameters of growth, adaptive and temperament traits in a crossbred population. Australian Journal of Experimental Agriculture 45, 971-983.
| Crossref | Google Scholar |
Tozer PR, Scollard DL, Marsh TL, Marsh TJ (2002) Recursive systems model of fetal birth weight and calving difficulty in beef heifers. Canadian Journal of Animal Science 82(1), 19-27.
| Crossref | Google Scholar |
van der Werf J (2020) MTINDEX – Microsoft Excel spread sheet for selection index calculations. Multiple Trait Selection software. University of New England. Armidale, NSW, Australia. Available at http://www-personal.une.edu.au/~jvanderw/software.htm