

Unlocking the monetary value: investigating the importance of quality information in Australian red meat chains
Yue Zhang A * , Nam Hoang A , Derek Baker A , Emilio Morales A and Garry Griffith A B
A
B
Abstract
This study assesses the monetary value of product quality information, specifically feedback from slaughter and production methods, within the Australian beef and sheep meat supply chains.
The primary objective was to investigate the value assigned by supply chain actors to product quality information, measured as willingness to pay for receiving it or willingness to accept payment for providing it. The study also aimed to explore how the value of this information varies based on information quality and quantity.
A contingent valuation approach was employed, utilising survey data from 104 producers. Logit models were used to identify the factors influencing meat producers’ willingness to accept payment and willingness to pay.
Over one-third of cattle and sheep producers expressed interest in receiving feedback from slaughter information and providing production methods information. Production methods information had the highest mean value at the premium information quality and quantity level, with values of AU$20.49/head in the beef industry and AU$10.13/head in the sheep industry. Conversely, feedback from slaughter information had the lowest mean value at the low information quality and quantity level, with values of AU$0.83/carcass in beef and AU$0.14/carcass in sheep. Farmers’ experience and education level significantly influenced their willingness to accept payment and willingness to pay for product quality information.
A significant proportion of producers within the Australian beef and sheep meat supply chains express a desire to provide or pay for product quality information. The value assigned to this information demonstrates a positive relationship with higher information quality and quantity. However, variations in expressed value of different information types, and the influence of farmer and farm characteristics, suggest the presence of chain failures that disrupt information valuation.
These findings have important implications for improving the performance of the red meat supply chains. Understanding the factors that influence the valuation of product quality information allows stakeholders to develop targeted strategies to enhance the efficiency and effectiveness of information exchange. This may involve addressing chain failures, and implementing measures to ensure consistent and accurate valuation of information. Ultimately, these improvements can contribute to enhanced decision-making processes and overall supply chain performance in the Australian beef and sheep meat industry.
Keywords: beef, carcase feedback, chain failure, contingent valuation, product quality information, sheep meat, supply chain, value of information, willingness to accept, willingness to pay.
Introduction
The Australian beef and sheep meat sectors have placed significant emphasis on conveying product quality information within their supply chains (SCs), with Meat Standards Australia (MSA) leading the way. Moreover, recent research has concentrated on leveraging technology to improve the precision and consistency of the measurement of beef and lamb carcass traits (e.g. Pitchford et al. 2020; Mazoudier et al. 2021), generating interest in enhancing the quality and quantity of this information. Although downstream SC actors, such as wholesalers and retailers, acknowledge the advantages of product quality information, the upstream SC, including breeders and producers, has not experienced a proportional increase in prices, creating uncertainty regarding the true value of the information to livestock producers. This issue is linked to incentives and may hinder industry-wide initiatives and investments aimed at enhancing SC productivity and value addition. Such inefficiencies could, over time, contribute to chain failure, which arises when a value chain fails to maximise whole chain surplus (Griffith et al. 2015).
Sharing information on product quality has the potential to benefit all stages of the SC by improving management and decision-making (Zhang et al. 2020), adding value to products, and increasing consumers’ willingness to pay (WTP) (Grunert et al. 2018). The lack of clear price signals and inconsistent market reporting have been identified as potential obstacles to upstream producers collecting and sharing this information (Australian Competition and Consumer Commission 2018). A key step in identifying and addressing chain failure and related problems is to quantify the value of information about product quality, and the incentives and impacts associated with farmers’ collection, provision and receipt of information. For livestock producers, product quality information flows in both directions, as it is shared in the SC: (1) provision of information to downstream SC participants when selling products (‘sharing out’), and (2) receipt of feedback information from downstream SC participants (‘sharing in’). Quality and quantity (IQQ) are two aspects of information that can influence upstream producers’ perceptions of the value of information. Information quality encompasses the accuracy, reliability, completeness and relevance of information within the red meat SC. This may include third-party certification, which ensures data credibility and authenticity. Information quantity refers to the volume of available data within the chain, exemplified by herd/mob-based data, which adds detail and contributes to the overall information volume. However, it has received little research attention in the context of red meat industries. In addition, how sociodemographic and economic factors (e.g. farmers’ age and education level, farm size) influence farmers’ valuation of product quality information is not clear either. The current study aimed to begin filling these gaps, using contingent valuation (CV) to measure the monetary value of information about product quality at two levels of IQQ in beef and sheep meat SCs.
Knowledge of the value of information about product quality for livestock producers provides policy makers and industry bodies with decision support information across a range of topics, including the design of SC- and industry-level information systems, investment in information technology, vertical SC integration, and price incentive mechanisms for livestock and meat products. The identified factors that influence producers’ decisions on sharing information about product quality are central to incentives in the SCs. An empirical contribution of this study is its comparison of the different values of information ‘sharing in’ and ‘sharing out’ at the producer level. This study also adds to the empirical applications of CV in informing policy and governance.
The remainder of this paper is structured as follows. It begins with background information on product quality information in the upstream red meat SCs, along with an explanation of the CV method employed to elicit producers’ willingness to accept (WTA) and WTP for information. Additionally, a conceptual framework for analysing WTA and WTP for information is presented. Subsequently, the paper outlines the data and methodology used in the empirical analysis. The results of the anlaysis are then presented, concluding with a discussion of the findings.
Valuing product quality information
In food SC studies, CV has been widely used to estimate the value of product quality information for consumers (e.g. Gao and Schroeder 2009; Olynk et al. 2010a), but also to investigate producers’ profit maximisation tasks regarding uptake of production inputs (e.g. Horna et al. 2007; Bennett and Balcombe 2012), agricultural extension services (e.g. Bett et al. 2009; Ulimwengu and Sanyal 2011), and technology and other innovations (Hudson and Hite 2003). As information about product quality is associated with specific production or process actors, sharing this information can be considered as a method to innovate in livestock production. More generally, IQQ improvement generates benefits to farmers and others along the SC. However, there is a knowledge gap in the assembly of a taxonomy of information that signals product quality between SC actors. The current study addresses this gap by focusing on two types of information: MSA feedback on carcasses (FB) and information about production methods (PM) for cattle and sheep, both of which are voluntary in Australia.
Potential benefits and costs of sharing product quality information
Zapata and Carpio (2014) demonstrated that a producer’s WTP for a new production input is equal to the perceived difference between anticipated profit levels with and without the change: in economic terms, a net marginal benefit. Accordingly, Olynk et al. (2010a) suggested that farmers can provide information about production process attributes, to maximise profits. Farmers can pursue a price premium through provision of extra information to signal the quality of sires, animals and the meat produced, which is enabled by a merit- or grid-based pricing mechanism (Johnson and Ward 2006). IQQ improvement is an extension of this principle.
Information in the FB reports in the beef industry contain a number of eating quality-related factors, including hump height, pH, fat colour, meat colour and MSA marbling score (Polkinghorne et al. 2008), and can be received and reviewed by MSA registered cattle suppliers through an online feedback system (known as myMSA) in Australia. Although the benefits of FB information and associated IQQ improvement do not directly increase revenue, producers can use this information to improve their cattle’s compliance and eating quality performance (Bowler 2014; Meat and Livestock Australia 2021), ultimately benefitting processors by improving processing efficiency and quality consistency (Goers and Craig 2008). Participants incur no extra costs beyond MSA membership fees, but utilising this information for decision-making remains a challenge due to variations in farmers’ knowledge, and capacity to utilise and convert this information to inputs for livestock management and production. This process necessitates that farmers diligently record pertinent on-farm data, and establish a meaningful connection between the FB information received and their recorded information. As MSA sheepmeat standards are still at an early stage of development, this is included in the current study as hypothetical information.
The current paper defines PM as information that encompasses the particular methods and strategies utilised in the rearing and management of cattle and sheep for meat production. This information encompasses various facets, such as geographic origin, health and veterinary care, and feeding regimens, all of which contribute to the potential enhancement of value through product differentiation. Consumers’ WTP for this information incentivises producers to provide it as a competitive tool in product marketing and market access (Verbeke and Ward 2006; Napolitano et al. 2010). However, providing PM information can come with costs, such as audit fees, skilled labour and compliance costs. For value delivery, PM information must be consistently perceived, and processed along the SC, and used by end consumers.
Basis of producers’ WTA and WTP
Based on Lusk and Hudson (2004), a producer can choose the optimal level of information inputs, i; facing vectors of input prices, w; and output prices, p. The indirect restricted profit function is described as: π(p, w, i). Assuming that the producer initially faces an information inflow (information receiving) level, i0, and then information I is introduced, the new inflow information level is denoted by i0 + I. Given the restricted profit function, a profit maximiser will pay for the new information I, if:
The perceived profit derived from receiving new information I is greater than or equal to the amount foregone. Otherwise, that producer will not be interested in receiving the information. The WTP for the new information I or for the change is then:
The payment received for providing a piece of information can be treated as the compensation for the cost generated by associated production changes (such as compliance); information technology adoption; costs. such as certification; and labour inputs. Although it should be noted that producers may be compelled to provide information (Olynk et al. 2010b), only the case where information is shared voluntarily is addressed.
Denoting q0 as the initial outflow of information (i.e. information provision), and q0 + I as the new outflow, the producer will find it acceptable to provide the new information I, if:
which means that the compensation accepted in exchange for provision of information I is greater than or equal to the costs of provision. The WTA to provide the new information I or for the change is then:
Factors affecting farmer WTA and WTP
Storer (2006) proposed that food producers could enhance the value of their products by improving quality, yield and grades through better utilisation and sharing of information. Sharing information vertically in the red meat SC is an innovative agricultural practice (Griffith et al. 2010). However, the attitudes of farmers towards such innovations may be influenced by their individual characteristics, and research on the subject has produced inconsistent results. The impact of these factors on farmers’ perceived value of product quality information is not well understood.
Previous studies have found mixed results regarding the influence of farmers’ age and education level on their WTP for innovative agricultural practices, with some studies (e.g. D’Souza et al. 1993; Kim et al. 2008) showing a negative association between age and WTP, and a positive association between education level and WTP. Women have been found to have lower levels of education and knowledge about agricultural production than men in some cases (Doss and Morris 2000), but they may have more positive attitudes towards collaboration and conservation technology adoption (Druschke and Secchi 2014; Hay and Pearce 2014). Farmers’ experience in agricultural production may not have a positive impact on their use or provision of novel agricultural information (Rehman et al. 2013; Carrer et al. 2017), as more experienced farmers may make decisions based on their experience (Magne et al. 2010) and trusted sources of information. Farm size is often related to farm financial status (e.g. debt level, income; Kallas et al. 2010; Ainembabazi et al. 2017), number of employees (Kallas et al. 2010) and property size (e.g. in ha; Finger and Lehmann 2012). It has been hypothesised to influence farmers’ willingness to invest in new technologies (Knowler and Bradshaw 2007), but results have been mixed (as illustrated by Adrian et al. 2005; Finger and Lehmann 2012). Third-party certification programs may influence producers’ WTA and WTP for product quality information, as these programs facilitate information sharing between SC members and are associated with increased concern for product quality (King et al. 2005; Prado and Woodside 2015).
A conceptual framework for eliciting producers’ WTA and WTP for information
A conceptual framework is developed to elicit livestock producers’ WTA and WTP for information (Fig. 1), especially cattle and sheep producers’ WTA for providing PM information and WTP for receiving FB information. The framework is based on previous research exploring the value and benefits of information sharing in the SC (i.e. Zhang et al. 2020). The framework considers whether farmers would provide or pay for information, and the valuation of information at two levels of IQQ.
Conceptual framework for eliciting producers’ willingness to accept or willingness to pay for information. Source: Developed by the author based on Zhang et al. (2020). WTA, willingness to provide information; WTP, willingness to pay for information; IQQ, information quality and quantity; $WTA/WTP, WTA/WTP in dollar amount. The factors affecting producers’ WTA/WTP for information at low and premium IQQ levels, shown as grey arrows, are not tested in this paper.  Logical flow of eliciting producers’ WTA/WTP for information.
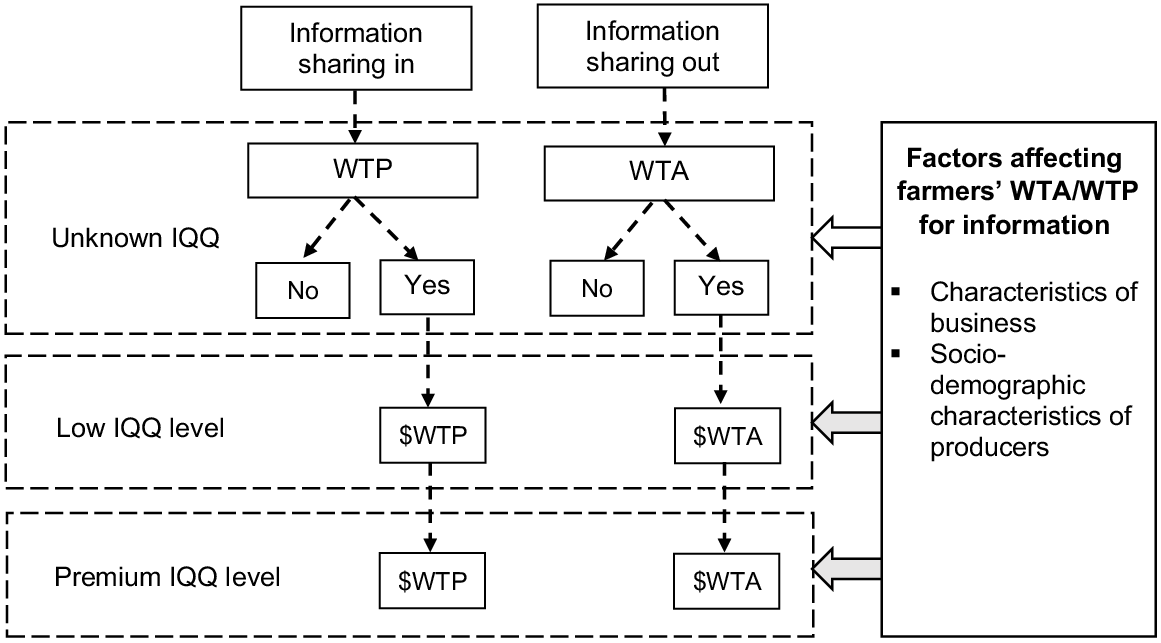
The framework for measuring the value of information in the upstream SC considers both information provision and receipt, and uses the CV approach to elicit producers’ WTA or WTP for information. Where IQQ is unknown, producers’ willingness to provide or pay for information, or share it (onwards and outwards), is identified. WTA or WTP in dollar amounts are elicited from those producers who were willing to provide or willing to pay for that information. This is considered at two levels of IQQ: (1) low, and (2) premium levels to obtain the WTA or WTP in dollar amount at each level of IQQ separately.
To prevent ‘protest responses,’ where respondents simply answer ‘no’ to the initial question about their WTA or WTP, a preliminary question is posed. Those who respond negatively to this initial inquiry are considered as not interested in the information, and no further questions regarding monetary values are asked. This approach serves the purpose of avoiding an excessively high rate of zero responses, a common issue in CV studies (Jorgensen et al. 1999; Szabó 2011), although it may reduce the sample size and constrain available methodological options.
Characteristics of producers and farms are included as factors moderating their WTA or WTP for information. This framework is not limited to cattle and sheep producers, and can be applied to other stages of the SC to compare the values of information and diagnose potential chain failures due to asymmetry in the valuation of information.
Methods and data
Data collection and survey design
The study collected data from two online surveys of Australian beef and sheep meat industry actors from November 2017 to February 2018, and from May to October 2018. Survey advertisements were distributed to cattle and sheep producers in Australia via various channels, including livestock producer groups, certification programs, cattle and sheep exhibitions, and university social media. The current study used a subset of the data about livestock producers’ WTA and/or WTP for information, and the self-reported characteristics of the survey respondents. Data extracted from a total of 104 valid respondents was used in this study: 50 from the first survey, and 54 from the second. There were several respondents involved in both beef and sheep industries (n = 26). These were treated as members of each group, as the questionnaire addressed activities in separate industry groups. The resulting number of cattle and sheep producers were 91 and 39, respectively.
A two-stage CV survey questionnaire was designed following the conceptual framework presented in Fig. 1. In the study, respondents were asked if they were willing to provide or pay for nominated pieces of information. Those who answered ‘yes’ were then asked their WTA or WTP for the information at low and premium IQQ levels. The IQQ indicators for FB information were consistent between MSA-licenced processors in Australia, making them constructive for the study. The information quantity was measured based on the basis of measurement method; that is, herd/mob or individual animal based (Guy et al. 2018). For both the FB and PM information, individual animal-based measurements were employed to represent a high quantity of information, whereas herd/mob-based measurements signified a lower quantity of information. Various information quality measures were developed for different types of information. The quality of FB was identified using mechanical measurement or objective carcass measurement technologies, such as dual-energy X-ray absorptiometry (Calnan et al. 2021), and the certification status indicated the quality of PM.
Examples of survey questions are presented in Appendix I. The primary distinction between the two surveys lies in the format of the questions used to elicit WTA and WTP responses (Q2 in Appendix I). In the first survey, we employed an open-ended question format to prevent starting point bias, as suggested by Balistreri et al. (2001). However, this format led to a high non-response rate (Frew et al. 2003), and a relatively large variance in WTA and WTP. In response to these challenges, we conducted a second survey using a five-point payment card to improve the design of payment intervals. The numeric WTA and WTP data from the first survey were converted into the interval format used in the second survey to create a unified dataset. Previous studies have shown that open-ended and payment scale approaches are equally valid in eliciting WTP (Frew et al. 2003; Grutters et al. 2009).
Description of survey respondents
The characteristics of survey respondents and their businesses in each sample group are presented in Table 1. These factors are important in determining farmers’ WTA and WTP for information, as highlighted in the study’s conceptual framework (Fig. 1). The majority of respondents were men, and their average age ranged from 53 to 55 years, with the youngest being aged 22 years and the oldest being aged 81 years. This closely aligns with the gender composition (77% men) and the average age (57 years) of Australian farmers, as reported by ABS (2019). The survey participants had an average tenure of about 18 years in senior management roles within agribusinesses or farms, spanning from 0 to 61 years. In contrast, the farm demographic report from the ABS (2019) indicated an average overall involvement in farming of 37 years.
| Variable | Definition | Format | Cattle producers (n = 91) | Sheep producers (n = 39) | |||||||
|---|---|---|---|---|---|---|---|---|---|---|---|
| Frequency | Percentage (%) | Mean | s.d. | Frequency | Percentage (%) | Mean | s.d. | ||||
| GEN | Gender of respondents | Male = 0 | 70 | 76.9 | 0.2 | 0.4 | 22 | 56.4 | 0.4 | 0.5 | |
| Female = 1 | 21 | 23.1 | 17 | 43.6 | |||||||
| AGE | Age of respondents | Continuous variable (years old) | N/A | N/A | 54.8 | 13.0 | N/A | N/A | 53.1 | 12.9 | |
| EXP | Number of years as a senior manager of an agribusiness or a farm | Continuous variable (years) | N/A | N/A | 17.6 | 12.7 | N/A | N/A | 18.7 | 12.7 | |
| EDU_UNI | University degree | No university degree = 0 | 40 | 43.9 | 0.5 | 0.5 | 11 | 41.0 | 0.6 | 0.5 | |
| University degree = 1 | 51 | 56.0 | 28 | 59.0 | |||||||
| EDU_AG | Education in agriculture (e.g. TAFE, VET, university degree in agriculture or related filed) | No formal education in agriculture = 0 | 30 | 33.0 | 0.7 | 0.5 | 9 | 23.1 | 0.7 | 0.5 | |
| Formal education in agriculture = 1 | 61 | 67.0 | 30 | 76.9 | |||||||
| FZ_EMP | Number of full-time employees | Continuous variable | N/A | N/A | 2.4 | 3.5 | N/A | N/A | 1.8 | 2.1 | |
| FZ_GR | Gross farm income (AU$) | <$100 000 = 1 | 15 | 16.5 | 2.6 | 1.0 | 7 | 18.0 | 2.4 | 1.0 | |
| $100 000–$499 000 = 2 | 33 | 36.2 | 19 | 48.7 | |||||||
| $500 000–$999 000 = 3 | 20 | 22.0 | 5 | 12.8 | |||||||
| >$1 000 000 = 4 | 23 | 25.3 | 8 | 20.5 | |||||||
| CER | Membership of third-party certification programs | No = 0 | 36 | 39.6 | 0.6 | 0.5 | 16 | 41.0 | 0.6 | 0.5 | |
| Yes = 1 | 55 | 60.5 | 23 | 59.0 | |||||||
The majority of respondents received formal education in agriculture, and approximately half of the respondents had a university degree. The surveys were conducted online and advertised through email, which implies that the respondents were expected to have access to internet-enabled devices, such as computers or mobile phones. It is likely that respondents with a university degree or formal education were more likely to participate in the survey. The average number of full-time employees employed on respondents’ farms was approximately 2.3. In addition, the majority of the sample consisted of farms with a gross revenue ranging from AU$100 000 to AU$499 000, suggesting that most surveyed farms were small or medium sized. Approximately 60% of cattle and sheep producers in the sample indicated that they were a member of at least one third-party certification program, but the distribution channels of the survey may lead to a high proportion of positive responses.
Most survey respondents are likely part of a specialised group of producers with significant experience in farm management and formal education. They may possess the resources, including a workforce, to dedicate to information collection and processing. Additionally, they often engage in certification programs and directly sell to meat processors. Although this subgroup has the potential to play a leading role in advancing the collection and utilisation of high-quality information within the industry, it is important to acknowledge that this may result in relatively high WTP or WTA values. Furthermore, it is worth noting that the sample size in the sheep industry is relatively small, potentially influencing the WTP and WTA results. However, given the exploratory nature of the current study, it has been decided to retain these data for further analysis.
Method
A two-step analysis was conducted to estimate the monetary value of information on product quality (FB and PM) at two IQQ levels and determine the factors that influence commercial livestock producers’ WTA or WTP for this information.
The mean and median WTA and WTP for each type of information were estimated using a non-parametric approach following Haab and McConnell (2002, p. 71–72) and Carson et al. (1994). The lower bound for mean WTA and WTP was obtained by multiplying the probability of each value interval by the lower limit of that interval, assuming that when a respondent selects a payment scale interval, their WTA or WTP is not less than the lower-bound of that scale. The t-statistic was used to determine the statistical significance of differences between the values of information assigned to two levels of IQQ.
The initial survey question on WTA/WTP was a binary choice. To investigate the factors influencing this decision, such as the characteristics of the farmer and farm, binomial logistic regression following the method of Burton et al. (1999) was used. The probit model is another approach used to examine the relationship between binary dependent variables and explanatory variables, but the logistic model was chosen due to its simplicity and interpretability. This approach has been widely used in the literature to analyse the factors affecting farmers’ WTP decisions on technology, services or innovation (e.g. Asrat et al. 2004; Mariano et al. 2012).
The binomial logistic regression distribution is expressed (Brooks 2014, p. 562) as:
where Pj denotes the probability that the jth farmer is willing to provide or willing to pay for a piece of information (Yj = 1). The binary response variable, Yj, takes the value 1 if the jth farmer is willing, and 0 otherwise. It is assumed that the values taken by Yj are determined by a latent variable, Yj*, given by
where βk is a vector of coefficients; εj is the error term; and xk is a vector of observed covariates representing the characteristics of jth farmer and farm; and Yj* is the unobserved binary variable that corresponds to the observed dichotomous variable for the jth farmer, Yj. The relationship between Yj and Yj* is expressed as:
so that Eqn 5 is then transformed as:
To maximise the utilisation of the available data, the data from sheep meat and beef industries was merged, and ‘cattle producers’ (denoted by ‘BEEF’) added as a dummy variable in the logit model to maintain the distinction between the two industries. As the development of information measurement in the Australian beef industry (e.g. MSA) is more advanced than that for sheep meat, cattle producers were expected to have a better understanding of the benefits and costs of information sharing. The other explanatory variables and their measures are listed in Table 1. Two binominal logit models are presented, differentiated by type of information:
The parameter estimates were used to generate average partial effects (APEs; also known as average marginal effects (AMEs)) to estimate the expected partial effect for each identified variable by averaging across the marginal effects of jth farmer’s observed values on the explanatory variables. APE is expressed as (Greene 2018, p. 735):
The authors chose APEs over partial effect at the average, as the mean values of explanatory variables (covariates) computed by partial effect at the averag may not exist in the dataset or in reality (Wooldridge 2015, p. 600). The differences between partial effect at the averag and APEs are discussed in Wooldridge (2015, p. 600) and Greene (2018, p.735).
Bootstrapping in the binominal models and in calculating robust standard errors for generation of APEs was applied. This approach addresses sample variation in cases such as these, where the sample cannot cover the entire population or is limited to a certain point in time. The statistical analyses were conducted using the Stata 15 software package.
Empirical findings
Descriptive statistics
The frequency of respondents that are willing to provide and willing to pay for each type of information, and the associated distributions of monetary WTA and WTP at the low and premium IQQ levels are presented in Tables 2 and 3. The 0 subscript for each WTA or WTP denotes the question on willingness, and the 1 and 2 subscripts denote the IQQ levels of ‘low’ and ‘premium’ respectively.
| WTP | Descriptions | Format | Frequency | Percentage (%) | Mean | s.d. | |
|---|---|---|---|---|---|---|---|
| Beef industry | |||||||
| WTP(FB)_0 (n = 91) | Whether or not a cattle producer was willing to pay for FB information. | No = 0 | 58 | 63.7 | 0.4 | 0.5 | |
| Yes = 1 | 33 | 36.3 | |||||
| WTP(FB)_1 (n = 33) | Maximum amount that a cattle producer would pay for FB information if it was measured by mechanical measurement on the basis of herd/mob (AU$). | $0/carcass = 1 | 17 | 51.5 | 1.9 | 1.1 | |
| $0.1–$1/carcass = 2 | 7 | 21.2 | |||||
| $1.1–$5/carcass = 3 | 6 | 18.2 | |||||
| $5.1–$10/carcass = 4 | 2 | 6.1 | |||||
| Over $10/carcass = 5 | 1 | 3.0 | |||||
| WTP(FB)_2 (n = 33) | Maximum amount that a cattle producer would pay for FB information if it was measured by objective carcass measurement technologies on the basis of individual carcass (AU$). | $0/carcass = 1 | 5 | 15.2 | 3.0 | 1.4 | |
| $0.1–$1/carcass = 2 | 8 | 24.2 | |||||
| $1.1–$5/carcass = 3 | 7 | 21.2 | |||||
| $5.1–$10/carcass = 4 | 7 | 21.2 | |||||
| Over $10/carcass = 5 | 6 | 18.2 | |||||
| Sheep meat industry | |||||||
| WTP(FB) _0 (n = 39) | Whether or not a sheep producer was willing to pay for FB information. | No = 0 | 26 | 66.7 | 0.3 | 0.5 | |
| Yes = 1 | 13 | 33.3 | |||||
| WTP(FB)_1 (n = 13) | Maximum amount that a sheep producer would pay for FB information if it was measured by mechanical measurement on the basis of herd/mob (AU$). | $0/carcass = 1 | 5 | 38.5 | 1.7 | 0.6 | |
| $0.1–$1/carcass = 2 | 7 | 53.9 | |||||
| $1.1–$2/carcass = 3 | 1 | 7.7 | |||||
| $2.1–$5/carcass = 4 | 0 | 0.0 | |||||
| Over $5/carcass = 5 | 0 | 0.0 | |||||
| WTP(FB)_2 (n = 13) | Maximum amount that a sheep producer would pay for FB information if it was measured by objective carcass measurement technologies on the basis of individual carcass (AU$). | $0/carcass = 1 | 0 | 0.0 | 2.6 | 0.8 | |
| $0.1–$1/carcass = 2 | 7 | 53.9 | |||||
| $1.1–$2/carcass = 3 | 4 | 30.8 | |||||
| $2.1–$5/carcass = 4 | 2 | 15.4 | |||||
| Over $5/carcass = 5 | 0 | 0.0 | |||||
| WTA | Descriptions | Format | Frequency | Percentage (%) | Mean | s.d. | |
|---|---|---|---|---|---|---|---|
| Beef industry | |||||||
| WTA(PM)_0 (n = 91) | Whether or not a cattle producer was willing to provide PM information. | No = 0 | 46 | 50.6 | 0.5 | 0.5 | |
| Yes = 1 | 45 | 49.4 | |||||
| WTA(PM)_1 (n = 45) | Minimum amount that a cattle producer would accept to provide PM information if it was uncertified and was herd/mob based (AU$). | $0/head = 1 | 19 | 42.2 | 1.9 | 1.0 | |
| $1–$10/head = 2 | 19 | 42.2 | |||||
| $11–$20/head = 3 | 3 | 6.7 | |||||
| $21–$50/head = 4 | 2 | 4.4 | |||||
| Over $50/head = 5 | 2 | 4.4 | |||||
| WTA(PM)_2 (n = 45) | Minimum amount that a cattle producer would accept to provide PM information if it was certified and was individual animal based (AU$). | $0/head = 1 | 0 | 0.0 | 3.4 | 1.3 | |
| $1–$10/head = 2 | 17 | 37.8 | |||||
| $11–$20/head = 3 | 6 | 13.3 | |||||
| $21–$50/head = 4 | 9 | 20.0 | |||||
| Over $50/head = 5 | 13 | 28.9 | |||||
| Sheep meat industry | |||||||
| WTA(PM)_0 (n = 39) | Whether or not a sheep producer was willing to provide PM information. | No = 1 | 25 | 64.1 | 0.4 | 0.5 | |
| Yes = 0 | 14 | 35.9 | |||||
| WTA(PM)_1 (n = 14) | Minimum amount that a sheep producer would accept to provide PM information if it was uncertified and was herd/mob based (AU$). | $0/head = 1 | 6 | 42.9 | 1.9 | 1.1 | |
| $0–$5/head = 2 | 5 | 35.7 | |||||
| $6–$10/head = 3 | 1 | 7.1 | |||||
| $11–$20/head = 4 | 2 | 14.3 | |||||
| Over $20/head = 5 | 0 | 0.0 | |||||
| WTA(PM)_2 (n = 14) | Minimum amount that a sheep producer would accept to provide PM information if it was certified and was individual animal based (AU$). | $0/head = 1 | 2 | 14.3 | 3.4 | 1.6 | |
| $0–$5/head = 2 | 3 | 21.4 | |||||
| $6–$10/head = 3 | 1 | 7.1 | |||||
| $11–$20/head = 4 | 3 | 21.4 | |||||
| Over $20/head = 5 | 5 | 35.7 | |||||
One notable result from Table 2 is that approximately one-third of the cattle producers and sheep producers expressed interest in receiving FB information. This finding is unexpected, given that the MSA system has been available for the Australian beef industry since 1998 and research has demonstrated the benefits of implementing MSA, including consumers’ WTP and improving producers’ competitive advantage (e.g. Griffith and Thompson 2012; Morales et al. 2013). However, these findings may be indicative of a strong demand among sheep producers for information related to eating quality and the development of associated information systems to aid in their decision-making processes, given that implementation procedures for MSA for sheep carcasses remain at an early stage.
For the provision of PM information (Table 3), a higher proportion of producers expressed interest, with 49.4% of cattle producers and 35.9% of sheep producers willing to provide it. This is not surprising, as farmers providing PM information are usually seeking a price premium. The difference in results between species is expected due to varying levels of benefits available to sheep and cattle producers. As previously noted, studies by Zhang et al. (2018, Scenario 11) and Mounter et al. (2019, Scenario 5) found that an increase in domestic consumers’ WTP would generate a larger share of total surplus value for cattle farmers compared with sheep farmers.
At the low IQQ level (denoted by subscript 1 in Tables 2 and 3), the majority of respondents valued the first two payment ranges for all information categories. At the premium IQQ level (denoted by subscript 2 in Tables 2 and 3), the majority of respondents assigned value to the studied information, except for a few sheep producer respondents who expressed that they would provide PM information without any payment. This may be because their purposes of sharing this information were to receive non-monetary benefits, such as customer retention or improving or maintaining a long-term relationship with buyers. Another potential explanation is that the improvement of IQQ was not expected to generate substantial costs for them for that type of information. Another finding is that the variance of respondents’ valuation was higher at the premium IQQ level compared with the low IQQ level.
Values for FB information in the beef industry were more evenly distributed at the higher level of IQQ than the lower (see Table 2). Although the majority of sheep producers who were willing to pay for FB information valued it at AU$0.1–$1/carcass at both IQQ levels, a substantial number of respondents still selected higher values for the high IQQ than the low IQQ level. For PM information, the first two payment intervals comprised one-third of respondents willing to provide PM information at the IQQ level, whereas another one-third were in the highest payment interval for both beef and sheep meat industries.
Estimation of mean and median WTA and WTP
Table 4 presents the mean and median values of WTA and WTP for farmers at two IQQ levels. For the beef industry, it is observed that the highest mean value was associated with PM information at the premium IQQ level, amounting to AU$20.49 per head. In contrast, the lowest mean value was found for FB information at the low IQQ level, totalling AU$0.83 per carcass. Similarly, in the sheep meat industry, PM information at the premium IQQ level exhibited the highest mean value of AU$10.13 per head, whereas the lowest mean value was recorded for FB information at the low IQQ level, totalling AU$0.14 per carcass.
| WTA/WTP | Median (AU$) | Lower bound estimate for the mean (AU$) | t-statistics | |
|---|---|---|---|---|
| Beef industry | ||||
| WTP (FB)_1 | $0/carcass | $0.83/carcass | −5.00*** | |
| WTP (FB)_2 | $1.1–$5/carcass | $3.16/carcass | ||
| WTA (PM)_1 | $1–$10/head | $4.28/head | −8.72*** | |
| WTA (PM)_2 | $11–$20/head | $20.49/head | ||
| Sheep meat industry | ||||
| WTP (FB)_1 | $0.1–$1/carcass | $0.14/carcass | −5.20*** | |
| WTP (FB)_2 | $0.1–$1/carcass | $0.72/carcass | ||
| WTA (PM)_1 | $1–$5/head | $2.36/head | −4.17*** | |
| WTA (PM)_2 | $11–$20/head | $10.13/head | ||
Note: ***Significance at 1%.
An interesting result from comparing the value of information at two levels of IQQ is that the median and mean values of information were higher at the premium IQQ level than at the low IQQ level, for all types of information. This difference was statistically significant, as indicated by the t-statistics results, and highlights the potential for value addition due to higher levels of IQQ.
Logit model results
The study estimated two logit models to explore the determinants of farmers’ WTP for FB information and willingness to provide PM information. The results of estimated coefficients and APE analyses, followed by their bootstrapped standard errors (s.e.s), are presented in Tables 5 and 6. All models delivered a good statistical fit, as indicated by likelihood-ratio Chi-squared (P < 0.01) and pseudo R2. The models provided different results, and with each discussed separately.
| Variable | Coefficient | Bootstrap s.e. | APE | s.e. | |
|---|---|---|---|---|---|
| Intercept | −4.308*** | 1.617 | |||
| GEN | 1.102** | 0.474 | 0.201** | 0.083 | |
| AGE | 0.037 | 0.024 | 0.007 | 0.004 | |
| EXP | −0.067** | 0.030 | −0.012** | 0.005 | |
| EDU_UNI | 0.147 | 0.475 | 0.027 | 0.087 | |
| EDU_AG | 1.589** | 0.717 | 0.290** | 0.114 | |
| FZ_EMP | −0.019 | 0.072 | −0.004 | 0.013 | |
| FZ_GR | 0.517** | 0.263 | 0.094** | 0.047 | |
| BEEF | 0.238 | 0.527 | 0.044 | 0.095 | |
| CER | −0.326 | 0.449 | −0.060 | 0.083 | |
| Log-likelihood | −70.523 | ||||
| Prob > Chi-squared | 0.000 | ||||
| Pseudo R2 | 0.165 |
Note: **Significance at 5%; ***significance at 1%.
| Variable | Coefficient | Bootstrap s.e. | APE | s.e. | |
|---|---|---|---|---|---|
| Intercept | −2.601 | 1.530 | |||
| GEN | 0.339 | 0.580 | 0.065 | 0.111 | |
| AGE | −0.021 | 0.028 | −0.004 | 0.005 | |
| EXP | 0.051*** | 0.019 | 0.010*** | 0.003 | |
| EDU_UNI | 1.553*** | 0.526 | 0.300*** | 0.095 | |
| EDU_AG | 0.810 | 0.597 | 0.156 | 0.110 | |
| FZ_EMP | 0.043 | 0.175 | 0.008 | 0.033 | |
| FZ_GR | 0.201 | 0.253 | 0.039 | 0.049 | |
| BEEF | 0.874* | 0.507 | 0.169* | 0.096 | |
| CER | −0.325 | 0.431 | −0.063 | 0.082 | |
| Log-likelihood | −73.908 | ||||
| Prob > Chi-squared | 0.000 | ||||
| Pseudo R2 | 0.175 |
Note: **Significance at 5%; ***significance at 1%.
The factors influencing farmers’ interest in receiving FB information included gender (GEN), experience (EXP), formal education in agriculture (EDU_AG) and gross farm income (FZ_GR), all of which were statistically significant at the 5% level. The corresponding APE results showed that a marginal reduction in farmers’ experience in farming was associated with a 1.2% increase in the likelihood of being willing to pay for FB information, whereas formal education in agriculture was associated with a 29% higher probability of being willing to pay. The effect of farm size was positive and significant, indicating that an increase in farms’ gross income resulted in a 9.4% increase in the likelihood of being willing to pay for FB information.
The logit model results in Table 6 indicated that experience (EXP) had a positive and highly significant impact on farmers’ willingness to share PM information. This is in contrast to the model for farmers’ WTP for FB information. Farmers with more experience in farming are more likely to be familiar with data collection procedures and quality management practices on their farms, enabling them to process raw data into information and subsequently provide it. University qualifications (EDU_UNI) were positive and highly significant, whereas EDU_AG was not significant. This may be due to some respondents having a university degree in subjects unrelated to agriculture, and those with a university degree may have a better understanding of the value addition processes involved in providing PM information, making them more willing to share information to improve financial performance. Farm size (FZ_EMP and FZ_GR) was not a significant factor in the provision of PM information. However, small and medium-sized farms in the sample were more likely to depend on off-farm income than those with larger farms, which may limit their engagement in activities, such as data collection and provision of PM information. Respondents involved in cattle production were more willing to provide PM information than those in the sheep meat industry, possibly due to the more advanced information measurement development in the beef industry and stronger quality-related price signals in beef markets.
Conclusions
In this study, CV methods were used to investigate the value of SC information related to product quality in the Australian beef and sheep meat SCs. Data were collected from 104 livestock producers through online surveys to determine their WTA and WTP for product quality information (specifically, FB and PM) at two levels of IQQ. To the authors’ knowledge, this is the first study assessing the value of different types of product quality information at the producer level in the beef and sheep meat SCs, despite significant investment in the measurement, analysis and incentivisation of meat quality information in Australia.
More than one-third of producers were willing to provide information and/or WTP for information about the two product quality variables examined in this study. The findings aligned with the literature and suggest that gender, experience and education of farmers, as well as farm size, significantly impact producers’ WTP for FB information. Meanwhile, experience and education of farmers, along with the industry group, are important factors for producers’ willingness to provide PM information. The results suggest that industry-wide programs related to product quality information should consider the heterogeneity in the characteristics of farms and farmers, and separate the cases of information provision and receipt. It is important to note that exogenous factors, such as climate change or input price changes, may also affect WTA and WTP. As information about product quality reduces risk associated with production, farmers’ desires for this information are expected to increase with increased perceived risk.
This research included IQQ as a variable moderating producers’ WTA and WTP. It was found that producers’ WTA and WTP for information are low for poor IQQ, but consistently higher for higher IQQ. Valuations are evenly distributed across intervals for higher IQQ. This underscores the noteworthy endorsement for enhanced quality feedback, particularly through objective quality measurement. This approach has the capacity to enhance the acquisition and dissemination of information, leading to heightened efficiency and increased profitability within SCs. To optimise the utilisation of product quality information, particularly within resource-constrained farming environments, establishing on-farm information-driven decision-making systems becomes critical. These systems aim to capture, analyse and leverage information either generated on the farm (e.g. PM information) or received from other SC actors (e.g. FB information). Additionally, enhancing producers’ knowledge and capacity is crucial. Educational programs can play a pivotal role in empowering farmers to appreciate the value of information in their decision-making processes, and equip them with the necessary skills to collect, process and interpret data effectively. Collaboration with data scientists and consultants can prove instrumental in facilitating this learning process. Furthermore, it is essential to re-evaluate and modify existing incentives to more accurately reflect the true worth of information. Industry associations or government entities can take proactive measures, such as providing subsidies or tax reductions for information providers, or even considering alterations to organisational structures within the SC to align incentives with information-sharing goals.
The study’s conceptual framework can diagnose potential chain failure caused by asymmetric perception of the value of information, and can be used to elicit different SC actors’ WTP or WTA for the same information. Specifically, if the value placed on a piece of information by the provider is higher than that placed on it by the receiver of the information, there is potential chain failure – a vertical manifestation of market failure – which results in under-provision of information about product quality and an overall reduction in SC surplus. For instance, it can be used to compare meat producers’ WTA with retailers’ WTP for specific information, especially when that information has the potential to enhance the value of the final meat products.
Low survey response rates are related to the required nature of survey questions, and the limited survey response means that the study must be regarded as exploratory rather than definitive, particularly regarding the data and results within the sheep meat industry. Nonetheless, the methodological development and results produced provide significant research contributions to both industry and scholars, and the robustness of the results provides an excellent basis for further advances in understanding the value of product quality information in Australian red meat SCs. Additionally, although CV was chosen for its efficacy in assessing the monetary value of information, it is vital to acknowledge its limitations, notably the potential for respondents’ hypothetical bias and the subjectivity inherent in their valuation responses, which must be considered when utilising the results.
To further advance the understanding of the value of product quality information in Australian red meat SCs, three extensions to this research are recommended. First, a larger research sample that is stratified across types of farmers will allow for a broader range of analytic techniques and a more insightful use of control variables than what was possible in the current study. Given that many survey respondents are likely to be experienced, educated and closely connected to meat processors, prioritising information-driven decision-making, the current results may not fully present the monetary value of information across a broader spectrum. Future research could benefit from a larger, more representative sample. Second, extension to more information types and more stages of the SC will answer more management-related questions and offer greater flexibility in analysis. Third, an explicit link to specific investments in technology, process change or reorganisation is desirable to enable the valuation of information as a return on investment, and broaden the inference available to managers of farms, firms and the industry in general in terms of awareness, and evaluation of alternative technologies and the future role of knowledge-based innovation. The limitations to the current work are a consequence of limited resources and the novelty of the research questions being posed.
Data availability
The data utilised in this paper were obtained from survey questionnaires and can be made available upon request.
References
Adrian AM, Norwood SH, Mask PL (2005) Producers’ perceptions and attitudes toward precision agriculture technologies. Computers and Electronics in Agriculture 48, 256-271.
| Crossref | Google Scholar |
Ainembabazi JH, van Asten P, Vanlauwe B, Ouma E, Blomme G, Birachi EA, Manyong VM (2017) Improving the speed of adoption of agricultural technologies and farm performance through farmer groups: evidence from the Great Lakes region of Africa. Agricultural Economics 48, 241-259.
| Crossref | Google Scholar |
Asrat P, Belay K, Hamito D (2004) Determinants of farmers’ willingness to pay for soil conservation practices in the southeastern highlands of Ethiopia. Land Degradation and Development 15, 423-438.
| Crossref | Google Scholar |
Balistreri E, McClelland G, Poe G, Schulze W (2001) Can hypothetical questions reveal true values? A laboratory comparison of dichotomous choice and open-ended contingent values with auction values. Environmental and Resource Economics 18, 275-292.
| Crossref | Google Scholar |
Bennett R, Balcombe K (2012) Farmers’ willingness to pay for a tuberculosis cattle vaccine. Journal of Agricultural Economics 63, 408-424.
| Crossref | Google Scholar |
Bett RC, Bett HK, Kahi AK, Peters KJ (2009) Evaluation and effectiveness of breeding and production services for dairy goat farmers in Kenya. Ecological Economics 68, 2451-2460.
| Crossref | Google Scholar |
Bowler D (2014) Strategic review of technologies for information management through supply chains. Final report for MLA Project code B.SCC.0176. Meat and Livestock Australia, Sydney, NSW. Available at https://www.mla.com.au/download/finalreports?itemId=506
Burton M, Rigby D, Young T (1999) Analysis of the determinants of adoption of organic horticultural techniques in the UK. Journal of Agricultural Economics 50, 47-63.
| Crossref | Google Scholar |
Calnan H, Williams A, Peterse J, Starling S, Cook J, Connaughton S, Gardner GE (2021) A prototype rapid dual energy X-ray absorptiometry (DEXA) system can predict the CT composition of beef carcases. Meat Science 173, 108397.
| Crossref | Google Scholar | PubMed |
Carrer MJ, de Souza Filho HM, Batalha MO (2017) Factors influencing the adoption of Farm Management Information Systems (FMIS) by Brazilian citrus farmers. Computers and Electronics in Agriculture 138, 11-19.
| Crossref | Google Scholar |
Carson RT, Wilks L, Imber D (1994) Valuing the preservation of Australia’s Kakadu conservation zone. Oxford Economic Papers 46, 727-749.
| Crossref | Google Scholar |
Doss CR, Morris ML (2000) How does gender affect the adoption of agricultural innovations?: The case of improved maize technology in Ghana. Agricultural Economics 25, 27-39.
| Crossref | Google Scholar |
Druschke CG, Secchi S (2014) The impact of gender on agricultural conservation knowledge and attitudes in an Iowa watershed. Journal of Soil and Water Conservation 69, 95-106.
| Crossref | Google Scholar |
D’Souza G, Cyphers D, Phipps T (1993) Factors affecting the adoption of sustainable agricultural practices. Agricultural and Resource Economics Review 22, 159-165.
| Crossref | Google Scholar |
Finger R, Lehmann B (2012) Adoption of agri-environmental programmes in swiss crop production. EuroChoices 11, 28-33.
| Crossref | Google Scholar |
Frew EJ, Whynes DK, Wolstenholme JL (2003) Eliciting willingness to pay: comparing closed-ended with open-ended and payment scale formats. Medical Decision Making 23, 150-159.
| Crossref | Google Scholar | PubMed |
Gao Z, Schroeder TC (2009) Effects of label information on consumer willingness-to-pay for food attributes. American Journal of Agricultural Economics 91, 795-809.
| Crossref | Google Scholar |
Griffith GR, Thompson JM (2012) The aggregate economic benefits to the Australian beef industry from the adoption of Meat Standards Australia: updated to 2010/11. Australasian Agribusiness Review 20, 11-38.
| Google Scholar |
Griffith GR, Thompson JM, Polkinghorne R, Gunner R (2010) Meat Standards Australia as an innovation in the Australian beef production and marketing system. In ‘2010 International European Forum’, 8–12 February 2010, Innsbruck-Igls, Austria. pp. 231–241. (International European Forum on System Dynamics and Innovation in Food Networks)
Griffith G, Gow H, Umberger W, Fleming E, Mounter S, Malcolm B, Baker D (2015) Refocussing on the value chain perspective to analyse food, beverage and fibre markets. Australasian Agribusiness Perspectives 104, 1–19. Available at https://hdl.handle.net/1959.11/17880
Grunert KG, Sonntag WI, Glanz-Chanos V, Forum S (2018) Consumer interest in environmental impact, safety, health and animal welfare aspects of modern pig production: results of a cross-national choice experiment. Meat Science 137, 123-129.
| Crossref | Google Scholar | PubMed |
Grutters JPC, Anteunis LJC, Chenault MN, Joore MA (2009) Willingness to pay for a hearing aid: comparing the payment scale and open-ended question. Journal of Evaluation in Clinical Practice 15, 91-96.
| Crossref | Google Scholar | PubMed |
Guy SZY, Brown DJ, Banks RG (2018) Data capture through Australian beef cattle and meat sheep value chains: opportunities for enhanced feedback to commercial producers. Animal Production Science 58, 1497-1503.
| Crossref | Google Scholar |
Hay R, Pearce P (2014) Technology adoption by rural women in Queensland, Australia: women driving technology from the homestead for the paddock. Journal of Rural Studies 36, 318-327.
| Crossref | Google Scholar |
Horna JD, Smale M, Von Oppen M (2007) Farmer willingness to pay for seed-related information: rice varieties in Nigeria and Benin. Environment and Development Economics 12, 799-825.
| Crossref | Google Scholar |
Hudson D, Hite D (2003) Producer willingness to pay for precision application technology: implications for government and the technology industry. Canadian Journal of Agricultural Economics/Revue Canadienne D’agroeconomie 51, 39-53.
| Crossref | Google Scholar |
Johnson HC, Ward CE (2006) Impact of beef quality on market signals transmitted by grid pricing. Journal of Agricultural and Applied Economics 38, 77-90.
| Crossref | Google Scholar |
Jorgensen BS, Syme GJ, Bishop BJ, Nancarrow BE (1999) Protest responses in contingent valuation. Environmental and Resource Economics 14, 131-150.
| Crossref | Google Scholar |
Kallas Z, Serra T, Gil JM (2010) Farmers’ objectives as determinants of organic farming adoption: the case of Catalonian vineyard production. Agricultural Economics 41, 409-423.
| Crossref | Google Scholar |
Kim SA, Gillespie JM, Paudel KP (2008) Rotational grazing adoption in cattle production under a cost-share agreement: does uncertainty have a role in conservation technology adoption? Australian Journal of Agricultural and Resource Economics 52, 235-252.
| Crossref | Google Scholar |
King AA, Lenox MJ, Terlaak A (2005) The strategic use of decentralized institutions: exploring certification with the ISO 14001 management standard. Academy of Management Journal 48, 1091-1106.
| Crossref | Google Scholar |
Knowler D, Bradshaw B (2007) Farmers’ adoption of conservation agriculture: a review and synthesis of recent research. Food Policy 32, 25-48.
| Crossref | Google Scholar |
Lusk JL, Hudson D (2004) Willingness-to-pay estimates and their relevance to agribusiness decision making. Review of Agricultural Economics 26, 152-169.
| Crossref | Google Scholar |
Magne MA, Cerf M, Ingrand S (2010) A conceptual model of farmers’ informational activity: a tool for improved support of livestock farming management. Animal 4, 842-852.
| Crossref | Google Scholar | PubMed |
Mariano MJ, Villano R, Fleming E (2012) Factors influencing farmers’ adoption of modern rice technologies and good management practices in the Philippines. Agricultural Systems 110, 41-53.
| Crossref | Google Scholar |
Mazoudier PF, Campbell MA, Guy SZY, Henry MLE (2021) Quantifying disease and defect carcass losses at processing to improve feedback in the lamb supply chain: an arthritis case study. Animal Production Science 61, 230-236.
| Crossref | Google Scholar |
Meat and Livestock Australia (2021) Meat beef eating quality insigights. Available at https://www.mla.com.au/globalassets/mla-corporate/marketing-beef-and-lamb/documents/msa-2021-australian-beef-eating-quality-insights-report-_web.pdf
Morales LE, Griffith G, Wright V, Fleming E, Umberger W, Hoang N (2013) Variables affecting the propensity to buy branded beef among groups of Australian beef buyers. Meat Science 94, 239-246.
| Crossref | Google Scholar | PubMed |
Mounter S, Zhang Y, Griffith G (2019) Calibrating and validating an equilibrium displacement model of the Australian sheep meat industry. Australasian Agribusiness Review 27(5), 107-127.
| Crossref | Google Scholar |
Napolitano F, Braghieri A, Piasentier E, Favotto S, Naspetti S, Zanoli R (2010) Effect of information about organic production on beef liking and consumer willingness to pay. Food Quality and Preference 21, 207-212.
| Crossref | Google Scholar |
Olynk NJ, Tonsor GT, Wolf CA (2010a) Consumer willingness to pay for livestock credence attribute claim verification. Journal of Agricultural and Resource Economics 35, 261-280.
| Google Scholar |
Olynk NJ, Tonsor GT, Wolf CA (2010b) Verifying credence attributes in livestock production. Journal of Agricultural and Applied Economics 42, 439-452.
| Crossref | Google Scholar |
Pitchford WS, Trotta CM, Hebart ML, Miller SM, Rutley DL (2020) Yield measurement is valuable for pricing beef carcasses. Animal Production Science 61, 287-293.
| Crossref | Google Scholar |
Polkinghorne R, Thompson JW, Watson R, Gee A, Porter M (2008) Evolution of the Meat Standards Australia (MSA) beef grading system. Animal Production Science 48, 1351-1359.
| Crossref | Google Scholar |
Prado AM, Woodside AG (2015) Deepening understanding of certification adoption and non-adoption of international-supplier ethical standards. Journal of Business Ethics 132, 105-125.
| Crossref | Google Scholar |
Rehman F, Muhammad S, Ashraf I, Mahmood CK, Ruby T, Bibi I (2013) Effect of farmers’ socioeconomic characteristics on access to agricultural information: empirical evidence from Pakistan. Journal of Animal and Plant Sciences 23, 324-329.
| Google Scholar |
Storer C (2006) Information communication tools used to coordinate food chains. Australasian Agribusiness Review 14, 1-22.
| Google Scholar |
Szabó Z (2011) Reducing protest responses by deliberative monetary valuation: Improving the validity of biodiversity valuation. Ecological Economics 72, 37-44.
| Crossref | Google Scholar |
Ulimwengu J, Sanyal P (2011) Joint estimation of farmers’ stated willingness to pay for agricultural services. International Food Policy Research Institute Discussion Paper, discussion paper 01070. Available at https://www.ifpri.org/publication/joint-estimation-farmers%E2%80%99-stated-willingness-pay-agricultural-services#:~:text=As%20expected%2C%20farmers’%20income%2C,these%20services%20should%20be%20recommended
Verbeke W, Ward RW (2006) Consumer interest in information cues denoting quality, traceability and origin: an application of ordered probit models to beef labels. Food Quality and Preference 17, 453-467.
| Crossref | Google Scholar |
Zapata SD, Carpio CE (2014) The theoretical structure of producer willingness to pay estimates. Agricultural Economics 45, 613-623.
| Crossref | Google Scholar |
Zhang Y, Mounter S, Griffith G (2018) Updating and recalibrating equilibrium displacement models of the Australian livestock industries: beef. Australasian Agribusiness Review 26, 48-67.
| Google Scholar |
Zhang Y, Baker D, Griffith G (2020) Product quality information in supply chains: a performance-linked conceptual framework applied to the Australian red meat industry. The International Journal of Logistics Management 31, 697-723.
| Crossref | Google Scholar |