

Wagyu Feeder Check: A genomic-based tool to identify performance differences of Australian Wagyu and Wagyu crossed cattle
Antonio Reverter A * , Yutao Li A , Pâmela A. Alexandre A , Sonja Dominik B , Carel Teseling C , Aaron van den Heuvel C , Karen Schutt D , Matt McDonagh C and Laercio Porto-Neto A
A
B
C
D
Abstract
Wagyu Feeder Check is a genomic-based tool designed to provide genomic estimated breeding values (GEBV) for five feedlot growth and carcase traits. At present, Wagyu Feeder Check is based on a reference population of 8316 genotyped and phenotyped Australian fullblood (FB; N = 2120) Wagyu and Wagyu-crossed (XB; N = 6196) cattle, principally Wagyu × Angus F1 animals.
We provide technical details behind the development of the Wagyu Feeder Check and validate the ability of its GEBV to predict differences in performance of Wagyu cattle in daily weight gain at feedlot, carcase weight, carcase eye muscle area, carcase marbling score and carcase rump fat at the P8 site.
Data supplied from eight commercial supply chains across Australia was used to generate GEBV using mixed-model equations that incorporated a genomic relationship matrix build with 82 504 autosomal markers. The bias, dispersion, and accuracy of the GEBV were evaluated using a four-way cross-validation scheme where, in each turn, the phenotypes from a random 1549 (or 25%) XB cattle were set as missing.
The genomic estimate of the Wagyu content in the FB and XB population averaged 99.12% and 59.55%, respectively, and with most of the non-Wagyu content associated with Angus. The estimates of heritability (± s.e.) were 0.497 ± 0.016, 0.474 ± 0.004, 0.347 ± 0.014, 0.429 ± 0.003 and 0.422 ± 0.003 for daily weight gain at feedlot, carcase weight, eye muscle area, marbling and rump fat, respectively. Averaged across the four XB validation populations, the accuracy of GEBV was 0.624, 0.634, 0.385, 0.620, and 0.526 for the same set of traits.
Genomic predictions generated by Wagyu Feeder Check can predict differences in feedlot and carcase performance of Australian Wagyu cattle. Given the large content of Angus in the XB population, further research is required to determine the predictive ability of GEBV in Wagyu × Bos indicus and Wagyu × dairy animals.
Commercial feedlot operators finishing animals with a strong Wagyu breed component will benefit from using Wagyu Feeder Check for decision making.
Keywords: accuracy, beef cattle, bias, carcase, feedlot, genomic predictions, heritability, marbling.
Introduction
Building on a long line of research mapping phenotypes to genotypes, genomic technologies have changed and may continue to change animal breeding (Johnsson 2023). Nowadays, genomic-based technologies are allowing commercial beef producers to predict the genetic merit of individual animals in their herds of unknown pedigree for the first time (Reverter et al. 2016; Hine et al. 2021; Alexandre et al. 2022).
Specifically for the Australian beef cattle industry, recent examples of such genomic tools include the Angus HeiferSELECT (Alexandre et al. 2022) and the Angus SteerSELECT (Hine et al. 2021). The former has been validated using historical data from 153 978 registered Angus animals; the latter has been validated using a population of 522 short-fed (100 days) or long-fed (270 days) Angus steers finished in commercial feedlots. Also, for SteerSELECT the potential benefit of incorporating commercial data in the reference population has been evaluated (Reverter et al. 2023).
Expanding on the premises of that prior work, Wagyu Feeder Check is a genomic-based tool designed with the express purpose of providing genomic estimated breeding values (GEBV) for five traits related to feedlot growth and carcase characteristics. The Wagyu Feeder Check tool was launched in April 2023 during the WagyuEdge23 Conference. Practical aspects and details about how producers can benefit from using Wagyu Feeder Check can be found online from the Australian Wagyu Association website: https://www.wagyu.org.au/for-members/wagyu-feeder-check. At present, Wagyu Feeder Check is based on a reference population of 8316 genotyped and phenotyped Australian Wagyu fullblood and Wagyu-crossed cattle, principally Wagyu × Angus F1 animals.
A recent study by Takeda et al. (2021) with a Japanese Black cattle population showed that, for carcase traits, a total of 7000–11 000 animals is a sufficient reference population size for genomic prediction. In this sense, previous studies have explored the benefits of expanding the reference population, for instance, incorporating multiple breeds in the context of crossbreeding programs and for the selection of purebreds for optimal crossbred performance (Porto-Neto et al. 2015; van Grevenhof and van der Werf 2015; Karaman et al. 2021).
Therefore, in addition to providing the technical details behind the development of the Wagyu Feeder Check genomic tool, our aim for this study is to undertake a comprehensive internal cross-validation to ascertain the quality of Wagyu Feeder Check GEBV in the crossbred population.
Materials and methods
Wagyu fullblood (FB) and crossbred (XB) population details
The Wagyu Feeder Check is based on a reference population of 8316 genotyped and phenotyped Australian fullblood Wagyu (FB, N = 2120) and Wagyu-crossed (XB, N = 6196) cattle, principally Wagyu × Angus F1 animals. Feedlot and carcase records were supplied by independent commercial supply chains from eight populations including three FB populations (POP1, N = 1455; POP2, N = 477; and POP3, N = 188) and five XB populations (POP4, N = 1049; POP5, N = 1285; POP6, N = 2456; POP7, N = 654; and POP8, N = 752). Animals were slaughtered from 2013 to 2022, with XB animals slaughtered only in 2021 (N = 2098) and 2022 (N = 4098). Phenotypes included daily gain at feedlot finishing (FADG), carcase weight (CWT), carcase eye muscle area (CEMA), carcase AUS-MEAT marbling score (MARB) and carcase rump fat at the P8 site (CP8). To accommodate high marbling content, MARB was measured using a modified AUS-MEAT scoring system (AUS-MEAT 2005), which ranges from 1 (nil) to 12 (abundant) in increments of 1.
For the analysis of phenotypes, a contemporary group (CG) was defined as a combination of population of origin (eight levels combining feedlot and abattoir), sex (two levels), and kill date. There were 71 and 13 kill dates for the FB and XB populations, respectively. For the FB populations all months were represented, whereas for the XB population all months were represented except for December and January. Initial edits aimed at removing animals without genotypes or from CG with less than three individuals. For the FB population, there were 82 CG with an average of 25.8 cattle and ranging from 3 to 145. For the XB population, there were 29 CG with an average of 213.6 cattle and ranging from 8 to 576.
Genotypes and genomic relationships
Genotypes for 82 504 autosomal single nucleotide polymorphisms (SNP) were available for all 8316 animals included in this study and used to compute the genomic relationship matrix (GRM) following Method 1 of VanRaden (2008) with the modification of Karoui et al. (2012) to make it invertible:
where S is the centred matrix relating SNP genotypes (recoded as 0, 1 or 2) in columns with animals in rows, and pi is the frequency of the second allele of the i-th SNP, and I is an identity matrix included to make GRM invertible by enlarging the diagonal elements.
To obtain a measure of the genomic similarity between the two populations, FB and XB, we explored the SNP allele frequencies, the values of the GRM and performed a principal components analysis (PCA) based on a singular value decomposition of the GRM (Misztal and Legarra 2017). Additionally, using a smaller panel of 27 883 SNPs and numerical approaches outlined in Reverter et al. (2020) we estimated the genomic breed composition of FB and XB cattle across 10 breeds including: Wagyu, Angus, Brahman, Charolais, Hereford, Holstein, Limousin, Santa Gertrudis, Shorthorn and Simmental.
Finally, the genomic relationships among all individuals were processed following the network-based Pedigromics pipeline (Reverter et al. 2019) by establishing network connections after considering genomic relationships ≥0.125 corresponding to the equivalent of a great-grandparent to great-grand offspring relationship.
Genomic predictions and cross-validation accuracy
Variance components, heritability (h2), genetic (rg) and residual (re) correlations were estimated based on GBLUP methodology (genomic best linear unbiased prediction) using the Qxpak5 software (Pérez-Enciso and Misztal 2011). For the genomic prediction models, we carried out GBLUP analyses including one pentavariate analysis with the entire dataset to produce the most accurate genomic predictions to use as reference; and a series of 20 univariate analyses from the cross-validation datasets (with 20 from five traits by four validation groups). In all cases, the GBLUP models contained the fixed effects of CG and the linear regression covariates of slaughter age (in days), and the first three principal components of the GRM. Fitting the principal components aims at accounting for hidden population structures, likely with FB and XB populations, that could have been missed if only fitting CG. Additionally, the random additive polygenic and residual effects were fitted in the GBLUP models with assumed distributions N(0, G⊗V) and N(0, I⊗R), respectively, where G represents the GRM described earlier, V is the genetic covariance matrix, I is an identity matrix, R is the residual variance–covariance matrix and ⊗ represents the Kronecker product.
Firstly, the resulting GEBV from the pentavariate analysis were termed to indicate that they are based on the whole dataset. Secondly, for the cross-validation of genomic predictions, we created four cross-validation datasets each with the phenotypes from a random 1549 (or 25%) XB cattle set as missing. In each cross-validation schema, the resulting GEBV were termed to indicate that they are based on partial data.
Finally, traditional (Bolormaa et al. 2013) and LR method (Legarra and Reverter 2018) approaches were used to estimate accuracy, bias, and dispersion of GEBV. The following four metrics were employed:
Traditional Accuracy (ACCT): In the context of cross-validation, the accuracy of a GEBV is traditionally computed from the Pearson correlation between a GEBV and the adjusted phenotype (y*; phenotype y adjusted for fixed effects) for individuals in the validation population, and divided by the square root of heritability:
Method LR Accuracy (ACCLR): For individuals in the validation population, Method LR accuracy was computed as follows:
where is the average inbreeding coefficient obtained by subtracting one from the diagonal elements of G, is the average relationship between individuals obtained from the off-diagonal elements of G, and is the genetic variance at equilibrium in a population under selection. Assuming the individuals in the validation population are not under selection, can be approximated by the additive genetic variance estimated from the partial dataset.
Method LR Bias (BiasLR): This is the difference between the average GEBV of individuals in the validation population using the partial data minus that using the whole data:
In the absence of bias, the expected value of BiasLR is 0; positive and negative values indicate respectively overestimation and underestimation of GEBV for validation animals when their own observation was not included.
Method LR Dispersion (DispLR): For individuals in the validation population, dispersion was measured from the slope of the regression of on :
In the absence of bias, the expected value of DispLR is 0. Values less than 0 indicate under-dispersion (or deflation) of into as phenotypes become available. Values greater than 1 indicate over-dispersion (or inflation) of into .
For bias and dispersion, we constructed 95% confidence intervals based on ± 1.96 s.e. around the observed means across the 20 scenarios, i.e. 5 traits × 4 validation datasets.
Results and discussion
Phenotypes
Table 1 provides summary statistics for all raw and unadjusted phenotypes, and the slaughter age covariate used in the analyses. Based on the fixed effects model used to adjust phenotypes, the CG effects and covariates combined accounted for 33.5%, 37.1%, 30.7%, 30.8% and 45.2% of the variation in FADG, CWT, CEMA, MARB and CP8, respectively, and with all effects being highly significant (P < 0.001) for all traits, except for slaughter age (P > 0.1) for CEMA, which was likely captured by the effect of CG. On average and compared to FB, XB cattle were 15 days older, with 6.5% heavier carcases and 27% less marble, but 46% more subcutaneous fat. For the XB cattle, the values in Table 1 are very similar to those reported by Connolly et al. (2019) with a Wagyu crossbred population with a Wagyu content estimated at 73.0 ± 0.7%. In that work, and after 163 days on feed and an average age at slaughter of 1147 days, the authors reported means ± s.e. for CWT, CEMA, MARB and CP8 of 434 ± 5.2 kg, 41.4 ± 0.85 cm2, 5.9 ± 0.52 scores and 23.7 ± 1.01 mm, respectively.
| Population | Trait | N | Mean | s.d. | Min. | Max. | |
|---|---|---|---|---|---|---|---|
| FB | AGE (day) | 2120 | 874.27 | 125.49 | 614.00 | 1746.00 | |
| FADG (kg/day) | 2120 | 0.83 | 0.11 | 0.38 | 1.16 | ||
| CWT (kg) | 2120 | 408.60 | 41.37 | 213.00 | 563.50 | ||
| CEMA (cm2) | 1738 | 90.88 | 11.82 | 42.00 | 139.00 | ||
| MARB (score) | 2119 | 7.52 | 1.87 | 2.00 | 12.00 | ||
| CP8 (mm) | 2095 | 16.49 | 6.46 | 4.00 | 50.00 | ||
| XB | AGE (day) | 6196 | 890.46 | 98.83 | 750.00 | 1242.00 | |
| FADG (kg/day) | 4880 | 0.92 | 0.16 | 0.26 | 1.51 | ||
| CWT (kg) | 6155 | 435.03 | 45.03 | 239.40 | 628.00 | ||
| CEMA (cm2) | 4551 | 89.35 | 8.51 | 17.00 | 140.00 | ||
| MARB (score) | 6155 | 5.91 | 1.48 | 2.00 | 9.00 | ||
| CP8 (mm) | 4877 | 24.06 | 8.46 | 7.00 | 62.00 |
FB, fullblood population; XB, crossbred population; AGE, slaughter age; FADG, average daily gain during feedlot finishing; CWT, hot carcase weight; CEMA, carcase eye muscle area; MARB, AUS-MEAT marbling score; CP8, carcase subcutaneous fat depth at the rump or P8 site.
With respect to FADG, our averages of 0.83 kg/day for FB and of 0.92 kg/day for XB are comparable to those from Vázquez-Mosquera et al. (2022), who reported daily weight gains of 0.916 kg/day for Wagyu purebred steers (N = 262) and 1.046 kg/day for Wagyu × Angus crossbred steers (N = 103) during the weaning to growing period, and 0.628 kg/day for purebred and 0.640 kg/day for crossbred during the growing to fattening phase. Similarly, the study of Alexandre et al. (2021) with 3408 Australian Angus steers slaughtered at an average of 734.53 days reported means ± s.d. for FADG, CWT, and CEMA of 1.59 ± 0.33 kg/day, 432.99 ± 65.60 kg and 90.06 ± 10.86 cm2, respectively. More recently, Reverter et al. (2023) with a population of 2120 Angus-based steers from four commercial feedlots feed for an average of 222.46 day, reported means ± s.d. for CWT and MARB of 425.45 ± 43.94 kg and 3.64 ± 1.33, respectively.
Genotypes and genomic relationships
On average, the estimated percentage of genomic Wagyu content in the FB and XB cattle was 99.12% and 59.55%, respectively. Also on average, the sum of Wagyu and Angus content in the XB cattle was 94.12% and with the remaining 5.88% estimated to originate from mostly Holstein, Santa Gertrudis, and Shorthorn with more than 1% (Table 2). Given the large content of Angus in the XB population, caution will be needed when exploring the applicability of the Wagyu Feeder Check tool in Wagyu × Bos indicus crossbred animals. In particular, among the XB cattle, there were 129 (or 2.1%) for which the summed Wagyu and Angus content was <50%. For these animals, the average Wagyu and Angus content was 42.63% and 2.33%, respectively. Therefore, these 129 XB cattle could be considered F1 Wagyu × non-Angus. Other significant breed percentages represented among these 129 XB cattle were Shorthorn (17.80%), Santa Gertrudis (12.90%), Charolais (7.07%), Holstein (6.21%) and Hereford (5.46%).
| Breed | Mean | s.d. | Min. | Max. | |
|---|---|---|---|---|---|
| Wagyu | 59.55 | 17.18 | 0.00 | 100.00 | |
| Angus | 34.57 | 19.24 | 0.00 | 100.00 | |
| Holstein | 1.17 | 6.79 | 0.00 | 62.19 | |
| Santa Gertrudis | 1.10 | 4.38 | 0.00 | 50.44 | |
| Shorthorn | 0.89 | 4.44 | 0.00 | 43.53 | |
| Hereford | 0.84 | 3.86 | 0.00 | 50.58 | |
| Charolais | 0.81 | 2.84 | 0.00 | 33.13 | |
| Brahman | 0.77 | 3.73 | 0.00 | 50.03 |
The percentage of variation in genomic relationships accounted for the first three principal components was 4.97%, 1.02% and 0.90%, respectively. Fig. 1 displays the scatter plot of the PCA for the first two principal components (PC1 and PC2) with the two populations (FB and XB) distinctly highlighted. Also highlighted in Fig. 1 are the 129 XB cattle with low Angus content. Explaining 4.97% of the variation in genomic relationships, PC1 shows a clear separation between FB and XB. On closer examination, we found a very strong Pearson correlation coefficient (r) between the genomic estimate of Wagyu content and PC1 (r = 0.976 ± 0.002). This correlation remained strong when examined within the FB (r = 0.687 ± 0.016) and within the XB (r = 0.959 ± 0.004) populations. In multibreed beef populations, it is not uncommon for PC1 to distinguish between Bos taurus and Bos indicus cattle. For recent examples, see for instance Yonesaka et al. (2016) and Porto-Neto et al. (2023). The work by Yonesaka et al. (2016) is of particular relevance because although their PC1 explained 17.6% of the variation, indeed separating Bos taurus from Bos indicus population, PC2 explained 4.5% (very close to our 4.96%) and distinguished Japanese Black cattle in one extreme and Angus on the other.
Scatter plot of the first two principal component, PC1 and PC2, of the genomic relationship among individuals in the Wagyu fullblood (FB; black dots), Wagyu crossbreds (XB; red dots) populations, and in the 129 XB cattle with low Angus content (blue inverted triangles).
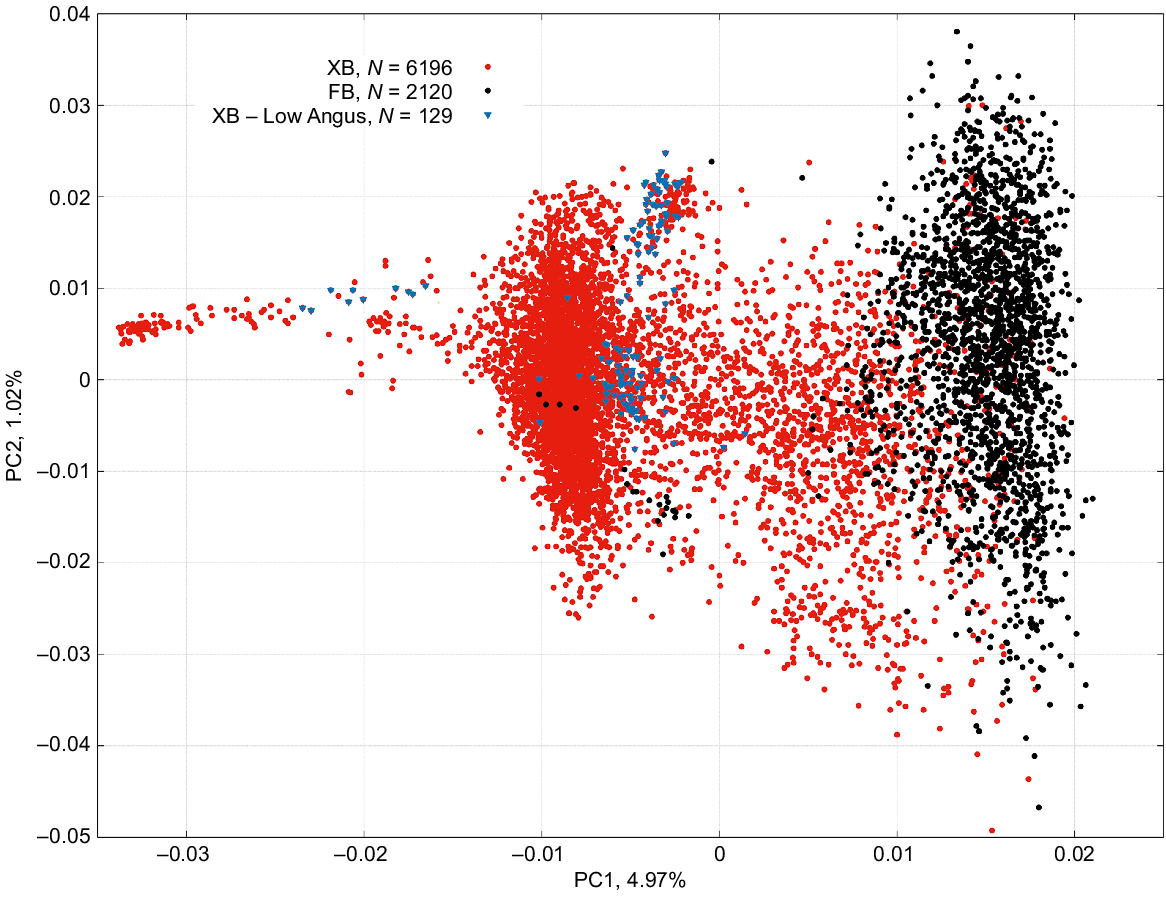
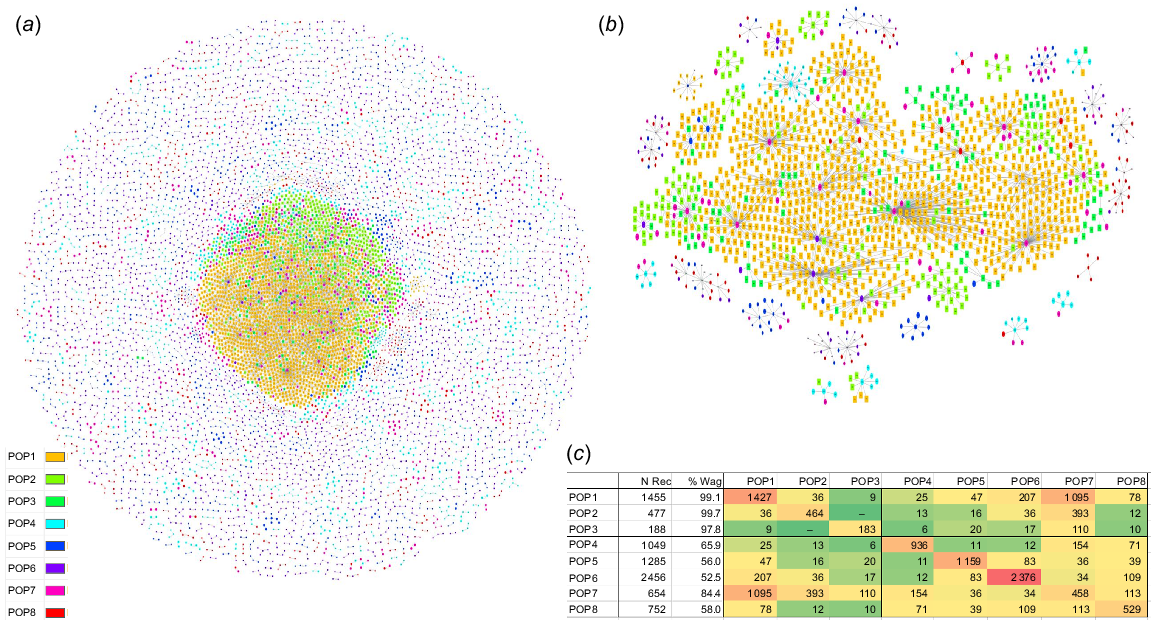
Fig. 2a shows the structure of the Wagyu Feeder Check population using the Pedigromics network approach (Reverter et al. 2019). The centre of the network is dominated by the three FB populations whereas the five XB populations, with smaller node sizes, are scattered around the periphery. To better illustrate the interconnectivity within and across populations, the insert in Fig. 2b shows a subset of the whole Pedigromics network where only the 10 most connected animals within each of the eight populations are displayed. As expected, due to the larger size of POP1 among the FB, most of the connectivity from XB to FB happens through POP1. This interconnectivity within and across populations is further exemplified in Fig. 2c where a heatmap of genomic relationships >12.5% is tabled. The diagonals are showing the connectivity within a population and populations are more highly correlated within themselves than across populations. Although there’s little connectivity among the three FB populations (POP1, POP2 and POP3) including no connectivity between POP2 and POP3, all five XB populations (POP4 to POP8) have connections with the FB populations. Also, the XB population with the highest Wagyu content (POP7 and 84.4% Wagyu) has the highest connectivity with the three FB populations. Importantly, the Wagyu content was not estimated based on connections to the FB populations.
(a) Structure of the Wagyu Feeder Check population using the Pedigromics network approach (Reverter et al. 2019), where animals from the eight populations (POP1 to POP8) are nodes, genomic relationships >12.5% are edges and the percent Wagyu content is mapped to the size of each node. (b) A subset of the whole Pedigromics network where only the 10 most connected animals within each of the eight populations are displayed. (c) Interconnectivity within and across the eight populations (POP1 to POP8) including number of records (N Rec), percentage of Wagyu content (% Wag) and based on genomic relationships >12.5%.
Upon closer inspection of the GRM, the proportion of genomic relationships >25% (indicating potential half-sibs) was 5.30%, 11.82%, 6.79%, 1.30%, 0.73%, 0.64%, 0.61%, and 0.27% for POP1 to POP8, respectively. Therefore, the proportion of half-sibs within each XB population (POP4 to POP8) does not seem to be higher than that observed within the FB populations (POP1 to POP3).
Genetic parameter estimates
Table 3 shows the estimates of heritability (h2, ± standard error (s.e.)), genetic (rg) and residual correlation (re) obtained from the pentavariate GBLUP model with the entire dataset. Heritability estimates were generally moderate to high, ranging from 0.347 ± 0.021 for CEMA to 0.526 ± 0.018 for FADG. Our h2 estimates are very similar to those recently reported by Rostamzadeh Mahdabi et al. (2023) using a population of 9850 Wagyu steers and heifers. In that work, the authors reported h2 estimates of 0.510 ± 0.014 for CWT, 0.430 ± 0.015 for CEMA, 0.473 ± 0.015 for CP8 and 0.486 ± 0.014 for MARB. In Japanese Black cattle, Onogi et al. (2014) reported h2 for CWT (0.56), CEMA (0.43) and MARB (0.66), which are higher than those from our study. Similarly, h2 estimates for carcase traits in Korean Hanwoo cattle have been reported recently. Estimates from Mehrban et al. (2019) include CWT (0.39), CEMA (0.45), MARB (0.64) and CP8 (0.51); and estimates from Naserkheil et al. (2021) were 0.42, 0.50, 0.59, and 0.56 for CWT, CEMA, MARB and CP8, respectively.
| FADG | CWT | CEMA | MARB | CP8 | ||
|---|---|---|---|---|---|---|
| FADG | 0.526 ± 0.018 | 0.832 ± 0.012 | 0.307 ± 0.047 | −0.083 ± 0.04 | 0.131 ± 0.040 | |
| CWT | 0.742 ± 0.009 | 0.475 ± 0.017 | 0.391 ± 0.045 | 0.026 ± 0.037 | 0.139 ± 0.039 | |
| CEMA | 0.199 ± 0.020 | 0.275 ± 0.018 | 0.347 ± 0.021 | 0.333 ± 0.048 | −0.124 ± 0.05 | |
| MARB | 0.036 ± 0.019 | 0.081 ± 0.018 | 0.209 ± 0.018 | 0.437 ± 0.018 | −0.085 ± 0.04 | |
| CP8 | 0.097 ± 0.022 | 0.148 ± 0.020 | 0.016 ± 0.020 | 0.017 ± 0.019 | 0.428 ± 0.021 |
FADG, average daily gain during feedlot finishing; CWT, hot carcase weight; CEMA, carcase eye muscle area; MARB, AUS-MEAT marbling score; CP8, carcase subcutaneous fat depth at the rump or P8 site.
The review of Ríos Utrera and Van Vleck (2004) reported average h2 estimates for CWT, CP8, CEMA and MARB of 0.40, 0.36, 0.40, and 0.37, respectively. Therefore, at 0.347 ± 0.021 our h2 estimate for CEMA is somewhat lower than what has been generally reported. On the other extreme, at 0.526 ± 0.018 our h2 estimate for FADG is higher than published values including the 0.33 of Torres-Vázquez et al. (2018) and the 0.30 of Alexandre et al. (2021) both with Angus cattle, and the 0.31 of Somavilla et al. (2017) with Nellore cattle.
Estimates of rg were strong and positive between FADG and CWT (0.832 ± 0.012), and moderate and positive between CWT and CEMA (0.391 ± 0.045) and between CEMA and MARB (0.333 ± 0.048). For the same three pairs of traits, the study of Alexandre et al. (2021) with Angus cattle reported rg estimates of 0.65, 0.37 and 0.14, respectively; with Hanwoo cattle, Naserkheil et al. (2021) estimated rg of 0.56 between CWT and CEMA and 0.35 between CEMA and MARB. In general, all other rg estimates were within two s.e. and likely not significantly different from zero. Also, in general, the estimates of re were lower and closer in magnitude to zero than the rg estimates.
Heritabilities, genetic and residual correlations are trait- and population-specific parameters; therefore, a diversity of estimates can be observed in different studies even with the same breed and trait. Factors such as breed, environment, age at measurement, accuracy of measurement and data source (i.e. pedigree or genomic), as well as the analytical methodology may affect the estimates. Because of this diversity, it is always worthwhile to explore the quality of the resulting genomic predictions in terms of their accuracy, bias, and dispersion. This is particularly the case when, as in the current study, the main objective is to develop a genomic tool to be deployed at scale in commercial scenarios.
Genomic predictions and cross-validation results
Shown in Fig. 3 are the genomic prediction accuracies for all traits averaged across the four cross-validation samples and based on both accuracy metrics, ACCT and ACCLR. Also in Fig. 3 are the ACCT for the 129 XB cattle with low Angus content. Across the 20 accuracy estimates obtained from five traits and four validation datasets, the correlation between ACCT and ACCLR was 0.922, an estimate higher than the 0.73 reported by Alexandre et al. (2021) across 49 estimates, and the 0.831 reported by Reverter et al. (2021) across 15 estimates and both studies with feedlot and carcase traits in Angus cattle.
Genomic prediction accuracy based on traditional accuracy (ACC_T) and LR method accuracy (ACC_LR) across the entire population and ACC_T in 129 XB cattle with low Angus content for average daily gain during feedlot finishing (FADG), hot carcase weight (CWT), carcase eye muscle area (CEMA), AUS-MEAT marbling score (MARB), and carcase subcutaneous fat depth at the rump or P8 site (CP8).
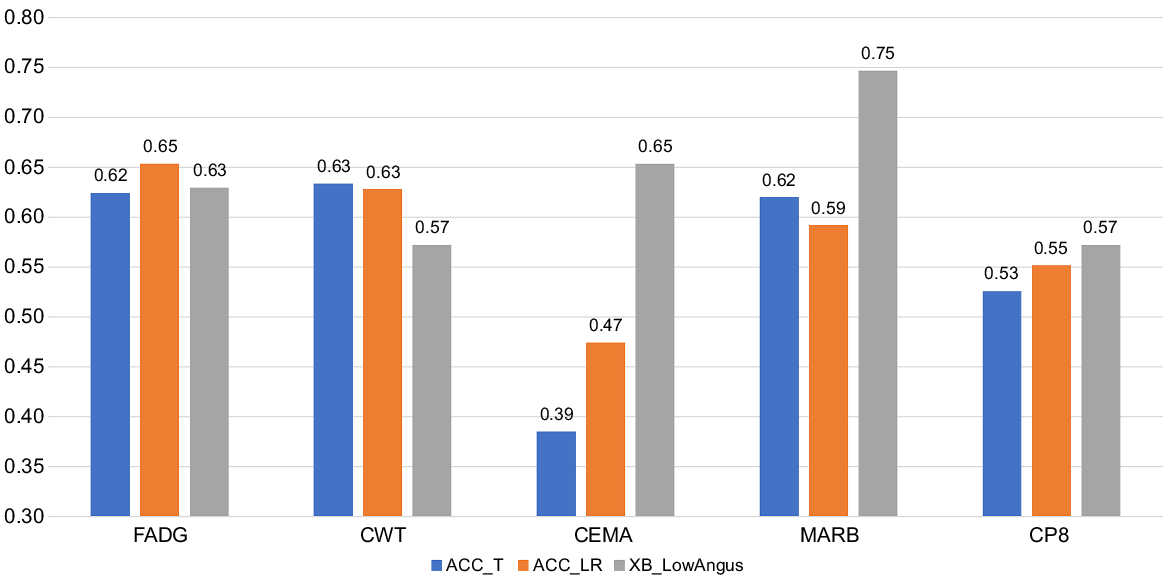
Accuracies were in the range of 55–65% for all traits except for CEMA, which were in the 40–50% range. This lower accuracy for CEMA was attributed to its lower h2 of ~0.35 compared to h2 > 0.45 for the other traits (Table 3). Our GEBV accuracies are consistent with the theoretical expectation of ~55% and ~65% respectively for traits of 0.3 and 0.5 heritability and a reference population of ~7000 individuals (Goddard and Hayes 2009), which is the equivalent of 8316 total animals in our case minus the ~1500 XB animals set aside for each validation. If a whole sub-population of XB had their phenotypes set to missing the expectation is that the ACC would be diminished, particularly if that sub-population is poorly connected. However, all XB populations have connections among themselves and among all three FB populations (Fig. 2c). In addition, because most sub-populations of XB have less than 1549 animals or 25% of XB cattle (the exception being POP6 with 2456 cattle), setting their phenotypes to missing would imply that the remaining ‘reference’ is larger which might result in higher genomic prediction ACC. This phenomenon has been recently reported by Reverter et al. (2023) where data from four commercial feedlots were removed one feedlot at a time and compared to removing 50% of all the commercial data.
The study of Onogi et al. (2014) with Japanese Black cattle reported a predicted ability (correlation between the GEBV and the adjusted phenotypes) of 0.44, 0.42 and 0.39 for CWT, CEMA and MARB, respectively. Meanwhile, the study of Mehrban et al. (2019) with Hanwoo cattle estimated GEBV accuracies of 0.56, 0.44, 0.36 and 0.33 for CWT, CEMA, MARB and CP8, respectively.
For the 129 XB cattle with low Angus content GEBV accuracies were not markedly affected for FADG and CP8, whereas they were somewhat lower for CWT, and higher for CEMA and MARB. This rather unexpected result was attributed to the low number of animals affecting the precision of the ACC estimates, and to the large proportion of Wagyu content in these cattle (average 42.6%, range = 0–49.9%). Nevertheless, we maintain that caution will be needed when exploring the applicability of the Wagyu Feeder Check tool in Wagyu × non-Angus, particularly Wagyu × Bos indicus crossbred animals.
Averaged across all validation datasets, and indicating no bias, the 95% confidence interval for GEBV bias contained zero in all traits (Table 4, upper part). Similarly, the 95% confidence intervals for the dispersion in GEBV contained zero for all traits except FADG for which the 95% confidence interval showed a tendency for under-dispersion (or deflation) of GEBV (Table 4, lower part). Nevertheless, this under-dispersion vanished at 99% confidence interval.
| Trait | Mean | 95% LB | 95% UP | |
|---|---|---|---|---|
| Bias | ||||
| FADG (kg/day) | −0.000 ± 0.001 | −0.003 | 0.002 | |
| CWT (kg) | 0.063 ± 0.318 | −0.559 | 0.683 | |
| CEMA (cm2) | 0.022 ± 0.067 | −0.110 | 0.154 | |
| MARB (score) | 0.001 ± 0.011 | −0.019 | 0.022 | |
| CP8 (mm) | 0.031 ± 0.061 | −0.090 | 0.151 | |
| Dispersion | ||||
| FADG (kg/day) | −0.056 ± 0.025 | −0.106 | −0.007 | |
| CWT (kg) | −0.034 ± 0.021 | −0.074 | 0.007 | |
| CEMA (cm2) | −0.001 ± 0.031 | −0.062 | 0.060 | |
| MARB (score) | 0.005 ± 0.019 | −0.032 | 0.042 | |
| CP8 (mm) | −0.010 ± 0.027 | −0.062 | 0.042 | |
FADG, average daily gain during feedlot finishing; CWT, hot carcase weight; CEMA, carcase eye muscle area; MARB, AUS-MEAT marbling score; CP8, carcase subcutaneous fat depth at the rump or P8 site.
Unlike the recent work of Reverter et al. (2023) with 3766 purebred Angus steers plus 2124 Angus-based commercial steers, in the present study we did not observe a tendency for over-dispersion (or inflation) of GEBV for CWT or MARB. Similarly, the recent work by Koo et al. (2023) exploring the quality of the genomic evaluation of Korean Hanwoo cattle based on a large number of genotyped cows, steers and young animals applied the LR method to confirm a slight negative bias (GEBV overestimation) for all traits and animal groups, but a slight positive bias (GEBV underestimation) for CEMA and MARB in steers. However, their estimates of bias did not deviate significantly from zero. Similarly, their LR estimate of dispersion did not deviate markedly from the expected value of 1 suggesting that GEBV were neither inflated nor deflated.
Like the case for genetic parameters, estimates of GEBV quality metrics (i.e. bias, dispersion, and accuracy) can be affected by a myriad of reasons including the size of the reference population, heritability of the trait, relatedness between reference and validation population, and marker density. Again, because of this diversity, it is always worthwhile to explore the quality of the resulting GEBV in terms of their ability to reflect phenotypic differences in the highest and lowest GEBV quartile.
Table 5 presents phenotypic values for validation XB animals assigned to quartiles on the basis of GEBV and the difference (Q1mQ4) between the top (Q1) and the bottom (Q4) quartile. In agreement with the theoretical expectation of a linear relationship between ACC and phenotypic differences in predefined percentiles (Reverter et al. 2022), we observed a Q1mQ4 difference of 0.154 kg/day in FADG, 40.92 kg of CWT, 4.368 cm2 of CEMA, 1.419 scores of MARB and 5.325 mm of CP8.
| Trait | Q1 | Q2 | Q3 | Q4 | Q1mQ4 | |
|---|---|---|---|---|---|---|
| FADG (kg/day) | 0.076 | 0.019 | −0.016 | −0.078 | 0.154 | |
| CWT (kg) | 20.701 | 5.496 | −5.835 | −20.220 | 40.92 | |
| CEMA (cm2) | 2.044 | 0.287 | 0.002 | −2.324 | 4.368 | |
| MARB (score) | 0.736 | 0.178 | −0.226 | −0.683 | 1.419 | |
| CP8 (mm) | 3.043 | 0.709 | −0.916 | −2.282 | 5.325 |
FADG, average daily gain during feedlot finishing; CWT, hot carcase weight; CEMA, carcase eye muscle area; MARB, AUS-MEAT marbling score; CP8, carcase subcutaneous fat depth at the rump or P8 site.
Conclusions
The present study highlights the potential of genomic predictions generated by Wagyu Feeder Check regarding differences in feedlot and carcase performance of Australian Wagyu cattle. Given the large content of Angus in the XB population, further research is required to determine the predictive ability of GEBV in Wagyu × Bos indicus and Wagyu × dairy animals. Our preliminary results indicate that commercial feedlot operators finishing animals with a strong Wagyu breed component will benefit from using Wagyu Feeder Check. Benefits will come from identifying and discarding low genetic merit animals from long-fed programs, as well as from minimising days on feed required to achieve a high marbling product. Future research will focus on the expansion of the database constituting the reference population and on the recalibration of the genomic predictions.
Data availability
The data that support this study may be shared upon reasonable request to the corresponding author.
Declaration of funding
This research received funding from the Entrepreneurs’ Programme of the Department of Industry, Science and Resources, Australian Government.
Acknowledgements
The assistance of Gavin Purtell, Mitch McGuire and Therese Willis from CSIRO is gratefully acknowledged. The vital support of support staff from the Australian Wagyu Association is gratefully acknowledged. The assistance of JR Tait and Sarah Buttsworth from Neogen and of Mitch McGuire from Entrepreneurs’ Programme is truthfully appreciated.
References
Alexandre PA, Li Y, Hine BC, Duff CJ, Ingham AB, Porto-Neto LR, Reverter A (2021) Bias, dispersion, and accuracy of genomic predictions for feedlot and carcase traits in Australian Angus steers. Genetics Selection Evolution 53, 77.
| Crossref | Google Scholar |
Alexandre PA, Porto-Neto LR, Hine B, Ingham A, Duff C, Samaraweera M, Reverter A (2022) Validation of HeiferSELECT genomic product using historical data. In ‘Proceedings of the 12th World Congress on Genetics Applied to Livestock Production, Rotterdam, The Netherlands, 3–8 July 2022’. (Wageningen Academic Publishers)
Bolormaa S, Pryce JE, Kemper K, Savin K, Hayes BJ, Barendse W, Zhang Y, Reich CM, Mason BA, Bunch RJ, Harrison BE, Reverter A, Herd RM, Tier B, Graser H-U, Goddard ME (2013) Accuracy of prediction of genomic breeding values for residual feed intake and carcass and meat quality traits in Bos taurus, Bos indicus, and composite beef cattle. Journal of Animal Science 91, 3088-3104.
| Crossref | Google Scholar | PubMed |
Connolly S, Dona A, Wilkinson-White L, Hamblin D, D’Occhio M, González LA (2019) Relationship of the blood metabolome to subsequent carcass traits at slaughter in feedlot Wagyu crossbred steers. Scientific Reports 9, 15139.
| Crossref | Google Scholar | PubMed |
Goddard ME, Hayes BJ (2009) Mapping genes for complex traits in domestic animals and their use in breeding programmes. Nature Reviews Genetics 10, 381-391.
| Crossref | Google Scholar |
Hine BC, Duff CJ, Byrne A, Parnell P, Porto-Neto L, Li Y, Ingham AB, Reverter A (2021) Development of Angus SteerSELECT: a genomic-based tool to identify performance differences of Australian Angus steers during feedlot finishing: Phase 1 validation. Animal Production Science 61, 1884-1892.
| Crossref | Google Scholar |
Johnsson M (2023) Genomics in animal breeding from the perspectives of matrices and molecules. Hereditas 160, 20.
| Crossref | Google Scholar | PubMed |
Karaman E, Su G, Croue I, Lund MS (2021) Genomic prediction using a reference population of multiple pure breeds and admixed individuals. Genetic Selection Evolution 53, 46.
| Crossref | Google Scholar | PubMed |
Karoui S, Carabano MJ, Diaz C, Legarra A (2012) Joint genomic evaluation of French dairy cattle breeds using multiple-trait models. Genetics Selection Evolution 44, 39.
| Crossref | Google Scholar |
Koo Y, Alkhoder H, Choi T-J, Liu Z, Reents R (2023) Genomic evaluation of carcass traits of Korean beef cattle Hanwoo using a single-step marker effect model. Journal of Animal Science 101, skad104.
| Crossref | Google Scholar |
Legarra A, Reverter A (2018) Semi-parametric estimates of population accuracy and bias of predictions of breeding values and future phenotypes using the LR method. Genetics Selection Evolution 50, 53.
| Crossref | Google Scholar |
Mehrban H, Lee DH, Naserkheil M, Moradi MH, Ibáñez-Escriche N (2019) Comparison of conventional BLUP and single-step genomic BLUP evaluations for yearling weight and carcass traits in Hanwoo beef cattle using single trait and multi-trait models. PLoS ONE 14, e0223352.
| Crossref | Google Scholar | PubMed |
Misztal I, Legarra A (2017) Invited review: efficient computation strategies in genomic selection. Animal 11, 731-736.
| Crossref | Google Scholar | PubMed |
Naserkheil M, Lee D-H, Kong H-S, Seong J, Mehrban H (2021) Estimation of genetic parameters and correlation between yearling ultrasound measurements and carcass traits in Hanwoo cattle. Animals 11, 1425.
| Crossref | Google Scholar | PubMed |
Onogi A, Ogino A, Komatsu T, Shoji N, Simizu K, Kurogi K, Yasumori T, Togashi K, Iwata H (2014) Genomic prediction in Japanese Black cattle: application of a single-step approach to beef cattle. Journal of Animal Science 92, 1931-1938.
| Crossref | Google Scholar | PubMed |
Pérez-Enciso M, Misztal I (2011) Qxpak.5: old mixed model solutions for new genomics problems. BMC Bioinformatics 12, 202.
| Crossref | Google Scholar | PubMed |
Porto-Neto LR, Barendse W, Henshall JM, McWilliam SM, Lehnert SA, Reverter A (2015) Genomic correlation: harnessing the benefit of combining two unrelated populations for genomic selection. Genetic Selection Evolution 47, 84.
| Crossref | Google Scholar | PubMed |
Porto-Neto LR, Alexandre PA, Hudson NJ, Bertram J, McWilliam SM, Tan AWL, Fortes MRS, McGowan MR, Hayes BJ, Reverter A (2023) Multi-Breed genomic predictions and functional variants for fertility of tropical bulls. PLoS One 18, e0279398.
| Crossref | Google Scholar | PubMed |
Reverter A, Porto-Neto LR, Fortes MRS, McCulloch R, Lyons RE, Moore S, Nicol D, Henshall J, Lehnert SA (2016) Genomic analyses of tropical beef cattle fertility based on genotyping pools of Brahman cows with unknown pedigree. Journal of Animal Science 94, 4096-4108.
| Crossref | Google Scholar | PubMed |
Reverter A, Dominik S, Ferraz JBS, Corrigan L, Porto-Neto LR (2019) Pedigromics: a network-inspired approach to visualise and analyse pedigree structures. Proceedings of the Association for the Advancement of Animal Breeding and Genetics 23, 540-543 Available at https://www.cabdirect.org/cabdirect/abstract/20203356360.
| Google Scholar |
Reverter A, Hudson NJ, McWilliam S, Alexandre PA, Li Y, Barlow R, Welti N, Daetwyler H, Porto-Neto LR, Dominik S (2020) A low-density SNP genotyping panel for the accurate prediction of cattle breeds. Journal of Animal Science 98, skaa337.
| Crossref | Google Scholar |
Reverter A, Hine BC, Porto-Neto L, Alexandre PA, Li Y, Duff CJ, Dominik S, Ingham AB (2021) ImmuneDEX: updated genomic estimates of genetic parameters and breeding values for Australian Angus cattle. Animal Production Science 61, 1919-1924.
| Crossref | Google Scholar |
Reverter A, Porto-Neto L, Hine BC, Alexandre PA, Samaraweera M, Byrne AI, Ingham AB, Duff CF (2023) On the value of adding commercial data into the reference population of the Angus SteerSELECT genomic tool. Animal Production Science 63, 947-956.
| Crossref | Google Scholar |
Rostamzadeh Mahdabi E, Tian R, Li Y, Wang X, Zhao M, Li H, Yang D, Zhang H, Li SF, Esmailizadeh A (2023) Genomic heritability and correlation between carcass traits in Japanese Black cattle evaluated under different ceilings of relatedness among individuals. Frontiers in Genetics 14, 1053291.
| Crossref | Google Scholar |
Ríos Utrera A, Van Vleck LD (2004) Heritability estimates for carcass traits of cattle: a review. Genetics and Molecular Research 30, 380-394.
| Google Scholar |
Somavilla AL, Regitano LCA, Rosa GJM, Mokry FB, Mudadu MA, Tizioto PC, Oliveira PSN, Souza MM, Coutinho LL, Munari DP (2017) Genome-enabled prediction of breeding values for feedlot average daily weight gain in Nelore cattle. G3 Genes|Genomes|Genetics 7, 1855-1859.
| Crossref | Google Scholar | PubMed |
Takeda M, Inoue K, Oyama H, Uchiyama K, Yoshinari K, Sasago N, Kojima T, Kashima M, Suzuki H, Kamata T, Kumagai M, Takasugi W, Aonuma T, Soma Y, Konno S, Saito T, Ishida M, Muraki E, Inoue Y, Takayama M, Nariai S, Hideshima R, Nakamura R, Nishikawa S, Kobayashi H, Shibata E, Yamamoto K, Yoshimura K, Matsuda H, Inoue T, Fujita A, Terayama S, Inoue K, Morita S, Nakashima R, Suezawa R, Hanamure T, Zoda A, Uemoto Y (2021) Exploring the size of reference population for expected accuracy of genomic prediction using simulated and real data in Japanese Black cattle. BMC Genomics 22, 799.
| Crossref | Google Scholar | PubMed |
Torres-Vázquez JA, van der Werf JHJ, Clark SA (2018) Genetic and phenotypic associations of feed efficiency with growth and carcass traits in Australian Angus cattle. Journal of Animal Science 96, 4521-4531.
| Crossref | Google Scholar | PubMed |
van Grevenhof IEM, van der Werf JHJ (2015) Design of reference populations for genomic selection in crossbreeding programs. Genetic Selection Evolution 47, 14.
| Crossref | Google Scholar |
VanRaden PM (2008) Efficient methods to compute genomic predictions. Journal of Dairy Science 91, 4414-4423.
| Crossref | Google Scholar | PubMed |
Vázquez-Mosquera JM, de Mercado E, Fernández-Novo A, Gardón JC, Pesántez-Pacheco JL, Pérez-Solana ML, Revilla-Ruiz Á, Martínez D, Villagrá A, Sebastián F, Pérez-Garnelo SS, Astiz S (2022) Comparison of pure and crossbred Japanese black steers in growth performance and metabolic features from birth to slaughter at a Spanish fattening farm. Animals 12, 1671.
| Crossref | Google Scholar | PubMed |
Yonesaka R, Sasazaki S, Yasue H, Niwata S, Inayoshi Y, Mukai F, Mannen H (2016) Genetic structure and relationships of 16 Asian and European cattle populations using DigiTag2 assay. Animal Science Journal 87, 190-196.
| Crossref | Google Scholar |