

Brahman and Brahman crossbred cattle grown on pasture and in feedlots in subtropical and temperate Australia. 3. Feed efficiency and feeding behaviour of feedlot-finished animals
K. M. Schutt A B D E , P. F. Arthur A C and H. M. Burrow AA Cooperative Research Centre for Beef Genetic Technologies, C.J. Hawkins Homestead, University of New England, Armidale, NSW 2351, Australia.
B CSIRO Livestock Industries, PO Box 5545, Rockhampton Mail Centre, Qld 4702, Australia.
C NSW Department of Primary Industries, Elizabeth Macarthur Agricultural Institute, Camden, NSW 2570, Australia.
D Present address: ‘Ingaby Station’, St George, Qld 4487, Australia.
E Corresponding author. Email: sk_prewett@activ8.net.au
Animal Production Science 49(6) 452-460 https://doi.org/10.1071/EA08083
Submitted: 3 May 2008 Accepted: 18 February 2009 Published: 13 May 2009
Abstract
The objective of this experiment was to quantify differences in feed efficiency and feeding behaviour of 470 heifers and steers by Brahman, Belmont Red, Santa Gertrudis, Angus, Hereford, Shorthorn, Charolais and Limousin sires mated to Brahman dams. Animals were bred in subtropical Queensland and finished in a temperate New South Wales feedlot. Animals averaged 598 days of age and 425.8 kg at the start of the feed intake test period. Sire breeds did not differ for eating rate, feed conversion ratio or relative growth rate. Generally, higher daily feed intakes (DFI) corresponded with higher average daily gains (ADG). Straightbred Brahmans fed the most frequently (16.6 ± 0.8 sessions/day; P < 0.05) but spent the least time eating of all breeds (67.4 ± 2.7 min/day; P < 0.001). Least squares means for Brahman, Belmont Red, Santa Gertrudis, Angus, Hereford, Shorthorn, Charolais and Limousin sired progeny, respectively, for residual feed intake (RFI; P < 0.05) were 0.02 ± 0.16, 0.14 ± 0.13, –0.10 ± 0.23, 0.54 ± 0.17, –0.27 ± 0.18, 0.29 ± 0.18, –0.46 ± 0.16 and –0.21 ± 0.13 kg/day, and for ADG (P < 0.001) were 1.06 ± 0.05, 1.17 ± 0.04, 1.52 ± 0.08, 1.47 ± 0.06, 1.46 ± 0.06, 1.46 ± 0.06, 1.35 ± 0.06 and 1.38 ± 0.05 kg/day. While straightbred Brahmans did not differ from all other sire breeds for RFI, their lower appetite relative to crossbred contemporaries resulted in the lowest DFI (P < 0.001) and lowest ADG (P < 0.001) overall. Angus sired crosses were the least efficient feeders and spent the most time eating, consumed the most feed and had the highest RFI, but were not significantly different to Santa Gertrudis and Shorthorn crosses for these traits. Angus sired crosses spent 24.1 and 15.4 min/day more time eating (P < 0.001) than straightbred Brahmans and Charolais crosses, and consumed 35 and 13% more feed (P < 0.001) respectively. Charolais sired crosses were the most feed efficient with the lowest RFI and intermediate DFI, and did not differ significantly from the highest ranking sire breeds for ADG or Kleiber ratio. While Belmont Red crosses did not differ from all breeds for RFI, they had significantly lower DFI than British and Santa Gertrudis crosses resulting in lower ADG (P < 0.001) relative to these sire breeds. Therefore, selection of Charolais, Hereford, Limousin and Santa Gertrudis sire breeds would result in the most feed efficient (low RFI) crosses with Brahman without any sacrifice in ADG.
Introduction
A percentage of Brahman content in northern Australian breeding herds is essential for adaptation and survival in subtropical and grassland extensive grazing environments. More than 50% of the national herd is estimated to have some Brahman genes (Bindon 2002). Of the total 666 000 head of cattle in Australian feedlots in March 2004, Queensland held nearly half of these (Australian Bureau of Statistics 2005). Feedlot finishing of Brahman crossbred cattle in subtropical environments has been shown to improve carcass and meat quality attributes, including objective and sensory tenderness, and decrease age at slaughter by 7 months relative to pasture finishing (Schutt et al. 2009a, 2009b). With markets demanding a reliable supply of beef of consistently high eating quality, feedlot finishing is becoming standard practice in northern beef production systems targeting domestic and premium export markets. However, straightbred Brahman cattle have a reputation for poorer growth in feedlots relative to other breeds and crossbreds and this has been attributed to breed differences in feed intake and feed utilisation.
The literature generally agrees that genetic variation in feed efficiency exists (review by Archer et al. 1999). These variations in feed efficiency potentially represent an opportunity for beef producers to significantly reduce production costs by reducing feed intake while maintaining growth rate. A study by Richardson et al. (1998) found high efficiency steers [low residual feed intake (RFI)] grew as fast as or faster than low efficiency steers but ate less feed per unit gain. However, RFI has been reported to have high genetic correlations with rump and rib fat and intramuscular fat percentage (0.72, 0.48 and 0.22 adjusted for age; Robinson and Oddy 2004). Therefore, selection of breeds or sires within breed for lower RFI may lead to a consequent decrease in carcass fatness, which may also have implications for female fertility (review by Pitchford 2000). Further, selection for RFI may produce changes in the calpain system, which may consequently affect meat tenderness (McDonagh et al. 2001). Other studies report only small positive correlations between RFI or feed conversion ratio (FCR) and fatness (Arthur et al. 2001; Richardson et al. 2001). Though antagonistic correlations between slaughter and breeding herds may be overcome through use of economic selection indices, development of feed efficiency estimated breeding values (EBV) is still in its early stages and measurement of individual feed intake remains expensive. Hence, selection of breeds that have high feed efficiency (low RFI) for the same level of gain as low efficiency breeds, coupled with crossbreeding, may overcome some of the problems associated with within-breed selection.
Evidence from the literature indicates that both genetic and environmental factors affect the way in which nutrients are used by beef cattle. A review by Ferrell and Jenkins (1985) suggested 70–75% of total annual energy requirements are required for maintenance functions. A review by Arthur (2000) concluded that differences in efficiency of maintenance exist between breeds, and these differences are correlated with differences in productive potential of breeds. Efficiency of feed utilisation has several variable components including feed intake, digestion of feed, metabolism (including variation in body composition), activity and thermoregulation (reviews by Archer et al. 1999; Herd et al. 2004). Early research on tropically adapted genotypes (Vercoe 1967, 1970; Frisch and Vercoe 1969, 1977; Vercoe et al. 1972) shows there are differences in feed intake, eating rate, weight gain, metabolic rate and efficiency of feed utilisation between breeds and across different environments. However, those early studies were based on low numbers of animals and did not include representatives of the large Continental breeds that have since been imported to Australia. Studies by Cundiff et al. (1984), Huffman et al. (1990) and Ferrell et al. (2006) examined Bos taurus × Bos indicus cattle relative to their B. taurus contemporaries, and Robinson and Oddy (2004) reported feed efficiency of tropically adapted breeds relative to temperate breeds. However, there is a deficiency in research examining feed efficiency of B. indicus breeds and their crossbreeds. Quantifying the efficiency of feed utilisation of B. indicus relative to B. taurus × B. indicus is the next step in improving production efficiency and economic profitability for northern Australian beef producers and the feedlot sector. The objective of this experiment was to quantify differences in feed efficiency and feeding behaviour of straightbred Brahmans v. Brahman crossbreds finished to Australia’s two main premium beef export markets.
Materials and methods
Experimental design and animals
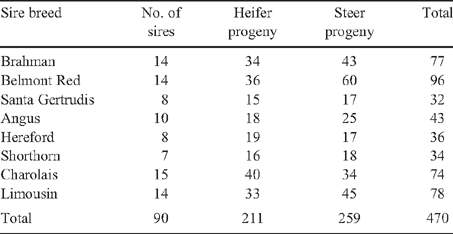
Full details of the experimental design, measurements and data storage for the Cooperative Research Centre for Cattle and Beef Industry (Meat Quality) (Beef CRC) Northern Crossbreeding Program were described by Upton et al. (2001). Briefly, eight sire breeds including Brahman (purebred control), Santa Gertrudis, Belmont Red, Angus, Hereford, Shorthorn, Charolais and Limousin were mated naturally and by artificial insemination (AI) to 1000 Brahman females over 3 years to produce 1750 Brahman and first-cross progeny at two properties in subtropical central Queensland. The optimal number of sires, offspring per sire and number of link sires between herds and allocation of animals to treatment combinations were described by Robinson (1995). This study was based on a subset of animals from the Northern Crossbreeding Program. Table 1 shows the number of sires per breed and the number and sex of progeny per sire breed analysed for feed efficiency after data edits were applied.
|
Calves were weaned in 1996, 1997 and 1998 at about 6 months of age. Following weaning, one-third of the calves were grown out on temperate pastures at Glen Innes Research Station (native and introduced pastures, described by Ayres et al. 2001) or ‘Tullimba’ Beef Research Facility (native wallaby grass, Austrodanthonia spp.) in north-eastern New South Wales to the 400 kg feedlot entry weight for Korean and Japanese markets (n = 511). A cohort was defined by a combination of sex, market endpoint and year of birth. All animals within a cohort were managed as a single group during grow-out and finish. Calves were fed in ‘Tullimba’ feedlot for an average of 112 and 164 days to carcass weights of 288 ± 1 and 327 ± 2 kg for the Korean and Japanese markets respectively.
Data edits
During the period in the feedlot, individual feed intakes of a standard finisher ration [minimum 11.8 MJ metabolisable energy (ME)/kg with a minimum of 150 g crude protein per kg dry matter (DM)] offered ad libitum were recorded using automatic individual feed intake recorders. The automatic feed intake recorders at ‘Tullimba’ are described by Bindon (2001). Because the ME of the feed ranged between 11.8 and 12.4 MJ ME/kg DM in finishing rations for the different cohorts, all feed intake records were adjusted to 12 MJ ME/kg DM. All animals were given a minimum 21-day introductory period to the feedlot rations, followed by a 7-day adjustment period during which time they learned to use the automatic feeders. Only those animals that adapted well to the grain-based diets and learned to use the automatic feeders efficiently were used in the analyses. Animals fed for less than 48 days in the automatic feeders, due to sickness or shy feeding, were excluded from the analysis (n = 35).
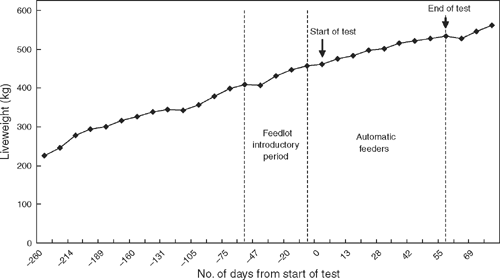
In order to accurately measure feed efficiency, a test length of no less than 35 days is recommended for collection of feed intake data (Archer et al. 1997; Wang et al. 2006). A test period of 70 days (including fortnightly weighing) is recommended for accurate measurement of growth rate, feed conversion and RFI (Archer et al. 1997), though Wang et al. (2006) reported test durations for average daily gain (ADG) and RFI could be shortened to 63 days and FCR to 42 days without significantly reducing test accuracy. Due to the 21-day introductory period to the feedlot rations, the adjustment period in the automatic feeder pens, limited capacity in the automatic feeder pens, and market constraints on final liveweight and total days on grain, it was not possible to measure feed intake on all animals for the recommended 70 days plus the adjustment period (Robinson 2000). A compromise was based on a study of 1165 straightbred temperate and tropical breed animals at ‘Tullimba’, which reported feed intake measurements were reasonably repeatable (Robinson 2000). Hence, individual feed intakes were recorded for an average of 60 and 61 days for Korean and Japanese market animals, including the adjustment period in the automatic feeders. Growth curves, including liveweights before feedlot entry through to slaughter, indicated linear growth for the cohorts (Fig. 1 shows a typical cohort growth curve). Weights were measured at 7-day intervals from entry to the automatic feeder pens. Given diet remained constant and growth checks were limited to 7 days upon entering the automatic feeder pens, daily feed intakes were excluded for the first 7 days in the automatic feeders rather than the standard 21-day protocol. Analyses using a 14-day adjustment period to the automatic feeder pens yielded consistent sire breed rankings and significance to results for the 7-day adjustment period. It was concluded that a longer period on test would present more accurate results (53 v. 46 days for 7- v. 14-day adjustment periods respectively). Results from the 7-day adjustment period are presented in this paper.
|
Each trait was examined for outliers. Outliers were defined as data points that fell more than three standard deviations from the mean for each trait. Individual feed intake sessions (n1), feed intake for an animal for 1 day of the test period (n2), or all feed intake records for an animal over the duration of the study (n3) were only excluded from the analysis if there appeared to be measurement error. Individual feed intake sessions were excluded from the analysis when they exceeded both thresholds of being less than 0.876 kg of feed consumed at one feeding session and time taken to eat 1 kg of feed (eating rate) was more than 16.197 min (n1 = 43). This mainly included records where animals spent a long time standing inside the feeders without the primary purpose of feeding. Feed intake records from individual visits to the feed bunks were also excluded if there were problems with the feed recorders on particular days and the quality of the feed intake records were compromised (n2). Animals that had average daily gain less than 0.3 kg/day were checked individually for daily feed intake and feeding behaviour over the duration of the test for evidence of illness or feeding problems. In all cases, low average daily gain was due to low feed intake throughout the test period, likely due to lower appetite relative to contemporaries. These animals remained in the analysis. Six outliers (n3) for FCR were excluded because they fell more than three standard deviations from the mean (FCR less than –24.4 or greater than 45.8) causing a distortion of the results. The FCR outliers excluded from the analyses were 6 of the 19 animals with an average daily gain less than 0.3 kg/day. Consequently, the feed efficiency analyses included 365 295 individual feed intake sessions (n1) and 24 894 individual feed intake days (n2) from 470 animals (n3) recorded for feed intake over the duration of the study.
Statistical analyses
The feed efficiency traits analysed in this study and their definitions are described in Table 2. Liveweights and daily feed intake (DFI) were used to calculate average daily gain (ADG) by regression, FCR, RFI by regression, Kleiber ratio (KR) and relative growth rate (RGR). ADG was calculated as the regression of liveweight on time (days) for start, interim and end weights using the REG procedure of SAS (SAS 2000). RFI was calculated as DFI less expected DFI (expFI), where expFI was obtained by the regression of DFI on average test period liveweight (MWT) to the 0.75 power and ADG. RFI was calculated within sex using the GLM procedure of SAS (SAS 2000). Year of birth was fitted as a class variable. RGR expressed as the percentage of weight change per day was also calculated (Fitzhugh and Taylor 1971). The Australian standard of 70 days on test was used to calculate end of test weight and RGR. Feeding behaviour traits including time spent eating per day (TIME), time to eat 1 kg of feed (eating rate) and number of feeding sessions per day (SESS) were also assessed.

|
Least squares means for breed effects were estimated using the GLM procedure of SAS (SAS 2000). Fixed effects in the model included sire breed and a concatenated variable including sex, market, year of birth and herd of origin. Sire nested within breed was fitted as a random effect and was also used as the error term. Age at the start of the test period (STAGE) and weight at the start of the test period (STWT) were fitted as covariates for all traits in separate analyses, with the exception of RFI with STWT. An unadjusted analysis was run for all feed efficiency traits as well as STAGE, STWT and metabolic mid-weight (MMWT). There was little change in the magnitude of least squares means, significance or breed rankings between the two covariates and unadjusted analyses. However, R-square values were higher for all traits when STWT was fitted as the covariate. The multiple range test devised by Duncan (1955) and extended by Kramer (1957) was used to test for significant differences between means.
The model used to analyse STAGE, STWT, MMWT, DFI, expFI, RFI, ADG, FCR, KR, RGR, eating rate, TIME and SESS (unadjusted) was:
yijkl = μ + breedj + otherFEk + sirel(j) + ॉijkl (1)
where yijkl is the observation for a dependent variable for animal i, μ is the overall mean, breedj is the effect of the jth sire breed, otherFEk is the effect of the kth group that accounts for all other fixed effects concatenated into one variable (sex || market || year of birth || herd of origin), sirel(j) is the random effect of the lth sire nested within the jth breed, and ॉijkl is the residual error term.
The model used to analyse DFI, expFI, ADG, FCR, KR, RGR, eating rate, TIME and SESS adjusted to a common starting weight was:
yijkl = μ + breedj + otherFEk + sirel(j) + b1STWTijkl + ॉijkl (2)
where yijkl is the observation for a dependent variable for animal i, μ is the overall mean, breedj is the effect of the jth sire breed, otherFEk is the effect of the kth group that accounts for all other fixed effects concatenated into one variable (sex || market || year of birth || herd of origin), sirel(j) is the random effect of the lth sire nested within the jth breed, STWTijkl is the linear effect of the weight of the animal at the start of the feed intake test fitted as a covariate, and ॉijkl is the residual error term.
The model used to analyse DFI, expFI, RFI, ADG, FCR, KR, RGR, eating rate, TIME and SESS adjusted to a common starting age was:
yijkl = μ + breedj + otherFEk + sirel(j) + b1STAGEijkl + ॉijkl (3)
where yijkl is the observation for a dependent variable for animal i, μ is the overall mean, breedj is the effect of the jth sire breed, otherFEk is the effect of the kth group that accounts for all other fixed effects concatenated into one variable (sex || market || year of birth || herd of origin), sirel(j) is the random effect of the lth sire nested within the jth breed, STAGEijkl is the linear effect of age of the animal at the start of the feed intake test fitted as a covariate, and ॉijkl is the residual error term.
Results
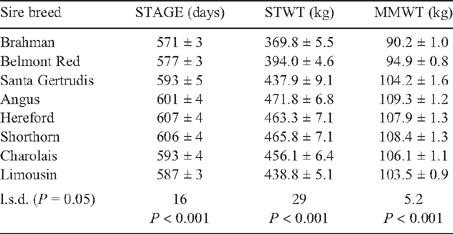
Animals averaged 598 days of age and 425.8 kg at the start of the feed intake test period. Sire breed effects on STAGE, STWT and MMWT are presented in Table 3. Straightbred Brahmans were youngest but did not differ in age to Belmont Red- or Limousin-sired crosses, which did not differ in age to Santa Gertrudis or Charolais crosses. British crosses were the oldest at the start of test as a result of all being conceived by AI. Straightbred Brahman and Belmont Red crosses were significantly lighter than all other crosses at the start of the test.
|
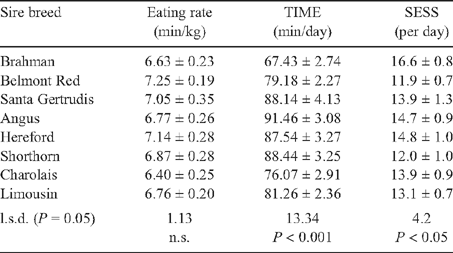
There were few differences in breed rankings and significance between unadjusted, age-constant and weight-constant results. Age-constant results are presented in Tables 4 and 5. There was no difference between sire breeds for FCR, RGR and eating rate. Angus sired crosses were the least efficient feeders and spent the most time eating, consumed the most feed and had the highest RFI. Angus sired crosses spent 24.1 and 15.4 min/day (P < 0.001) more time eating than straightbred Brahmans and Charolais crosses, and consumed 35 and 13% (P < 0.001) more feed respectively. Straightbred Brahmans did not differ significantly from all breed crosses for RFI, but had the lowest appetite, which resulted in the lowest DFI, TIME and ADG (P < 0.001). Straightbred Brahmans were the most frequent feeders but only differed to Belmont Red and Shorthorn sired crosses for SESS (P < 0.05). Aside from SESS, straightbred Brahmans did not differ significantly from Belmont Red crosses for any trait. Belmont Red crosses did not differ significantly from Continental crosses for DFI and ADG, and did not differ significantly from all other crosses for eating rate, TIME, SESS, RFI, FCR, RGR and KR (except Santa Gertrudis crosses). Santa Gertrudis crosses performed similarly to British crossbreds for all traits. British and Santa Gertrudis crosses had the highest DFI but did not differ significantly to Continental breed crosses for eating rate, SESS, FCR, ADG, KR and RGR. Charolais crosses differed from Angus and Shorthorn crosses for RFI (P < 0.05). Charolais crosses were the most feed efficient with the lowest RFI and intermediate DFI, and did not differ significantly from the highest ranking sire breeds for ADG, FCR, KR and RGR.

|
|
Discussion
Sire breed differences for feed efficiency
Studies examining breed differences for feed efficiency are few, particularly for B. indicus v. B. indicus × B. taurus crosses. Historically, the high cost and logistics of reliably measuring individual feed intakes in commercial feedlot-type environments has been prohibitive. Hence, there are limited studies that include RFI with which to make comparisons. Moore et al. (2005) reported ADG, DFI, FCR and RFI on this crossbred dataset but had differing results based on alternative methods of trait calculation and data editing. Their study excluded animals with ADG less than 0.5 kg/day and DFI less than 300 g/day, did not allow for an adjustment period in the automatic feeders, and did not adjust for differences in MJ ME/kg DM between cohorts. The importance of an adjustment period in the automatic feeders before the on-test period is discussed by Robinson (2000). Preliminary analyses from our study that excluded an adjustment period for the automatic feeders showed respective traits held relatively stable for sire breed ranking between unadjusted and adjusted analyses, but not for magnitude and significant differences between sire breeds. In contrast to the results of Moore et al. (2005), this study found no difference between Belmont Red and Continental crosses for ADG and DFI. Furthermore, Moore et al. (2005) ranked straightbred Brahmans lowest for RFI (–0.61) and significantly different to Angus, Shorthorn and Belmont Red crosses, whereas our results ranked straightbred Brahmans intermediately for RFI (0.02) and not significantly different to all other breed crosses. The different results for straightbred Brahmans were likely due to the fact that Brahmans had relatively low DFI and ADG due to low appetite (apparent by examination of their feed intake records over the test period) rather than feeding problems, and hence were excluded from the Moore et al. (2005) study unnecessarily.
Studies between B. taurus and B. taurus × B. indicus crosses, though not strictly comparable, show breed trends for feed efficiency that generally support our findings. Huffman et al. (1990) found no significant difference between 25, 50 and 75% Brahman × Angus crossbred steers for ADG, feed : gain ratio or empty rumen feed : gain ratio when finished for 107 days on feed to similar end weights as our crossbreds, whereas the 50 and 75% Brahman content steers did not differ significantly for daily DM intake and empty rumen ADG. This is consistent with our results for Brahman × British breed crosses (including Santa Gertrudis crosses) for DFI, ADG and FCR. Frisch and Vercoe (1977) reported that feed intake per kg liveweight was consistently and significantly highest for Hereford × Shorthorn (HS) relative to Africander × HS and Brahman × HS when fed ad libitum lucerne, which is consistent with our DFI findings for British crosses relative to Belmont Red crosses and straightbred Brahmans. Cundiff et al. (1984) reported the ADG of Brahman sired crosses from Angus and Hereford cows tended to be lower during the postweaning period while being fed a high concentrate diet relative to Angus or Hereford sired calves, which is consistent with our ADG results for Brahmans relative to British and Santa Gertrudis sired calves, though our crosses were older and heavier on test. Similarly to Moore et al. (2005) and a study by Fan et al. (1995), we found progeny of Hereford sires had lower RFI than Angus sired calves. However, our study did not find higher RFI was associated with higher ADG of the Angus sires relative to the Hereford sires, as reported by Fan et al. (1995). Similarly to our results for FCR, Cundiff et al. (1984) and Fan et al. (1995) reported no difference between breed groups for gross feed efficiency.
A study including feed efficiency and feeding behaviour of tropically adapted (Brahman, Belmont Red, Santa Gertrudis) and temperate (Angus, Hereford, Murray Grey, Shorthorn) straightbreds finished to three market weights under the same experimental protocols as this experiment was reported by Robinson and Oddy (2004). Relative to our means for respective markets and traits, Robinson and Oddy (2004) reported similar mean DFI (11.9 ± 2.0 kg/day) and FCR (9.8 ± 2.1) and lower mean MMWT (93.9 ± 8.8 kg) and ADG (1.27 ± 0.32 kg/day) for tropically adapted straightbreds, which were older than our crossbreds at the start of test (mean 717 ± 80 days). Hence, despite little difference in DFI, tropically adapted straightbreds had similar FCR and lower ADG relative to Brahman crossbreds in this experiment. Relative to temperate straightbreds, tropically adapted straightbreds had lower DFI (1.0 kg; 7.8%), lower MMWT (4.1 kg; 4.2%), lower ADG (0.06 kg/day; 4.5%), higher RFI (0.11; 3.9%) and lower FCR (0.4; 3.9%) for Korean and Japanese markets. Our results were consistent in direction for DFI, MMWT and ADG for British crossbreds v. tropically adapted crossbreds; however, the trend was the reverse for RFI and FCR whereby our tropically adapted sire breeds had lower RFI (more desirable) and higher FCR (less desirable; n.s.) than British sire breeds.
A study by Robinson et al. (1997) of Angus, Shorthorn, Hereford, Murray Grey, Santa Gertrudis and Brahman steers finished to Korean and Japanese weights reported that B. indicus animals with higher feed intake gained weight faster in the feedlot. This was consistent with our results for Brahman, Belmont Red and Santa Gertrudis sired crosses for DFI and ADG. However, this trend did not follow for Angus sired crosses (highest DFI) relative to significantly lower DFI breeds (Charolais and Limousin crosses) in our experiment where these sire breeds did not differ for ADG. Schenkel et al. (2004) reported similar breed rankings for young Charolais, Limousin, Hereford and Angus beef bulls for RFI (by regression) relative to our results, though Charolais crosses had lower RFI than Limousin crosses in our study. Similarly to Schenkel et al. (2004), we found Charolais and Limousin crosses had lower DFI than Angus crosses. In contrast, we found no difference between the four respective sire breeds for ADG or FCR.
Sire breed differences for feeding behaviour
Relative to our means for respective markets and traits, Robinson and Oddy (2004) reported slightly higher TIME (84 ± 23 min) and SESS (15.6 ± 7.9) for the tropically adapted straightbreds (Brahman, Belmont Red and Santa Gertrudis). Despite no difference in feed intake, tropically adapted straightbreds in the Robinson and Oddy (2004) experiment spent more time eating and had more SESS than Brahmans and Brahman crossbreds in this experiment. More frequent but shorter feeding sessions for straightbred Brahmans in this study were consistent with studies by Robinson et al. (1997) and Robinson and Oddy (2004), but we found no in difference in SESS between Brahmans and British, Continental and Santa Gertrudis crosses, except Shorthorn crosses. Further, in contrast to results reported by Robinson and Oddy (2004), we found no difference in eating rate between sire breeds, possibly a result of the 50% or greater Brahman content of our crosses resulting in smaller differences between sire breeds relative to tropically adapted straightbreeds. A study of HS, Brahman × HS and Africander × HS found eating rate was highly correlated with liveweight (Frisch and Vercoe 1977), though differences between breeds were not significant. Similarly, we found no difference between sire breeds for eating rate.
Mechanisms affecting variation in feed efficiency
Within-breed selection of animals that eat less for the same liveweight and weight gain has led to the conclusion there is genetic variation in the utilisation of feed. This biological difference in efficiency of feed utilisation has been credited to variation in feed intake, digestion of feed, tissue turnover, metabolism (anabolism and catabolism associated with and including variation in body composition), activity, feeding patterns and thermoregulation (Richardson et al. 1999; Oddy and Herd 2000; Herd et al. 2004; Richardson and Herd 2004). Given that selection for weight gain or for RFI is associated with variation in intake, animals that eat less for the same performance could be expected to have lower heat production based on the heat increment of feeding (Oddy and Herd 2000). What is clear is that no single mechanism is likely to be primarily responsible for differences in feed efficiency (Oddy and Herd 2000; Richardson and Herd 2004), and for breeds where the differences are small, the actual magnitude of difference in each mechanism affecting feed efficiency will be small and difficult to measure with certainty (Herd et al. 2004).
Bos indicus have a faster fermentation rate, shorter digesta retention time and higher population of rumen protozoa (expected to support greater methane emissions), but have greater efficiency of energy capture relative to B. taurus (Hegarty 2000). Studies by Vercoe (1967) and Vercoe et al. (1972) reported DM and nitrogen digestibilities were consistently higher in Brahman × Hereford and Brahman × HS steers relative to Hereford and HS steers; however, breed differences were not significant on low quality diets. Conversely, Boyles (1986) found Brahman × Angus crosses had higher faecal DM content than Angus steers, though digestibility coefficients were similar for two breed groups and there were no significant breed effects on heat production and respiratory rate. Frisch and Vercoe (1969) reported that lower feed intakes in Brahmans relative to Africanders and Shorthorn × Herefords (weight adjusted) fed ad libitum lucerne was likely due to lower maintenance requirements in the Brahmans. Another study by Vercoe (1970) suggested the lower fasting metabolism of Brahmans relative to Africander and HS bulls aged 13–22 months (P < 0.05) may have been due to a lower requirement for energy to carry out functions of basal metabolism, or if they had similar requirements, Brahmans may have been able to use the energy released by biochemical processes occurring at basal conditions more efficiently. Therefore, it appears that B. indicus cattle require lower feed intake relative to B. taurus genotypes in order to meet maintenance requirements. Frisch and Vercoe (1977) concluded that as B. indicus evolved under poor nutrition they will have automatically been selected for low fasting metabolism (good survival ability) and low voluntary feed intake, resulting in low growth rates under good conditions relative to B. taurus breeds. This would apply to our study. Despite no differences between straightbred Brahmans and all crossbreds for RFI and FCR, straightbred Brahmans had lower ADG as a result of lower DFI due to lower appetite.
Implications to breed selection for feed efficiency
Sire breed differences exist for feed efficiency and feeding behaviour. Generally, increased DFI corresponds with increased ADG; however, Continental breed crosses tend to utilise feed more efficiently than British breed crosses. While use of straightbred Brahmans in northern Australia holds no disadvantage for RFI or FCR relative to Brahman crossbreds, the inherently lower appetite of straightbred Brahman cattle results in significantly lower ADG relative to other sire breeds. Similarly, low DFI in Belmont Red crossbreds results in low ADG relative to British and Santa Gertrudis crossbreds. Selection of Charolais, Hereford, Limousin or Santa Gertrudis sire breeds would yield the most feed efficient (low RFI) crosses with Brahman without any sacrifice in ADG in temperate feedlot environments.
Efficiency of beef production depends on feed and other inputs of all classes of animals in the production system including the breeding herd and slaughter generation. Single trait selection for feed efficiency may in fact be detrimental to carcass quality or meat tenderness in the slaughter generation, or reproduction or maintenance requirements of the breeding herd. Therefore, both within- and between- breed selection needs to take into consideration economically important production and reproductive traits. The advantage of between-breed selection for crossbreeding is that many of the antagonistic genetic correlations between RFI and other production or reproduction traits that exist within breeds may be avoided. Crossbreeding may also yield advantages in growth rate due to heterosis effects. Furthermore, crossbreeding allows complementary blending of production, reproduction and adaptation traits essential for economic efficiency and profitability of beef production in northern Australia.
Acknowledgements
The authors gratefully acknowledge the significant efforts of all Beef CRC staff involved in breeding and managing the experimental animals, field data collection at ‘Duckponds’, ‘Goonoo’, ‘Tullimba’ and ‘McMaster’, collation of project data and maintenance of the CRC database. The following donors of Brahman breeding cows for use in the project are also gratefully acknowledged: Hillgrove Pastoral Co., Australian Agricultural Co., North Australian Pastoral Co., Stanbroke Pastoral Co., Queensland and Northern Territory Pastoral Co., Consolidated Pastoral Co., Heytesbury Pastoral Co., Peter Hughes and Acton Land and Cattle Co. Generous funding for the project was provided by Meat and Livestock Australia through Project NAP.3.104.
Archer JA,
Arthur PF,
Herd RM,
Parnell PF, Pitchford WS
(1997) Optimum postweaning test for measurement of growth rate, feed intake, and feed efficiency in British breed cattle. Journal of Animal Science 75, 2024–2032.
|
CAS |
PubMed |
[Verified 12 March 2009]
Ayres JF,
Dicker RW,
McPhee MJ,
Turner AD,
Murison RD, Kamphorst PG
(2001) Post-weaning growth of cattle in northern New South Wales. 1. Grazing value of temperate perennial pasture grazed by cattle. Australian Journal of Experimental Agriculture 41, 959–969.
| Crossref | GoogleScholarGoogle Scholar |

Bindon BM
(2001) Genesis of the Cooperative Research Centre for the Cattle and Beef Industry: integration of resources for beef quality research (1993–2000). Australian Journal of Experimental Agriculture 41, 843–853.
| Crossref | GoogleScholarGoogle Scholar |
Cundiff LV,
Koch RM, Gregory KE
(1984) Characterisation of biological types of cattle (Cycle III). IV. Postweaning growth and feed efficiency. Journal of Animal Science 58, 312–323.
|
CAS |
PubMed |
Duncan DB
(1955) Multiple range test and multiple F test. Biometrics 11, 1–42.
| Crossref | GoogleScholarGoogle Scholar |
Fan LQ,
Bailey DRC, Shannon NH
(1995) Genetic parameter estimation of postweaning gain, feed intake, and feed efficiency for Hereford and Angus bulls fed two different diets. Journal of Animal Science 73, 365–372.
|
CAS |
PubMed |
Ferrell CL, Jenkins TG
(1985) Cow type and the nutritional environment: nutritional aspects. Journal of Animal Science 61, 725–741.
|
CAS |
PubMed |
Ferrell CL,
Berry ED,
Freetly HC, Miller DN
(2006) Influence of genotype and diet on steer performance, manure odor, and carriage of pathogenic and other fecal bacteria. I. Animal performance. Journal of Animal Science 84, 2515–2522.
| Crossref | GoogleScholarGoogle Scholar |
CAS |
PubMed |
Fitzhugh HA, Taylor St CS
(1971) Genetic analysis of degree of maturity. Journal of Animal Science 33, 717–725.
| PubMed |
Frisch JE, Vercoe JE
(1969) Liveweight gain, food intake, and eating rate in Brahman, Africander, and Shorthorn × Hereford cattle. Australian Journal of Agricultural Research 20, 1189–1195.
Frisch JE, Vercoe JE
(1977) Food intake, eating rate, weight gains, metabolic rate and efficiency of feed utilisation in Bos taurus and Bos indicus crossbred cattle. Animal Production 25, 343–358.
Herd RM,
Oddy VH, Richardson EC
(2004) Biological basis for variation in residual feed intake in beef cattle. 1. Review of potential mechanisms. Australian Journal of Experimental Agriculture 44, 423–430.
| Crossref | GoogleScholarGoogle Scholar |
Huffman RD,
Williams SE,
Hargrove DD,
Johnson DD, Marshall TT
(1990) Effects of percentage Brahman and Angus breeding, age-season of feeding and slaughter end point on feedlot performance and carcass characteristics. Journal of Animal Science 68, 2243–2252.
|
CAS |
PubMed |
Kramer CY
(1957) Extension of multiple range tests to group correlated adjusted means. Biometrics 13, 13–18.
| Crossref | GoogleScholarGoogle Scholar |
McDonagh MB,
Herd RM,
Richardson EC,
Oddy VH,
Archer JA, Arthur PF
(2001) Meat quality and the calpain system of feedlot steers following a single generation of divergent selection for residual feed intake. Australian Journal of Experimental Agriculture 41, 1013–1021.
| Crossref | GoogleScholarGoogle Scholar |
CAS |
Moore KL,
Johnston DJ, Burrow HM
(2005) Sire breed differences for net feed intake in feedlot finished beef cattle. Proceedings of the Association for the Advancement of Animal Breeding and Genetics 16, 76–79.
Richardson EC, Herd RM
(2004) Biological basis for variation in residual feed intake in beef cattle. 2. Synthesis of results following divergent selection. Australian Journal of Experimental Agriculture 44, 431–440.
| Crossref | GoogleScholarGoogle Scholar |
Richardson EC,
Herd RM,
Archer JA,
Woodgate RT, Arthur PF
(1998) Steers bred for improved net feed efficiency eat less for the same feedlot performance. Animal Production in Australia 22, 213–216.
Richardson EC,
Herd RM,
Oddy VH,
Woodgate RT,
Archer JA, Arthur PF
(1999) Body composition explains only part of the intake difference between high and low efficiency Angus steers. Recent Advances in Animal Nutrition in Australia 12, 4A.
Richardson EC,
Herd RM,
Oddy VH,
Thompson JM,
Archer JA, Arthur PF
(2001) Body composition and implications for heat production of Angus steer progeny of parents selected for and against residual feed intake. Australian Journal of Experimental Agriculture 41, 1065–1072.
| Crossref | GoogleScholarGoogle Scholar |
Robinson DL
(1995) Design of the CRC straightbred genetics experiments. Proceedings of the Association for the Advancement of Animal Breeding and Genetics 11, 541–545.
Robinson DL, Oddy VH
(2004) Genetic parameters for feed efficiency, fatness, muscle area and feeding behaviour of feedlot finished beef cattle. Livestock Production Science 90, 255–270.
| Crossref | GoogleScholarGoogle Scholar |
Robinson DL,
Skerritt JW, Oddy VH
(1997) Measurement of feed intake and feed efficiency in feedlot cattle. Proceedings of the Association for the Advancement of Animal Breeding and Genetics 12, 287–291.
Schenkel FS,
Miller SP, Wilton JW
(2004) Genetic parameters and breed differences for feed efficiency, growth, and body composition traits of young beef bulls. Canadian Journal of Animal Science 84, 177–185.
Schutt KM,
Burrow HM,
Thompson JM, Bindon BM
(2009a) Brahman and Brahman crossbred cattle grown on pasture and in feedlots in subtropical and temperate Australia. 1. Carcass quality. Animal Production Science 49, 426–438.
| Crossref | GoogleScholarGoogle Scholar |
Schutt KM,
Burrow HM,
Thompson JM, Bindon BM
(2009b) Brahman and Brahman crossbred cattle grown on pasture and in feedlots in subtropical and temperate Australia. 2. Meat quality and palatability. Animal Production Science 49, 439–451.
| Crossref | GoogleScholarGoogle Scholar |
Upton W,
Burrow HM,
Dundon A,
Robinson DL, Farrell EB
(2001) CRC breeding program design, measurements and database: methods that underpin CRC research results. Australian Journal of Experimental Agriculture 41, 943–952.
| Crossref | GoogleScholarGoogle Scholar |
Vercoe JE
(1967) Breed and nutritional effects on the composition of faeces, urine, and plasma from Hereford and Brahman × Hereford steers fed on high and low quality diets. Australian Journal of Agricultural Research 18, 1003–1013.
| Crossref | GoogleScholarGoogle Scholar |
Vercoe JE
(1970) The fasting metabolism of Brahman, Africander and Hereford × Shorthorn cattle. The British Journal of Nutrition 24, 599–606.
| Crossref | GoogleScholarGoogle Scholar |
CAS |
PubMed |
Vercoe JE,
Frisch JE, Moran JB
(1972) Apparent digestibility, nitrogen utilisation, water metabolism and heat tolerance of Brahman cross, Africander cross and Shorthorn × Hereford steers. Journal of Agricultural Science, Cambridge 79, 71–74.
| Crossref |
Wang Z,
Nkrumah JD,
Li C,
Basarab JA,
Goonewardene LA,
Okine EK,
Crews DH, Moore SS
(2006) Test duration for growth, feed intake, and feed efficiency in beef cattle using the GrowSafe System. Journal of Animal Science 84, 2289–2298.
| Crossref | GoogleScholarGoogle Scholar |
CAS |
PubMed |