Economic effects of alternate growth path, time of calving and breed type combinations across southern Australian beef cattle environments: feedlot finishing at the New South Wales experimental site
B. L. Davies A B , A. R. Alford A C and G. R. Griffith A C DA Cooperative Research Centre for Beef Genetic Technologies, University of New England, Armidale, NSW 2351, Australia.
B New South Wales Department of Primary Industries, Paterson, NSW 2421, Australia.
C New South Wales Department of Primary Industries, Armidale, NSW 2351, Australia.
D Corresponding author. Email: garry.griffith@dpi.nsw.gov.au
Animal Production Science 49(6) 535-541 https://doi.org/10.1071/EA08265
Submitted: 29 October 2009 Accepted: 5 February 2009 Published: 13 May 2009
Abstract
The ‘Regional Combinations’ project and its biophysical outcomes have been described in several other papers in this special edition. The information provided in these papers allows an evaluation of the most profitable beef cattle production systems across different environments in southern Australia. In this paper, the focus is on the New South Wales experimental site where the trial animals were finished in a feedlot. The data identified liveweight gain as the biggest driver of profitability of production. Between growth treatments, there was a large difference in the gross margins before feedlot entry between the ‘fast’ and ‘slow’ treatments favouring the fast-grown animals, even after accounting for the higher cost of producing pasture capable of sustaining faster growth. However, the slow growth treatments consistently outperformed the fast growth treatments in the feedlot. In terms of breeds, the European breed types consistently outperformed the Wagyu breeds. There were no time-of-calving experiments in New South Wales.
Introduction
Approximately 35% of Australian beef production is consumed domestically (ABARE 2007). The domestic market is, therefore, still the largest single market destination for Australian beef. The majority of the supply for the domestic market is derived from the higher rainfall areas of southern Australia where turnoff rates and cattle values are higher than for the pastoral regions of northern Australia (ABARE 2008).
Meat quality is becoming increasingly important as an issue for Australian beef producers in meeting more stringent and changing market specifications. The development of the Meat Standards Australia grading system (see for example Polkinghorne et al. 2008a, 2008b, 2008c; Thompson et al. 2008) has shown that domestic consumers are able to discriminate between beef of differing eating qualities, and that they are willing to pay a premium for higher quality beef. Intramuscular fat (IMF) has been shown to be positively correlated with improved eating quality (Egan et al. 2001) and minimum IMF% (as practically assessed by marble score) is now included in some high quality domestic market specifications. Premiums for IMF are now available through some over-the-hooks and contract markets. Therefore, producers now have options to produce cattle with a focus on carcass yield (as measured by retail beef yield – RBY) or IMF, or in some cases, both traits. However, the evidence supporting selection of an optimal growth path is not clear cut.
The ‘Regional Combinations’ project was designed to build on the nutritional and genetic principles affecting the quality of beef production studied in previous research programs by focussing on regional beef production systems at four sites in southern Australia – southern New South Wales (NSW), western Victoria, south-east South Australia and south-west Western Australia. The overall design and methodology was described by McKiernan et al. (2005), although most of the results have been reported in McKiernan et al. (2007) and in several other papers in this special edition.
One of the specific objectives of the project was to examine the regional capability and economics of different combinations of beef cattle genetics, and the growth or nutritional pathways to achieve targeted specifications across various environments in southern Australia. This has been done for each experimental site (Davies et al. 2008).
In this paper, a farm-level modelling system is described that allows an economic evaluation of the experimental results, and the economic outcomes of applying this system at the NSW site are reported. Implications are then drawn for beef cattle producers in the study area.
Materials and methods
As with a previous analysis of cattle experimental work at the Grafton Advisory and Research Station in NSW (Alford et al. 2007), the nature of the experimental protocols imposed in this project resulted in a number of decisions being made that would not be consistent with normal commercial practice. The very poor seasonal conditions during much of the experimental phase necessitated the use of large levels of supplementation of some cow treatment groups to obtain the targeted high nutritional planes. These levels and consequent costs of feed supplements would be obviously uneconomic in commercial beef production terms. Also, because of the experimental protocols, feedlot entry was based on cohort age, not on individual weights as would be used commercially, and slaughter was also based on age rather than a target weight.
Therefore, it was decided not to model the experimental data exactly as recorded, but to examine the implications of the experimental outcomes for a commercial producer by incorporating the key results into regionally representative cattle enterprise models. The limitations of this methodological approach to extrapolation of trial data to farm-level analyses can be addressed to some extent through the appropriate validation of the model used and the use of sensitivity analyses of key assumptions (Dillon and Anderson 1990). See also the discussion in Davidson and Martin (1965) on this topic.
Analysis of production on-farm
The Beef-N-Omics (BNO) software package (Dobos et al. 1997, 2006) was used to evaluate the profitability implications of the production alternatives prior to feedlot finishing (the ‘on-farm’ analyses). The program integrates feed budgets and financial gross margin calculations for beef cattle breeding and trading enterprises, and is designed to generate the effects on profitability of a beef breeding herd as a result of changes in management inputs. The production system modelled (cow herd plus appropriate progeny) was chosen to be representative of the region where the experimental site was located.
The general approach was as follows. First, to reduce the complexity of the economic analysis, it was assumed that the same land resource and mostly the same associated pasture resource would apply for each of the growth treatments. Energy available for the cow herd was varied by altering the stocking rate to just provide sufficient metabolisable energy (ME) to meet the relevant sets of cattle growth rates. The use of supplementary feeding was allowed if standard regional practice in a typical year. Thus, for example, 120 ha of good quality pasture1 could achieve the ‘fast’ growth path for 116 breeding cows and progeny, but only 67 breeding cows and progeny could be run on the 150 ha of poorer quality pasture to achieve the ‘slow’ growth path. The limitations of this approach are recognised given the simple ME approach used by BNO and the associated pasture modelling; however, the methodology allows for a consistent approach across all experimental treatments.2 Second, for each treatment analysed, actual feedlot entry weights are entered from the experimental data. Third, given a set of assumed prices and costs, steady state gross margins are calculated for the treatment being analysed. Local knowledge was used to determine the proportions of pastures required to finish the steers at the desired rates. Pasture growth rates were based on data collected in the NSW Riverina for each pasture type. Details of these and other assumptions are provided in the Appendices of Davies et al. (2008).
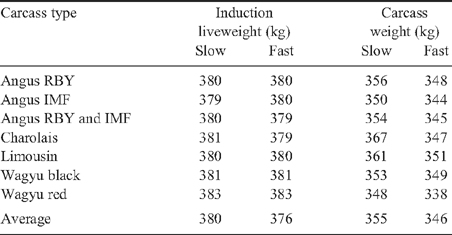
Once the feed supply aspect was settled, adjustments were then made to the experimental data to ensure that each breed type had an average feedlot induction weight of ~380 kg. This adjustment was necessary because different breed types had different growth rates but had to be placed in the feedlot on the same day to fit the experimental design. As a result, some types were too heavy and others were too light, which resulted in some types receiving significant price penalties because they were outside liveweight specifications at slaughter. The average induction weight for each breed type × growth path combination was set to an average of 380 kg by adjusting the time of induction. For slower growing types, the number of additional days required to attain induction weight was calculated and a daily agistment rate was charged to cover the costs to hold the slower growing types for additional periods.
Stocking rate
It is common practice in southern NSW to give supplementary feed to beef cattle in the late summer or early autumn period. Following consultation with local advisory officers, a maximum monthly pasture deficit of 100 kg per ha in the case of the fast growth enterprises and up to 300 kg per ha for the slow growth enterprises was used in the model.3 The Angus RBY breed type was chosen as a representative breed type and cow numbers were progressively increased in the BNO package until the feed budget showed the required deficits. Therefore, the stocking rates generated by the model were as follows: (i) fast growth treatment – 116 breeders including female progeny until 8 months of age (weaning) and male progeny to 16 months of age; and (ii) slow growth treatment – 67 breeders including female progeny until 8 months of age (weaning) and male progeny to 21 months of age.
Determination of supplementary feed requirements
The experimental cows were relatively small framed and averaged less than 480 kg liveweight throughout the study period. A loss of 10 kg in liveweight in a month (March) was considered normal practice for the fast growth treatment, whereas a loss of 10 kg per month for 2 months was considered normal practice in the slow growth treatment, for cows of this size. In both treatments, the spring flush was considered sufficient to return the cows to their original weight. Using the Droughtpack module from the StockPlan suite of decision support tools (http://www.dpi.nsw.gov.au/agriculture/profarm/courses/livestock/stockplan; see also Davies et al. 2007), feeding at 1.3 kg/steer.day below maintenance resulted in a loss in weight of 0.33 kg per day or 10 kg for the month. Supplementary feed was fed in the fast growth scenario until the feed deficit in March was –38 kg/ha for the month. For the slow growth scenario, a 10 kg/steer.month weight loss allowed in February and March converts to a monthly feed deficit of –18 kg/ha.4 Supplementation in other months was made where necessary to reduce the deficit to zero. Supplementary feed was assumed to be 10 MJ/kg dry matter (DM), cost $150/t and 90% DM.
Cost adjustments for slower growing breeds
As BNO works as a monthly model, the calculated age at induction was rounded to the nearest month for the fastest growing types (Charolais). For the slower growing steer types, an additional cost was determined by calculating the additional days required to achieve the induction weight, and applying a daily rate for ‘agistment’ (50 ¢/steer). This cost includes: (i) interest on sale proceeds that would occur if the fastest growing breed was selected; and (ii) the costs of tying up land for additional periods. In BNO this total per head cost was added as an ‘other cost’ against the yearlings. Mean induction weights used for all types were generated by a spline analysis,5 and were very close to the targeted 380 kg (range 379–382 kg). It should be noted here that because of the differences in pastures and turnoff times we are comparing two entirely different enterprises and it is not feasible for commercial farmers to easily change from one system to the other. The fast growth scenario relies on access to 20 ha of highly productive irrigated pastures to help fill the late summer, autumn feed gap and also on 10 ha of fodder crop to help fill the autumn, early winter deficit.
Herd parameters, costs and returns
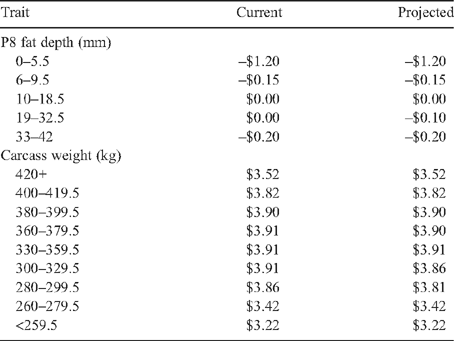
Prices and costs used in the analysis are for 2005–06. Since the evaluation of the feedlot phase was based on actual prices paid for the experimental cattle at a particular point in time (Table 1), costs and returns for the cow-calf activity were chosen to be consistent with this time period. The cow-calf activity was chosen to be representative of the NSW south-west slopes and was derived from a standard NSW Department of Primary Industries budget (NSW DPI 2006). See Davies et al. (2008) for greater detail. The areas of pasture and associated stocking rates used in the BNOmodel were chosen to provide a breeding herd roughly equivalent to the herd size assumed in the standard cow-calf budget.
|
Analyses of production in the feedlot phase
A spreadsheet model was used to calculate the gross margin outputs for this section of the analysis. The assumptions made for this analysis are described in Davies et al. (2008).
Analyses using standard grid specifications
The valuation of carcasses was based on the Cargill 100-day grain-fed grid (Cargill Beef Australia, Wagga Wagga, NSW, Australia) for July 2005 (see Table 1, column 1). The effect on the gross margin of using a constant price based on the average grid price for all carcass types was also examined. This was $3.83/kg carcass weight.
Analyses using tightened grid specifications
It is considered highly likely that processor grid specifications will be ‘tightened’ in the future to provide a stronger signal for producers to supply desired carcasses. The two most likely traits to undergo tightening of their acceptable ranges will be fat and weight specifications. RBY and marbling are also currently under consideration by processors for inclusion in payment systems, but these are not investigated here. Calculations have been made using projected changes in grid prices for fat and weight specifications, as shown in Table 1 (column 2).There were no time-of-calving experiments in NSW.
Results
Price penalties were incurred due to over- and underweight carcasses of the fastest and slowest growing breed types as a result of the variation in feedlot entry liveweights. In commercial practice, where individual producers would not have the large range in carcass types examined here, the liveweight of the animals presented to the feedlot would be much less variable and could be targeted to an optimal average.
The number of days that each breed type required to attain group mean feedlot induction weights of 380 kg was generated by a spline analysis of growth data. The time taken for the Charolais, the fastest growing breed type, to attain the targeted feedlot induction weight was 15 months and 21 months for the fast and slow growth treatments, respectively. The additional times taken for other breeds to achieve the same target, compared with the Charolais, are shown in Table 2, which also shows the agistment costs charged in the gross margin calculations as a result of this extra time required. The average additional cost added to cover the retention of livestock beyond 15 and 21 months was $15.89 for the fast growth treatments and $25.73 for the slow growth treatments. The induction and carcass weights generated from the spline analysis that were used for the gross margin calculations in this section are shown in Table 3.
|
Gross margins on-farm
The on-farm gross margins for the various treatment groups are shown in Table 4. The Charolais groups had higher returns compared with all others, and additional price premiums from 1.4 to 10.4¢ per kg would need to be received by the other breed types for the same on-farm gross margins to be attained. There was a consistent improvement in gross margins from the fast growth path, of around $70 per cow or $175 per ha on average.

|
Gross margins for the feedlot phase
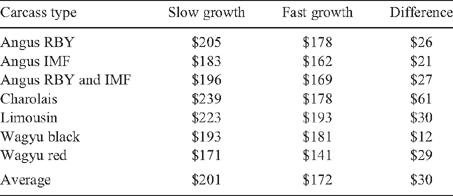
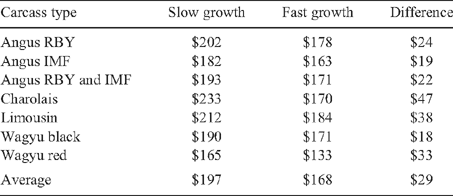
The slow growth treatments consistently outperformed the fast growth treatments in the feedlot (Table 5; i.e. gross margins using actual grid prices). The Charolais groups again showed a difference of $60 per steer in favour of the slow growth treatment. The differences between treatments for the other types were much lower (average $29 per steer) compared with the Charolais.

|
A ‘what if’ scenario was examined to see the effect of applying a constant grid value to all treatment groups, with the outcome of this exercise shown in Table 6. This showed that the gross margins and the ranking of the types were similar using constant or variable grid values.
|
Impact of tighter grid specifications
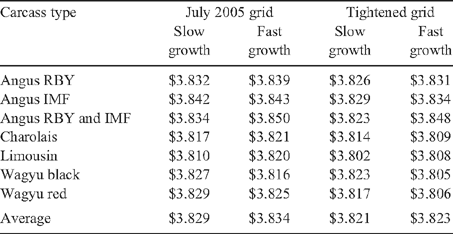
As previously discussed, there are likely to be changes in the processing industry through the implementation of more stringent specifications for the traits that affect carcass value. Table 7 shows the comparison of carcass values using the standard grid specifications, as generally used for the gross margin calculations, against a proposed tightened grid as described in the Methods section above (Table 1).
|
With tighter specifications for weight and fat, prices were reduced by around 1 ¢/kg on average, which was fairly consistent across all types. With such minor changes in price, the resultant gross margins (Table 8) showed little variation from those previously calculated (Table 5), with almost identical ranking of the types within growth treatments.
|
Discussion and conclusion
At the NSW site, adjustments were made to feedlot entry, exit and carcass weights and carcass fatness, to account for differences imposed due to project design. These adjustments help compare animals closer to ‘real world’ conditions where they would generally be treated as homogenous groups rather than disparate groups as imposed by the project design.
There was a large difference between the fast and slow treatments favouring the fast growth treatment in the on-farm analyses (gross margin advantage of $68 per cow and $176 per ha over the slow growth treatment), even after accounting for the higher cost of producing pasture capable of sustaining faster growth. This was primarily due to steers being sold earlier allowing more cows to be run on the pastures for the fast growth treatment, while still maintaining the same annual and monthly pasture deficits.6
Although the average difference between fast and slow growth treatments was $176 per ha, within breed types this difference varied with the Charolais the highest at $182 per ha and the Angus IMF the lowest at $172 per ha. It is postulated that this is a reflection of the growth potential of the various breed types and when a potentially faster growth type is given the opportunity to grow it performs better under those more favourable conditions.
The biggest driver of profitability between breed types was weight and liveweight gain achieved within treatments. The Charolais breed type, even within the slower growth treatment, outweighed and outperformed all other breed types. The slower growing Angus and Wagyu types performed the worst. This clear advantage to fast growth over slow (on average and across breed types), and its magnitude, suggest there is considerable margin for even greater costs (supplementary feeding, pasture improvement, etc.) to be absorbed to achieve a faster pre-feedlot growth.
During the feedlot phase, those steers entering the feedlot at heavier liveweights also exited at heavier liveweights and were considerably discounted for being overweight at the end (a function of the research design requiring feedlot entry at the mean target entry averaged over all types). Therefore, breed types like Charolais were heavily discounted on exit ($3.738/kg and $3.761/kg in the slow and fast treatments compared with the treatment averages of $3.813/kg for both). Despite this, the Charolais type in the slow treatment still had the highest gross margin due to a substantial benefit in overall carcass value where their total weight advantage compensated for the $/kg disadvantage. The Charolais weight advantage was considerably enhanced by the higher than treatment average compensatory effect in feedlot gain in the slow growth group.
Within the fast growth group, this growth advantage did not occur, reducing the overall weight advantage of the Charolais, allowing the discounts to have more of an effect, and resulting in them being ranked near the average compared with the other breed types.
There was a considerable advantage in weight gain to the slow growth groups (2.54 kg/day) compared with the fast groups (2.39 kg/day), occurring across all breed types and resulting in an average advantage at finish of 13 kg of carcass weight and hence overall value. This was the major factor in the higher gross margin of the slow treatment group compared with the fast treatment group. The Red Wagyu type, the slowest growing, performed worst in terms of gross margin.
Considering the pre-feedlot and feedlot analyses together, the highest gross margins in the pre-feedlot phase were produced by the fast growth treatment groups, whereas the slow growth treatments performed better in the feedlot. However, the magnitude of the economic advantage before feedlot, combined with the improvements in carcass traits reported above, certainly favour the fast growth option overall.
Therefore, high growth breed types have much to offer in terms of overall profitability because of their extra weight at sale, but need to be managed carefully to ensure acceptable compliance for other traits. Regional cattle producers need to have a good understanding of their whole farm system when considering the appropriate combinations of breed type and growth path that is best for them. For example, while there were large differences in mean gross margins between the fast and slow treatment groups before feedlot entry, there may be significant differences in individual farm businesses in relation to input requirements and availability, and pasture types and growth rates through the year and consequent implications for stocking rates at different growth rates. Sale weights and prices received for both weaners and finished cattle will also vary through the year as will supplementary feed requirements, availability and price. A specialised software package like BNOmakes consideration of all these various factors formal and explicit.
Acknowledgements
The financial and in-kind support of the Cooperative Research Centre for Cattle and Beef Quality and its partner agencies Meat and Livestock Australia, New South Wales Department of Primary Industries and the University of New England is gratefully acknowledged. Thanks also to the many staff of these agencies that assisted in field operations, data collection and processing, biometrics and administrative support. The generous support in cash and kind of the commercial cooperator, AgReserves Australia is gratefully acknowledged, as is the individual support of all the field staff and management of this organisation. The cooperation and assistance of Cargill Beef Australia at the finishing and processing stages of the experiments is also acknowledged. The economics team pays a special tribute to the NSW overall project management team of Bill McKiernan, John Wilkins and Jim Walkley who provided support, data and other assistance, whenever asked. Stuart Mounter and Kirrily Pollock provided valuable comments on an earlier draft of this paper.
Davidson BR, Martin BR
(1965) The relationship between yields on farms and in experiments. Australian Journal of Agricultural Economics 9(2), 129–140.
[Verified 10 March 2009]
Egan AF,
Ferguson DM, Thompson JM
(2001) Consumer sensory requirements for beef and their implications for the Australian beef industry. Australian Journal of Experimental Agriculture 41, 855–859.
| Crossref | GoogleScholarGoogle Scholar |
[Verified 10 March 2009]
Polkinghorne R,
Thompson JM,
Watson R,
Gee A, Porter M
(2008a) Evolution of the Meat Standards Australia (MSA) beef grading scheme. Australian Journal of Experimental Agriculture 48(11), 1351–1359.
| Crossref | GoogleScholarGoogle Scholar |

Polkinghorne R,
Philpott J,
Gee A,
Doljanin A, Innes J
(2008b) Development of a commercial system to apply the Meat Standards Australia grading model to optimise the return on eating quality in a beef supply chain. Australian Journal of Experimental Agriculture 48(11), 1451–1458.
| Crossref | GoogleScholarGoogle Scholar |

Polkinghorne R,
Watson R,
Thompson JM, Pethick DW
(2008c) Current usage and future development of the Meat Standards Australia (MSA) grading system. Australian Journal of Experimental Agriculture 48(11), 1459–1464.
| Crossref | GoogleScholarGoogle Scholar |

Thompson JM,
Polkinghorne R,
Hwang IH,
Gee AM,
Cho SH,
Park BY, Lee JM
(2008) Beef quality grades as determined by Korean and Australian consumers. Australian Journal of Experimental Agriculture 48(11), 1380–1386.
| Crossref | GoogleScholarGoogle Scholar |

Verbyla AP,
Cullis BR,
Kenward MG, Welham SJ
(1999) The analysis of designed experiments and longitudinal data by using smoothing splines. Applied Statistics 48, 269–311.

1 The 120 ha included 20 ha of irrigated lucerne and 10 ha of winter fodder crop.
2 At the NSW site the breed types included were Angus selected for high RBY, Angus selected for high IMF, Angus selected for both high RBY and high IMF, Charolais, Limousin, Black Wagyu and Red Wagyu. The growth paths selected were a high growth path to achieve 0.7–1.0 kg per day from weaning to feedlot entry, and a moderate/slow (or conventional) growth path to achieve 0.5–0.6 kg per day from weaning to feedlot entry.
3 The slow growth enterprise allowed for greater deficits because of the lower growth rates required for the steers and the fact that there is no irrigated summer pastures assumed for this enterprise.
4 Feed deficits for fast growth options were calculated as follows: 116 head × 1.3 kg deficit per day × 30.4 days per month = 4584 kg of allowable feed deficit ÷ 120 ha = 38 kg per ha deficit allowed for March. Deficits for slow growth options were 67 head × 1.3 kg deficit per day × 30.4 days per month = 2648 kg ÷ 150 ha = 18 kg/ha allowed for February and March.
5 A mixed model cubic smoothing spline analysis (Verbyla et al. 1999) was used to both describe the growth paths and to predict live and carcass weights where various corrections were required. In particular, a set of data was generated to predict the performance of steers if each growth treatment × sire type group was set to a mean 380 kg feedlot induction weight. The ‘extra days’ taken (compared with the fastest group) for groups of steers to achieve this 380 kg mean was also part of the data generated from this procedure.
6 Although not reported, this advantage also shows in the return per $100 of livestock capital because, with faster growth, there is less money tied up in stock on hand.


