

Prediction of Tumour Tissue Diffusion Coefficients of Hypoxia-Activated Prodrugs from Physicochemical Parameters
Frederik B. Pruijn A B , Kashyap Patel A , Michael P. Hay A , William R. Wilson A and Kevin O. Hicks AA Auckland Cancer Society Research Centre, The University of Auckland, Private Bag 92019, Auckland 1142, New Zealand.
B Corresponding author. Email: f.pruijn@auckland.ac.nz
Australian Journal of Chemistry 61(9) 687-693 https://doi.org/10.1071/CH08240
Submitted: 5 June 2008 Accepted: 9 July 2008 Published: 5 September 2008
Abstract
The therapeutic activity of anticancer agents depends critically on their ability to penetrate through tumour tissue to reach their target cells, a requirement that is especially important for hypoxia-activated prodrugs. Here we use multicellular layers (MCL) grown in vitro from HT29 colon carcinoma cells to measure tissue diffusion coefficients (Dmcl) of 67 structurally diverse benzotriazine di-N-oxides (analogues of the hypoxia-activated prodrug tirapazamine) plus four miscellaneous compounds. An algorithm was developed to predict Dmcl from physicochemical parameters (molecular weight, octanol/water partition coefficient at pH 7.4, number of hydrogen bond donors and acceptors); the fitted multivariate relationship had an explained variance (R2) of 0.907 and predictive power (Q2) of 0.879. Using a subset of nine compounds tested as a single cassette, the algorithm was shown to apply, with some adjustment of coefficients, to MCLs from three other tumour cell lines with differing cell packing densities (SiHa, HCT8-Ea, and HCT8-Ra). The demonstrated relationships provide tools for optimizing extravascular transport of anticancer agents during lead optimization.
Introduction
One of the best-characterized physiological abnormalities of solid tumours, resulting from functionally defective microvasculature, is the presence of regions of severe hypoxia.[1,2] Hypoxic cells present a therapeutic challenge because of their resistance to radiotherapy and chemotherapy,[3,4] and the multiple roles of hypoxia in many aspects of tumour progression including angiogenesis,[5] invasion,[6] metastasis,[7] genomic instability,[8] the selection of apoptosis-resistant cells,[9] and the switch to glycolytic metabolism.[10] At the same time the presence of more severe and extensive hypoxia in tumours than in normal tissues provides a physiological target that can potentially be exploited as a basis for tumour selectivity.[3,11–16]
Several prodrugs that are selectively activated under hypoxia are currently in clinical or preclinical development,[17–20] including the benzotriazine-di-N-oxide tirapazamine (TPZ; Fig. 1). As for most hypoxia-activated prodrugs, TPZ is metabolically activated by ubiquitous flavoproteins that act as one-electron reductases. Under normal oxygenation, the resulting free radical is rapidly and spontaneously reoxidized to the initial prodrug by dioxygen, with formation of relatively non-toxic superoxide. The longer lifetime of the TPZ radical under hypoxic conditions allows its spontaneous decomposition to a cytotoxic oxidizing radical, considered to be either the hydroxyl[21,22] or benzotriazinyl radical[23,24] (Fig. 1). Many studies have shown that TPZ is able to kill hypoxic cells selectively in experimental tumours,[25,26] but its therapeutic activity is limited by rapid bioreductive metabolism, which is fast enough to compete with its diffusion into hypoxic tissue.[27–33] This is a general problem in the design of hypoxia-activated prodrugs, as it is for many other classes of anticancer agents,[4,34,35] but has been neglected during drug discovery and lead optimization.

|
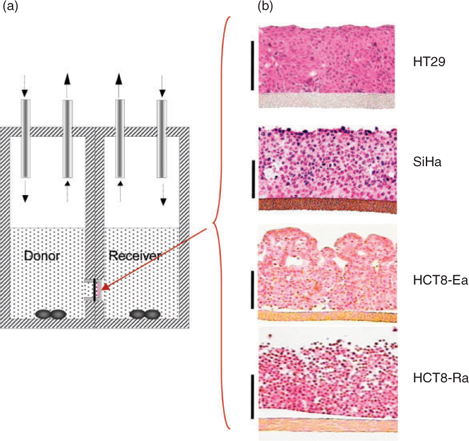
We have developed a three-dimensional (3D) tissue culture model suitable for measuring diffusion coefficients of drugs in a tissue-like environment.[35–38] In this model cells are seeded onto a collagen-coated porous Teflon support membrane, and grown to form multicellular layers (MCLs; illustrated for four human tumour cell lines in Fig. 2b). The MCLs are then mounted in a diffusion chamber to allow measurement of flux between two stirred compartments separated by the MCLs (Fig. 2a). Fitting concentration–time data in both compartments to reaction–diffusion models allows determination of the effective diffusion coefficient (Dmcl) in this model tissue, and kinetics of reactions such as drug metabolism or reversible binding to macromolecules. These parameters can then be used to model pharmacokinetics (PK) and pharmacodynamics (PD) in the extravascular compartment of tumours. We have validated these spatially resolved PK/PD models by showing that they correctly predict the apparent resistance to cytotoxicity of TPZ in hypoxic MCLs,[30] and the magnitude of hypoxic cell killing by TPZ in HT29[33] and SiHa[39] tumour xenografts. Furthermore, we have shown that these spatially resolved PK/PD models are superior to conventional PK/PD models (which treat the tumour as a single compartment) for predicting the ability of structurally diverse TPZ analogues to kill hypoxic cells in HT29 xenografts.[33] In addition, we have used these models during lead optimization to prioritize synthetic targets and to identify TPZ analogues with improved extravascular transport[40,41] and therapeutic activity in xenograft models.[42] Studies with other hypoxia-activated prodrugs, and other classes of anticancer agent, also argue for the utility of the MCL model in understanding and manipulating extravascular transport.[35,36,43–48]
|
Although measurement of extravascular transport properties with the MCL model is a potentially useful tool, it is not readily amenable to high-throughput studies. Here we seek a predictive algorithm by determining the relationship between Dmcl and physicochemical parameters, using a structurally diverse set of 71 compounds (predominantly benzotriazine di-N-oxide analogues of TPZ, supplementary Table S1). We have previously shown, in a series of 13 neutral TPZ analogues, that Dmcl for HT29 MCLs is a sigmoidal function of log P (octanol/water partition coefficient), with a minor dependence on molecular weight (MW).[32] The extended compound set for the present study (Table S1) includes weakly basic analogues, and compounds with larger numbers of hydrogen bond donors (HD) and acceptors (HA). We show that the log P at pH 7.4 (log P7.4) accommodates the effects of protropic equilibria, and that HD and HA are also important determinants of Dmcl. The overall algorithm provides good prediction of Dmcl from these physicochemical parameters, which are readily determined and manipulated by the medicinal chemist. More limited studies with three additional cell lines (using a cassette of nine compounds) suggest that the algorithm has broad applicability, but requires adjustment of coefficients to account for differences in the cell junctions and packing density.
Results and Discussion
Flux of Urea Through MCLs from Four Human Tumour Cell Lines
The transport of 14C-urea through MCLs grown from the four tumour cell lines was compared using the apparatus in Fig. 2a. All cell lines suppressed flux relative to bare Teflon support membranes (without an MCL), but the effect on net transport differed considerably between cell lines (flux for HCT8-Ra > SiHa > HT29 > HCT8-Ea) despite similar average MCL thicknesses (Fig. 3a). The cell lines that provided the fastest and slowest transport were clones with rounded (Ra) or epithelial (Ea) morphology, respectively, which were selected from the parental HCT8 cell line; the latter is hemizygous for the α-E-catenin gene (CTNNA1) and is known to segregate, at high frequency, to round morphology α-E-catenin-null variants lacking adherens junctions.[49] Surprisingly, the HCT-Ra line appears to express normal levels of α-E-catenin,[47] but it nonetheless fails to form tight intercellular junctions. Across the four cell lines there appeared to be an inverse correlation between urea flux and cellular packing density observed by microscopy (Fig. 2b), which suggests that the diffusion route of this relatively hydrophilic molecule is primarily paracellular (between cells) rather than transcellular (through cells) as illustrated in Fig. 3b.

|
Relationship Between Physicochemical Parameters and Diffusion of TPZ Analogues in HT29 MCLs
To explore the physicochemical determinants of diffusion through HT29 MCLs, we investigated 67 TPZ analogues (MW 162–539) that spanned a log P7.4 range from –2.62 to +2.63 with 0–3 HD and 5–11 HA (Study A). Compound structures and physicochemical parameters are listed in Table S1. The O2 concentration in the gas phase was increased to 95% during the flux experiments to extinguish central hypoxia in the MCLs,[28] thus minimizing reductive metabolism of the prodrugs. Under these conditions the flux curves were well modelled as Fickian diffusion, generally with little or no metabolic consumption. For subsets of compounds with DNA intercalating functionality (e.g., SN26955) or sensitivity to aerobic metabolism by DT-diaphorase (e.g., SN27800), the mass balance showed significant loss during the flux experiments, which was accommodated by addition of reaction terms in the MCL. The fitted Dmcl values are listed in Table S1. To this compound set we added the bioreductive drug NLCQ-1[50] and three flux markers (urea, mannitol, and acridan-9(10H)-one), which were used at low concentration and simultaneously added to the TPZ analogues to estimate MCL thicknesses and for quality control. For the set of 71 compounds, we tested the dependence of Dmcl on log P7.4, HD, and HA since these parameters are expected to influence diffusion through lipoidal membranes and thus access to the transcellular route.[51] Including the expected MW dependence, based on its relationship with Stoke’s radius, an excellent correlation was obtained using a sigmoidal dependence on log P7.4 as previously for neutral compounds[32] modified by HD and HA as shown in Eqn 1 and demonstrated in Fig. 4. All parameters were highly significant (P < 0.0001) based on the F-statistic for their inclusion in the multiple regression, with a high explained variance (R2 = 0.907) and predictive power (Q2 = 0.879). The values of the coefficients and their error estimates are given in Table 1.
|

|
Differences Between Cell Lines: Comparison of SiHa, HCT8-Ea, and HCT8-Ra with HT29
To evaluate whether this relationship is a general one across cell lines, we compared flux through HT29, SiHa, HCT8-Ea, and HCT8-Ra MCLs using a cassette of nine compounds that spanned a log P7.4 range from –2.62 to +2.97, a MW range of 60–347, HA of 2–7, and HD of 1–6 (Study B). This included six TPZ analogues (SN28205, SN28682, SN28870, SN29102, SN29347, and SN29366 in Table S1) and the lipophilic acridan-9(10H)-one; these seven compounds were assayed by ion trap mass spectrometry. In addition, two radiolabelled hydrophilic compounds (3H-mannitol, 14C-urea) were assayed by scintillation counting. The seven compounds investigated in both Study A and Study B gave similar HT29 Dmcl values in both (mean of Study A/Study B = 1.31, s.d. of ratios = 0.37), which indicates that there was little interference between compounds in the cassette (Fig. 4). For the other cell lines a broadly similar sigmoidal dependence on log P7.4 was seen to that for HT29, but with an apparent change in the low and high log P7.4 asymptotes. We, therefore, fitted Eqn 1 to each dataset, holding all coefficients at the values determined for HT29 in Study A, except for a and c which are the coefficients that determine the high and low log P7.4 asymptotes. The fitted coefficients for each cell line are shown in Table 1.
The log P7.4 dependence for the four cell lines is compared graphically in Fig. 5a by showing the calculated Dmcl for a hypothetical compound with MW = 200, HD = 2, and HA = 4. The midpoint of the sigmoidal curve was at a log P7.4 ~ 0 in all cases. The SiHa curve was offset to slightly higher Dmcl values throughout the log P7.4 range, which presumably reflects its somewhat lower packing density (Fig. 2b). The HCT8-Ra line gave much higher Dmcl values, especially at the low log P7.4 asymptote, which presumably reflects the predominantly paracellular transport in these loosely packed MCLs. The epitheloid HCT8-Ea line gave a low log P7.4 asymptote similar to HT29, but the largest increase at high log P7.4 (100-fold). A possible interpretation is that efficient adherens junctions occlude the paracellular route for hydrophilic compounds, but that the mean packing density is relatively low compared with HT29 and also SiHa. However, rigorous physiological interpretation of these apparent differences would require examination of larger numbers of compounds and quantitative assessment of cell packing, intercellular matrix composition, and intercellular junctions in these MCLs.
|
Sensitivity Analysis
In Fig. 5 we also show the sensitivity of Dmcl to the physicochemical parameters of Eqn 1, based on the HT29 parameters determined with the 71 compounds of Study A. MW changes in the range typical of small molecule drugs (200–500 daltons) have little effect (Fig. 5b). Adding a single hydrogen bond acceptor to the hypothetic molecule (MW = 200, HD = 2, HA = 4) has a similar small effect, but addition of a single hydrogen bond donor has a larger effect (Fig. 5c), which reflects the approximately three-fold larger value of y than z in Table 1. Changes in MW influence the asymptotes, while changes in hydrogen bond number shift the effective log P7.4 and thus can have large effects on Dmcl at log P7.4 values near the midpoint of the sigmoid.
In terms of activation energy it should not matter whether an existing hydrogen bond between the diffusing molecule and the solvent (water) is between a hydrogen bond donor or acceptor. This raises the question why y is approximately three-fold larger than z in Table 1. One explanation may be that partitioning between octanol/water is not simply a function of lipophilicity as such; solute size and hydrogen-bond basicity also have an effect.[52] The lower contribution of solute hydrogen-bond acidity is due to the fact that water and wet octanol have the same hydrogen-bond basicity.[51] In other words, log P7.4 in Eqn 1 already partially takes account of hydrogen bond basicity, hiding some of the effect of HA. Second, there is an energy cost due to the loss of favourable electrostatic interactions and hydrogen bonds when leaving the bulk water phase for the hydrophobic core of the bilayer of the cell membrane. The polar lipid headgroups do not possess any polar hydrogen atoms (hydrogen bond donors). Therefore, hydrogen-bond acceptors may not incur a rise in free energy because they can form no H-bonds with the surrounding lipids in contrast to solutes with hydrogen-bond donors.[53] It is interesting to note there is also a differential weighting of HD over HA in the so-called Lipinski rules.[54]
From Fig. 5 it can also be envisioned that when dealing with a series of analogues that have low log P7.4 values (i.e., along the lower asymptote) one will not see any substantial changes in flux with moderate changes in log P7.4 or hydrogen bonding. For example, this may explain why no differences where found in the transport kinetics of four- and six-coordinate platinum compounds in a multicell layer tumour model despite large differences in physicochemical properties.[48] Similarly, polar permeants with log P values < 0 fail to display the expected dependence on lipophilicity when fluxing across cultured cerebral capillary endothelial cells as a model for the blood–brain barrier by virtue of diffusing predominantly by the paracellular route.[55]
Conclusions
Given that tumours can regrow from a single cell with stem-like activity following therapeutic intervention, it is more important in oncology than in most other areas of pharmacology that all target cells receive efficacious drug exposure. The problem of pharmacological sanctuaries in tumours has long been appreciated,[56] but tools have been lacking for optimizing extravascular drug distribution during lead development. The MCL model has provided an opportunity to define the physicochemical determinants of diffusion of small molecule anticancer drugs through tumour tissue for the first time. The relationships identified here are unsurprising, being similar to those for permeability of epithelia and biological membranes (e.g., skin, intestine, blood–brain barrier, cornea) where lipophilicity, hydrogen bonding potential, and MW are known to be key determinants.[51,55,57,58] They are also entirely consistent with Lipinski’s rules for drug-like small molecules, which emphasizes the requirement for low molecular weight (<500), low numbers of hydrogen bond donors and acceptors (<5 and <10, respectively), and a log P < 5 for optimal intestinal absorption, which is a balance between aqueous solubility and membrane permeability.[54]
While Eqn 1 provides a potentially useful tool for estimating tumour tissue diffusion coefficients computationally, given that all the required parameter values can be readily calculated for virtual compounds, some cautions need to be sounded. The first is that the algorithm applies only to compounds for which passive diffusion is the dominant transport mechanism. Active transporters such as ABC pumps are known to modify extravascular drug transport in tissue, and can enhance penetration of MCLs by reducing sequestration in cells and increasing paracellular transport.[59] The second caution is that Eqn 1 applies to free (unbound) drug only. If high affinity drug binding sites are present in high concentrations (e.g., DNA interbase-pair sites in the case of DNA intercalators), flux can be greatly slowed during the extended pre-steady-state phase.[35–37]
Finally, and obviously, lead optimization is bound by many additional constraints beyond the tissue diffusion coefficient, so the application of Eqn 1 alone will not necessarily lead to analogues with improved therapeutic activity. For hypoxia-activated prodrugs, the kinetics of bioreductive activation also needs to be optimized to ensure that this does not compromise penetration into hypoxic tissue. More generally, the consequences of changing extravascular transport properties need to be viewed in the context of spatially resolved PK/PD models that are specific for the drug series under development, as we have illustrated for TPZ analogues.[33]
Experimental
Compounds
Synthesis of most of the TPZ analogues has been reported previously (see Table S1 for references). Stock solutions were prepared freshly in DMSO, typically at 5 × 10⁻³ M, for MCL penetration studies. For measurement of log P7.4, compounds were directly dissolved in octanol-saturated phosphate buffered saline (PBS) or PBS-saturated octanol, depending on their aqueous solubility.
Physicochemical Parameters
As a measure of lipophilicity, octanol/aqueous buffer (pH 7.4) partition coefficients (P7.4) were determined at ambient temperature using the shake-flask method with 0.5 mL in each phase. Drug concentrations in both the octanol and buffer phases were analyzed by HPLC. Measured and literature log P7.4 values for 98 compounds were used to train ACD LogP/LogD prediction software (version 8.0, Advanced Chemistry Development Inc., Toronto, Canada) using ACD/LogP System Training and Accuracy Extender in order to calculate the log P7.4 values for the remaining compounds. MW, HD (count of –NH and –OH groups), HA (count of N and O atoms), and apparent (macroscopic) pKa values for the side chain were calculated using ACD/PhysChem package (version 8.0, Advanced Chemistry Development Inc., Toronto, Canada). Although a simple count of possible hydrogen bond donors and acceptors does not take into account differences in strength of any formed hydrogen bonds it has been shown that these simple hydrogen bond descriptors can lead to good predictive (i.e., statistically sound) models and have the advantage of being easily calculated.[57]
MCL Flux Studies
MCLs were grown submerged in αMEM culture medium containing 10% fetal bovine serum as previously described,[35,38] using HT29 (human colon carcinoma), SiHa (human cervical carcinoma), and HCT8 (human ileocecal carcinoma) cell lines. Two clones, with epithelial (HCT8-Ea) and rounded morphology (HCT8-Ra) were isolated from the HCT8 cell line (see main text). MCL histology and thickness measurements were performed using frozen sections as described.[30] To determine flux through the MCLs, the test diffusant(s) was added, along with ~1 × 10⁻⁶ M 14C-urea (2.11 GBq mmol–1, Amersham, Sydney, Australia) to 5.5 mL of αMEM (containing 10% fetal bovine serum in Study A, but not in Study B) in the donor compartment (Fig. 2a). Urea flux was used as an internal standard for the determination of the thickness of each individual MCL. The Dmcl values for urea were determined by fitting the flux data to MCLs for which thicknesses were subsequently determined by microscopy, expanding on previous determinations.[38] The urea Dmcl values (mean ± s.e.m., [n], cm2 s–1 × 10⁷) were 4.50 ± 0.23 [6] for HT29, 9.62 ± 0.85 [9] for SiHa, 1.31 ± 0.37 [15] for HCT8-Ea, and 26.8 ± 0.72 [13] for HCT8-Ra. Flux through bare support membranes was also evaluated for each compound to confirm stability and to check that diffusion coefficients through the support membrane (porosity 11%) were consistent with MW.[32] In addition, the measured diffusion coefficient through the Teflon support accounted for the unstirred water layers on each side of the membrane, which were assumed to be similar in the presence of MCLs. In Study A, the initial concentration of the test agent in the donor compartment was (10–50) × 10–6 M. In Study B (nine compound cassette) the initial concentration of each was 10 × 10–6 M except for the more slowly diffusing compounds, SN28205, SN28682 (20 × 10–6 M), and 3H-mannitol (ICN Pharmaceuticals Inc., USA) at ~1 × 10⁻⁶ M. Samples (100 μL) were withdrawn from both compartments at intervals of 0.5–1 h for 5 h and analyzed immediately.
Analytical Methods
3H and 14C radioactivity was determined by scintillation counting of 25 μL samples in a Packard Tri-Carb 1500 liquid scintillation analyzer (Packard Instrument Co., Meriden, CT, USA) using Emulsifier-Safe water-accepting scintillant (Packard). For Study A, TPZ analogues were assayed by HPLC using photodiode array detection as previously reported.[32] For Study B, compounds were analyzed with an Agilent 1100 Capillary LC system interfaced with an Agilent LC/MSD Trap SL ion trap mass spectrometer equipped with an electrospray ion source. MS parameters were: capillary voltage 4.5 kV, nebuliser pressure 12 psi, first octapole offset 12 V, second octapole offset 1.5 V, scan range 150–370 m/z. Chromatographic separation used a Zorbax SB C18 reverse-phase column (150 mm × 0.5 mm) with 5 μm particles and a mobile phase comprising 5 × 10⁻³ M ammonium formate pH 4.5 and 80% (v/v) acetonitrile at a flow rate of 18 μL min–1.
Mathematical Modelling
The diffusion coefficient of each compound was determined by fitting the concentration–time data for both the donor and receiver compartment to Fick’s second law, including reaction terms in the MCL when appropriate, as previously described.[36] Non-linear regression (Eqn 1) was performed using SigmaPlot (version 9.01, Systat, Richmond, CA, USA). Cross-validation was performed by randomly assigning compounds to seven groups and leaving out one group at a time and to build the model and fit the model parameters, which were then used to predict the Dmcl values of the compounds that were left out. After seven rounds the cross-validated correlation coefficient Q2 was calculated.
Accessory Publication
The extended compound set for the present study in Table S1 is available from the author or, until September 2012, the Australian Journal of Chemistry.
Acknowledgements
The authors thank Joanna Sturman and Rachel Chapman for excellent assistance with the MCL flux experiments and Sarath Liyanage for log P7.4 measurements. This study was supported by Grant No. CA82566 from the USA National Cancer Institute, and the Health Research Council of New Zealand.
[1]
[2]
J. L. Tatum,
G. J. Kelloff,
R. J. Gillies,
J. M. Arbeit,
J. M. Brown,
K. S. Chao,
J. D. Chapman,
W. C. Eckelman,
A.W. Fyles,
A. J. Giaccia,
R. P. Hill,
C. J. Koch,
M. C. Krishna,
K. A. Krohn,
J. S. Lewis,
R. P. Mason,
G. Melillo,
A. R. Padhani,
G. Powis,
J. G. Rajendran,
R. Reba,
S. P. Robinson,
G. L. Semenza,
H. M. Swartz,
P. Vaupel,
D. Yang,
B. Croft,
J. Hoffman,
G. Liu,
H. Stone,
D. Sullivan,
Int. J. Radiat. Biol. 2006, 82, 699.
| Crossref | GoogleScholarGoogle Scholar |
CAS |
| Crossref | GoogleScholarGoogle Scholar |
CAS |
| Crossref | GoogleScholarGoogle Scholar |
CAS |
| Crossref | GoogleScholarGoogle Scholar |
CAS |
| Crossref | GoogleScholarGoogle Scholar |
| Crossref | GoogleScholarGoogle Scholar |
CAS |
| Crossref | GoogleScholarGoogle Scholar |
CAS |
| Crossref | GoogleScholarGoogle Scholar |
CAS |
| Crossref | GoogleScholarGoogle Scholar |
CAS |
|
CAS |
| Crossref | GoogleScholarGoogle Scholar |
CAS |
|
CAS |
|
CAS |
| Crossref | GoogleScholarGoogle Scholar |
CAS |
| Crossref | GoogleScholarGoogle Scholar |
CAS |
| Crossref | GoogleScholarGoogle Scholar |
CAS |
| Crossref | GoogleScholarGoogle Scholar |
CAS |
| Crossref | GoogleScholarGoogle Scholar |
CAS |
| Crossref | GoogleScholarGoogle Scholar |
CAS |
| Crossref | GoogleScholarGoogle Scholar |
CAS |
| Crossref | GoogleScholarGoogle Scholar |
CAS |
| Crossref | GoogleScholarGoogle Scholar |
CAS |
|
CAS |
| Crossref | GoogleScholarGoogle Scholar |
CAS |
| Crossref | GoogleScholarGoogle Scholar |
CAS |
|
CAS |
| Crossref | GoogleScholarGoogle Scholar |
CAS |
|
CAS |
| Crossref | GoogleScholarGoogle Scholar |
CAS |
| Crossref | GoogleScholarGoogle Scholar |
CAS |
|
CAS |
| Crossref | GoogleScholarGoogle Scholar |
CAS |
|
CAS |
|
CAS |
| Crossref | GoogleScholarGoogle Scholar |
CAS |
|
CAS |
| Crossref | GoogleScholarGoogle Scholar |
CAS |
| Crossref | GoogleScholarGoogle Scholar |
CAS |
| Crossref | GoogleScholarGoogle Scholar |
CAS |
| Crossref | GoogleScholarGoogle Scholar |
CAS |
| Crossref | GoogleScholarGoogle Scholar |
CAS |
|
CAS |
| Crossref | GoogleScholarGoogle Scholar |
CAS |
| Crossref | GoogleScholarGoogle Scholar |
CAS |
| Crossref | GoogleScholarGoogle Scholar |
CAS |
|
CAS |
|
CAS |
| Crossref | GoogleScholarGoogle Scholar |
CAS |
| Crossref | GoogleScholarGoogle Scholar |
CAS |
| Crossref | GoogleScholarGoogle Scholar |
CAS |
| Crossref | GoogleScholarGoogle Scholar |
CAS |
|
CAS |
| Crossref | GoogleScholarGoogle Scholar |
CAS |
| Crossref | GoogleScholarGoogle Scholar |
CAS |
| Crossref | GoogleScholarGoogle Scholar |
CAS |
