

Internal Energy Deposition in Dielectric Barrier Discharge Ionization is Significantly Lower than in Direct Analysis in Real-Time Mass Spectrometry*
Morphy Dumlao A , George N. Khairallah B C and W. Alexander Donald A DA School of Chemistry, University of New South Wales, Sydney, NSW 2052, Australia.
B School of Chemistry, University of Melbourne, Melbourne, Vic. 3010, Australia.
C Accurate Mass Scientific, Keilor, Vic. 3036, Australia.
D Corresponding author. Email: w.donald@unsw.edu.au
Australian Journal of Chemistry 70(11) 1219-1226 https://doi.org/10.1071/CH17440
Submitted: 31 July 2017 Accepted: 25 August 2017 Published: 12 September 2017
Abstract
The extent of internal energy deposition using three different plasma-based ionization mass spectrometry (MS) methods, atmospheric pressure chemical ionization (APCI), direct analysis in real time (DART), and active capillary dielectric barrier discharge ionization (DBDI), was investigated using benzylammonium ‘thermometer’ ions. Ions formed by DBDI were activated significantly less than those that were formed by DART and APCI under these conditions. Thermal ion activation by DART can be reduced slightly by positioning the DART source further from the capillary entrance to the MS and reducing the heat that is applied to metastable atoms exiting the DART source. For example, the average ion internal energy distribution decreased by less than 10 % (166.9 ± 0.3 to 152.2 ± 1.0 kJ mol−1) when the distance between the DART source and the MS was increased by 250 % (10 to 25 mm). By lowering the DART temperature from 350 to 150°C, the internal energy distributions of the thermometer ions decreased by ~15 % (169.93 ± 0.83 to 150.21 ± 0.52 kJ mol−1). Positioning the DART source nozzle more than 25 mm from the entrance to the MS and decreasing the DART temperature further resulted in a significant decrease in ion signal. Thus, varying the major DART ion source parameters had minimal impact on the ‘softness’ of the DART ion source under these conditions. Overall, these data indicate that DBDI can be a significantly ‘softer’ ion source than two of the most widely used plasma-based ion sources that are commercially available.
Introduction
Ambient ionization methods are useful for forming intact ions directly from chemical mixtures in their native environment without sample preparation or chromatography for detection by mass spectrometry (MS) with high sensitivity.[1] Methods for forming ions under ambient conditions can be classified into three primary groups that are based on liquid solution sprays,[2,3] laser desorption from surfaces,[4–6] and plasma ionization.[7] Such ionization methods can be used to analyse samples in the open atmosphere without the need for ion source enclosure, which facilitates high-throughput screening applications, including in the analysis of pharmaceutical tablets,[8] forensic samples,[9–11] explosives,[12,13] narcotics,[14] chemical warfare agents,[15–17] and persistent organic pollutants,[18–20] and bacterial profiling.[21] Plasma-based ionization methods have the advantages that (i) solvents, fluid pumps, and lasers are not required, and (ii) such ion sources tend to be significantly less susceptible to ion suppression, in which the sample matrix can detrimentally affect analyte ionization efficiency, than spray- and laser-based ion sources.
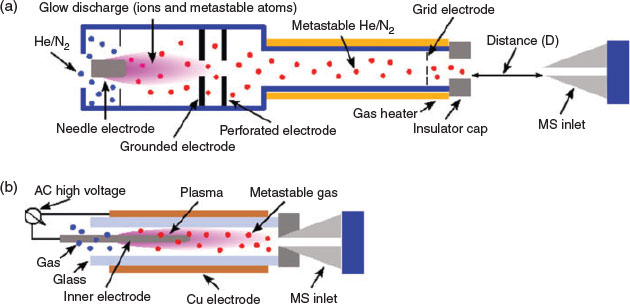
Two of the most widely used types of plasma ionization sources are direct analysis in real time (DART)[9,14,22] and dielectric barrier discharge ionization (DBDI),[15,17,20,23] which can both be used to sample analytes from air,[24,25] liquids,[17] and surfaces.[15] DART and DBDI are mechanistically similar to atmospheric pressure chemical ionization and atmospheric pressure photoionization.[22,26] In DART, a gas that is typically helium is directed through a chamber past a corona discharge pin, which creates a glow discharge consisting of ions and metastable atoms (Fig. 1a). Ions carried by the glow discharge are removed by a downstream electrode set and metastable atoms are heated as they exit the DART nozzle into the atmosphere to ionize molecules (Fig. 1a). DART ionization primarily occurs via the Penning ionization of water molecules (Eqn 1) to form protonated water clusters that can protonate analyte molecules (M) for detection in positive mode MS (Eqn 2).[22]
|


For analytes with low gas-phase basicity values and low polarity, molecular ions can be formed by Penning ionization of the analyte molecule, resulting in the formation of radical cations as opposed to even-electron protonated molecules.[27,28]
In dielectric barrier discharge ionization,[15,17,20,23] a gas flow is ionized by applying a high voltage and high-frequency alternating current between two electrodes that are separated by a dielectric barrier. In dielectric barrier discharge, the resulting plasma can be classified as a ‘low-temperature plasma’ in cases where the ion and electron effective temperatures are near ambient temperature and the electron density in the plasma is relatively low (<1019 m−3 versus 1021 to 1026 m−3 for arc plasmas).[29] In DBDI MS,[15,17,20,23] a low-temperature plasma plume is used to desorb and ionize molecules from surfaces and volatile molecules in the ambient air. The DBDI plasma is maintained by a positive pressure of a gas (e.g. He, N2, air) generally from a compressed cylinder. In positive-mode ionization, molecules are typically ionized in the plasma by gas-phase proton-transfer reactions with protonated water clusters (Eqn 2).[7] Generally, plasma-based ionization methods are limited to relatively small molecules (less than ~800 Da) with a wide range of polarities.[30,31] However, it was demonstrated recently that DBDI can be used to directly desorb and ionize peptides and proteins for analysis by MS.[32]
Several innovative dielectric barrier discharge-based ambient ionization sources have been developed, including a low-temperature plasma probe,[31] plasma-assisted desorption ionization,[33] and active capillary DBDI (Fig. 1b).[34] In active capillary DBDI (Fig. 1b), a dielectric barrier discharge plasma ionizes analyte molecules as they flow into the mass spectrometer resulting from the vacuum differential between the first pumping stage of the mass spectrometer and the atmosphere. This approach eliminates the need for any compressed gas cylinders and the size of the plasma is <1 cm3, which is more than an order of magnitude smaller than the plasma volume typically used by DART. Recently, we demonstrated that by use of a square-waveform dielectric barrier discharge driven by an H-bridge circuit, active capillary DBDI can be operated continuously for more than 12 h using a standard 9-V battery and additional electrical components that cost less than US$100.[20] Thus, active capillary DBDI can be considered ideal for integration with portable mass spectrometers.[15] Using a portable mass spectrometer and active capillary DBDI, chemical warfare agent simulants can be detected in air at less than 10 ppb.[24,25] For more complex mixtures, active capillary DBDI can be directly integrated with solid-phase microextraction (SPME) to reduce ion suppression effects.[17,35] For example, we have demonstrated chemical warfare agent simulants can be detected directly from urine and waterway samples in less than 2 min at trace levels (<100 ppb) using SPME active capillary DBDI MS.[17]
An important characteristic of an ion source is the extent of energy that is deposited into ions during formation. Thermometer ions can be used to determine the extent of ion activation on formation[20,23,28,36,37] and storage,[38] and during ion activation.[39–43] Benzylpyridiniums have been widely used as thermometer ions for characterizing the extent of energy deposition during ion formation,[37] primarily for spray[44] and laser desorption[45]-based ionization techniques. The bond dissociation energies (BDE) of substituted benzylpyridiniums depend strongly on the substituent, which can attenuate the electron density in the C–N bond. Using the ‘survival yield’ method,[36] ion internal energy distributions can be estimated by comparing the relative fragmentation of several 4-substituted benzylpyridinium ions with their BDE values. However, many plasma-based ionization techniques, including DBDI, DART and atmospheric pressure chemical ionization (APCI), primarily form ions from neutral molecules via proton-transfer reactions. Because benzylpyridiniums have a fixed quaternary charge site and cannot be protonated in the gas phase, we recently developed 4-substiuted benzylammonium thermometer ions (Scheme 1) to investigate the extent of internal energy deposition on ion formation in active capillary DBDI and APCI.[23] Benzylammonium thermometer ions have the advantages that: (i) the internal energies of ions formed by proton-transfer reactions can be characterized; (ii) they are readily available from commercial sources; and (iii) their ion fragmentation is highly thermosensitive owing to their BDEs being 60 kJ mol−1 lower than the corresponding benzylpyridinium thermometer ions.[20,23] Using such benzylammonium thermometer ions, we demonstrated that DBDI can be significantly softer than APCI;[20,23] i.e. the average internal energy distributions of ions formed using DBDI was 125 kJ mol−1 compared with 189 kJ mol−1 using APCI. In addition, benzylammonium thermometer ions were used to demonstrate that the power consumed by the DBDI source could be reduced by 100× using a square waveform versus sine and triangle waveforms, without increasing the extent of internal ion activation.[20] However, the extent of internal energy deposition on ion formation by the two most widely used plasma-based ambient ionization methods, DART and DBDI, have not been compared.
|
Previously, Fernandez and coworkers investigated the internal energy distributions of benzylpyridiniums formed by atmospheric pressure thermal desorption ionization (APTDI; 80°C) followed by ion transfer in the presence of a DART metastable atom stream.[28] Ions formed in the APTDI–DART processes had significantly higher internal energy distributions than those formed by electrospray ionization (ESI);[28] i.e. ESI can be significantly ‘softer’ than APTDI/DART. By use of higher gas drying temperatures for both DART and ESI, the internal energy distributions shifted to higher values, indicating thermal ion activation.[28] Here, the extent of internal energy deposition in DART is directly compared with DBDI and APCI using 4-substituted benzylammonium thermometer ions. The use of such thermometer ions enables the DART process to be investigated in the absence of any effects of APTDI on the extent on ion activation. The present study is the first systematic comparison between the extent of energy deposition in DBDI, DART, and APCI.
Results and Discussion
Dissociation Pathways
DART MS of the vapour above an aqueous solution containing a mixture of seven 4-substituted benzylamines (R = –H, –CH3, –F, –Cl, –C(CH3)3, –CF3, and –CN; 100 μM each) resulted in the formation of corresponding protonated benzylamines in relatively high abundance for R = –H, –CH3, –F, –C(CH3)3, and –CF3 (Fig. 2a). 4-Chlorobenzylammonium and 4-cyanobenzylammonium were formed in significantly lower abundances (<10 % of the base peak) than the other five benzylammonium ions (Fig. 2a) owing to ion suppression effects and/or low volatility. Thus, the latter two ions were excluded from use as thermometer ions (see below). The ion source of the mass spectrometer includes a capillary entrance, tube lens, and skimmer (see diagram in ref. [23]).[23] By increasing the voltage applied to the tube lens relative to the skimmer lens, ions can be accelerated under a pressure of ~0.2 Pa during ion transfer to the ion trap before mass analysis, which results in collision-induced dissociation (CID) in the ion source (in-source CID). By use of in-source CID, benzylammonium precursor ions lose a small neutral molecule (−17 Da), which corresponds to the loss of ammonia (Scheme 1). For example, nearly all the protonated benzylamine precursor ion abundance was converted to product ions corresponding to 4-substituted benzylium (or tropylium) by use of an in-source CID voltage of 65 V (Fig. 2). To confirm this, isolation and collisional activation of 4-benzylammonium (calculated BDE of 163.4 kJ mol−1; Table S1, Supplementary Material)[23] in the ion trap (in-trap CID) resulted in the exclusive loss of a neutral molecule (−17 Da) corresponding to ammonia (Fig. 2c). In-trap CID of 4-trifluoromethylbenzylammonium (calculated BDE of 184.5 kJ mol−1; Table S1, Supplementary Material)[23] also resulted in the loss of ammonia as the exclusive fragmentation pathway. The exclusive loss of ammonia by the CID of benzylammonium thermometer ions is consistent with that reported in the literature.[23]

|
Bond Dissociation Energies
In the survival yield method, the BDEs of thermometer ions are required. The calculated 298-K BDEs of 4-substituted benzylammonium ions for the loss of ammonia (Scheme 1) used in the present work were obtained from the literature (Table S1, Supplementary Material).[23] For benzylammonium, the calculated BDE value (163.4 kJ mol−1; CAM-B3LYP/6–311++G(d,p)) is within 3 kJ mol−1 of the experimental BDE value (166.0 ± 3.7 kJ mol−1) that was obtained from experimental measurements.[46] The calculated BDEs of a set of 20 heterolytic reactions using CAM-B3LYP/6–311++G(d,p) were within an average absolute error of 8 kJ mol−1 of those obtained from measurements.[23] Thus, CAM-B3LYP/6–311++G(d,p)-calculated BDEs are used for the survival yield method in the present work.[23]
Breakdown Curves and Internal Energy Distributions
In Fig. S1 (Supplementary Material), the extent of ion fragmentation is plotted as a function of the in-source CID voltage for five thermometer ions formed by use of DART, APCI, and DBDI coupled to a linear quadrupole ion-trap mass spectrometer (see Methods below). As the collision voltage increases, the extent of ion dissociation increases. For DART, the 4-substituted benzylammonium ion with the weakest C–N bond (4-tert-butylbenzylammonium, calculated BDE of 134.5 kJ mol−1) required a collision voltage of ~8 V to result in the fragment ion having the same abundance as that of the precursor ion (50 % fragmentation yield). In contrast, 4-trifluoromethylbenzylammonium (calculated BDE of 184.5 kJ mol−1) required a collision voltage of 12.5 V to obtain a fragmentation yield of 50 %. For APCI, the collision energies required to obtain fragmentation yields of 50 % were shifted to higher voltages of between 15 and 25 V depending on the thermometer ion. In contrast, for DBDI, the in-source CID voltages required to fragment the precursor ions by 50 % were between 20 and 33 V to obtain the same fragmentation yields as DART. That is, ions formed using DART have higher internal energies than those formed by APCI and DBDI. In other words, DBDI can be considered a ‘softer’ ion source than both APCI and DART under these conditions.
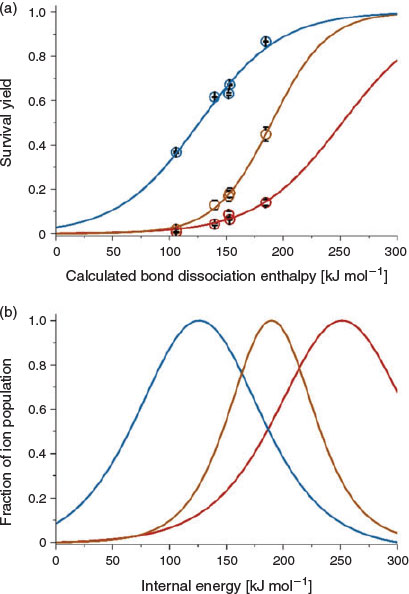
In Fig. 3, the survival yields (SYs) that were obtained using an in-source CID voltage of 20 V are plotted as a function of the BDE for the five benzylammonium thermometer ions (R = –H, –CH3, –F, –C(CH3)3, and –CF3) formed by DART, APCI, and DBDI (capillary entrance to the MS was set to 250°C). For a constant in-source CID voltage, the extent that ions fragment decreases as the BDEs of the benzylammoniums increases. For example, using an in-source CID voltage of 20 V in DART, 4-tert-butylbenzylammonium (BDE of 134.5 kJ mol−1) has an SY of 9 %, whereas 4-trifluoromethylbenzylammonium (BDE of 184.5 kJ mol−1) has an SY of 15 %. In the SY method, relative internal energy distributions are obtained by (i) fitting plots of SY vs BDE data with a sigmoid function, and (ii) taking the derivative of the sigmoid.[36,37,44] In Fig. 3, the relative internal energy distributions of benzylammonium ions formed by DART, APCI, and DBDI are shown. The average internal energy distributions obtained for DART are 62 and 126 kJ mol−1 higher than APCI and DBDI respectively; i.e. DART is a significantly ‘harsher’ ion source compared with APCI and DBDI under these conditions.
|
Effect of Capillary Temperature
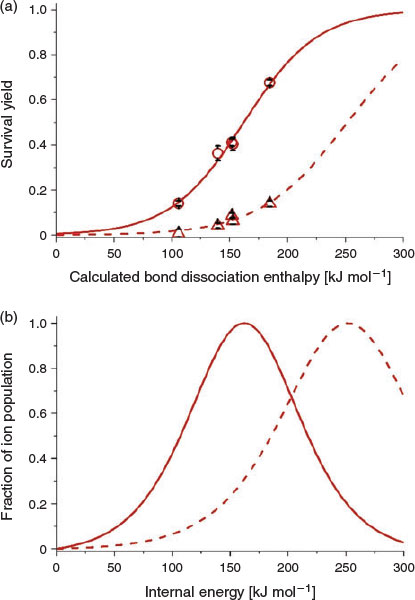
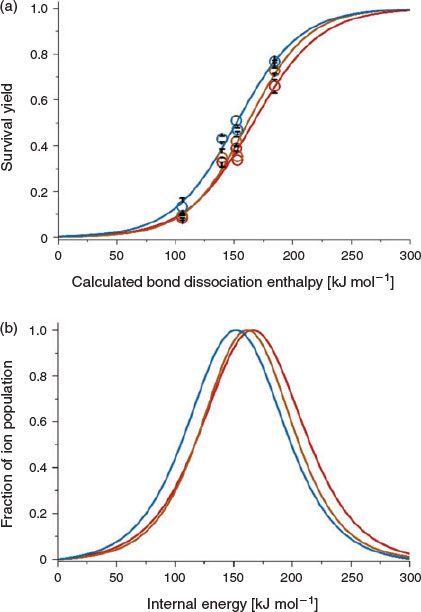
The extent of energy deposition in the formation and ion transfer of benzylammonium ions can be reduced by decreasing the temperature of the capillary entrance to the mass spectrometer. For example, in Fig. 4, the SYs (20 V in-source CID) of five benzylammonium thermometer ions formed using DART are plotted as a function of BDE for capillary entrance temperatures of 150 and 250°C. The DART source temperature was 150°C and the distance of the DART source from the capillary entrance to the MS (Fig. 1) was 25 mm, which were the softest conditions that yielded sufficient ion signal to obtain internal energy distributions under these conditions (see below). On changing the capillary entrance temperature from 250 to 150°C, the average internal energy distribution obtained using DART decreased by 90 kJ mol−1 (Fig. 4), which is comparable with the reduction in the average internal energy distributions for APCI (decrease of 62 kJ mol−1) and DBDI (126 kJ mol−1). Thus, the capillary temperature can significantly affect the extent of molecular ion survival for ions with labile bonds in DART ionization.
|
Solvent Effects
A major difference between benzylammonium thermometer ions[20,23] compared with benzylpyridinium thermometer ions[47–49] is that benzylammonium can be deprotonated. To investigate, SYs and internal energy distributions were obtained for five benzylammonium ions formed using DART from water (gas-phase basicity, GB, of 660 kJ mol−1), methanol (GB of 725 kJ mol−1), and acetonitrile (GB of 748 kJ mol−1). In general, solvent can affect the survival yield in DART MS slightly (Fig. 5). For example, the SY of 4-methylbenzylammonium (139.7 kJ mol−1) is 36, 26, and 15 % when formed from water, methanol, and acetonitrile under these conditions (in-source CID of 20 V). Moreover, the average internal energies of the ions formed from water, methanol, and acetonitrile solutions are within 15 % of each other (a maximum difference of 25 kJ mol−1 between the average internal energy distributions for water versus acetonitrile). These data indicate that the internal energy distributions depend minimally on the solvent that is used under these conditions, which is consistent with the results for DBDI and APCI reported elsewhere.
|
DART Source Distance and Temperature
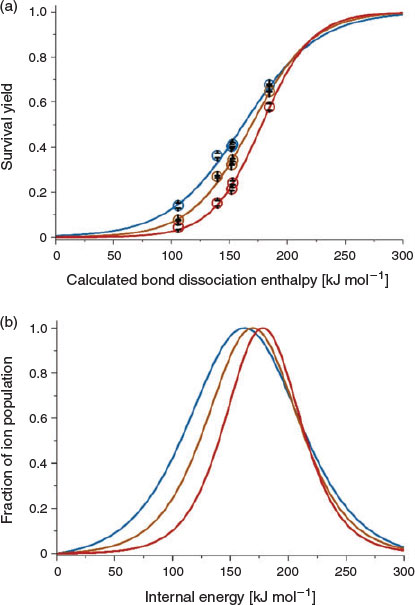
One of the most important parameters in optimizing DART MS measurements is the distance between the DART emitter and the capillary entrance to the mass spectrometer (Fig. 1). In Fig. 6, internal energy distributions that were obtained as a function of the distance of the DART emitter from the capillary entrance (10 to 25 mm) are shown. DART emitter nozzles are typically positioned between 8 and 15 mm from the entrances of mass spectrometers.[50–52] The sample vial that delivers analyte vapour to the DART source was kept in the same position for all experiments (~1 cm below the capillary entrance to the mass spectrometer). The temperature of the capillary entrance to the mass spectrometer was set to 150°C, which is the minimum temperature that enabled the detection of benzylammonium in reasonably high abundances under these conditions. All other parameters were kept constant except for the DART emitter position (Fig. 1a). As the distance between the DART emitter and the capillary entrance to the MS is increased from 10 to 25 mm, the internal energy distributions shift slightly to lower values (from 167 to 152 kJ mol−1). These results indicate that the extent of molecular ion survival can be slightly improved by increasing the DART distance from the MS entrance. For example, the SY of 4-fluorobenzylammonium (152.8 kJ mol−1) using an in-source voltage of 20 V is 51, 41, and 38 % when using DART source distance of 25, 18, and 10 mm respectively. The longer distances should result in cooling of the DART gas stream before analyte ionization, which may contribute to the lower internal energy deposition from use of longer DART distances.
|
Harris and Fernández measured and calculated the temperature between the DART emitter and the capillary entrance to the mass spectrometer (30 mm; on-axis) at different positions along the axis between the DART emitter and the entrance to the MS.[53] Using a DART temperature of 270°C, the temperature in the sampling region decreased from 124 to 117°C from a position near the DART source to that near the capillary entrance to the MS.[53] These results indicate that the DART gas stream cools moderately as it travels towards the MS,[53] which is consistent with our results. The effect of the distance between the DART source and MS inlet on the extent of molecular ion survival has not been reported in the literature previously. However, sampling analytes closer to the DART source than the MS can result in the formation of molecular ions corresponding to the loss of an electron via Penning ionization (as opposed to protonation of the analyte).[22,27,28,54] No evidence of Penning ionization was observed for DART ionization of the 4-substituted benzylamine molecules used here.
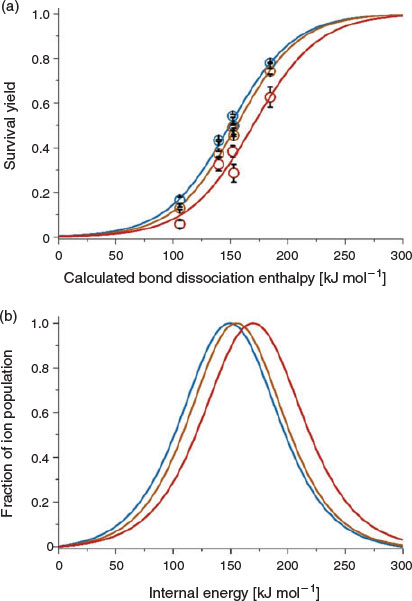
In Fig. 7, internal energy distributions for thermometer ions formed using a DART source temperature of 150, 250, and 350°C are shown. The DART source was placed at the ‘optimal’ distance of 25 mm from the inlet to the MS (heated to 150°C) and all other parameters were kept constant, except for the DART source temperature (150 to 350°C). The extent of energy deposition increased from 150 to 170 kJ mol−1 as the DART temperature increased from 150 to 350°C, which indicates thermal ion activation increased. For example, the SY of 4-trifluoromethylbenzylammonium (184.5 kJ mol−1) at 20 V in-source CID is 78, 74, and 63 % using a DART source temperature of 150, 250, and 350°C respectively. Thus, the extent of internal energy deposition into the ions on formation and transfer using DART increases slightly as the DART temperature increases. Overall, these results suggest that under the ‘softest’ DART conditions that were used to generate abundant ion signal, the extent of internal energy deposition in DBDI was significantly less than that of either APCI or DART over a somewhat wide range of conditions.
|
Conclusions
The extent of internal energy deposition on ion formation by DART, APCI, and active capillary DBDI was directly compared using 4-substituted benzylammonium ‘thermometer’ ions. In DART, the average internal energy distributions increased slightly (by 12 %) from 148 to 169 kJ mol−1 as the DART temperature increased from 150 to 350°C, which is consistent with thermal ion activation. The extent of ion activation also increased slightly as the DART nozzle emitter was positioned closer to the capillary entrance to the mass spectrometer. Thus, the internal energies of ions formed by DART can be reduced slightly by: (i) lowering the temperature used to heat the metastable atom beam; (ii) positioning the DART nozzle emitter further from the mass spectrometer entrance; and (iii) decreasing the temperature of the capillary entrance to the mass spectrometer. However, the internal energy distribution obtained using DBDI (average of 126 kJ mol−1) was significantly lower than that of DART (252 kJ mol−1) and APCI (190 kJ mol−1) for a wide range of conditions. Given that DBDI can be used to form ions with exceedingly low internal energies compared with APCI and DART, it is anticipated that the extent of internal energy deposition in DBDI will be nearly the same as that obtained by use of highly ‘soft’ spray-based ion sources, including ESI and nanoelectrospray ionization.
Methods
For all experiments, solutions contained 100 µM of each of the five 4-substituted benzylamine molecules in water, methanol, or acetonitrile. The samples were transferred to the ionization source by vapour pressure from a 1.5-mL vial that was positioned ~1 cm below the inlet to the MS capillary. Experiments were performed using a linear quadrupole ion-trap mass spectrometer (LTQ XL; Thermo Fisher Scientific, San Jose, CA, USA). For DBDI, a home-built plasma source with co-axial geometric configuration with a 1.2-mm air gap between the electrodes was used to generate a plasma (Fig. 1b).[20,23] The plasma was formed using a 2-kV, 10-kHz square waveform with an input voltage of 10 V DC. For APCI (Ion Max API Source, Thermo Scientific), a 3-µA corona discharge was initiated and maintained by application of 3–4 kV to an APCI needle. For DART experiments (IonSense, Saugus, MA, USA), the ion source was operated in the positive mode with helium as the reactive gas (DART distance of 10 to 25 mm; Fig. 1). The capillary temperature was set to 150°C unless specified otherwise.
For in-trap CID, an isolation window of m/z 1.8 (centred on the ion of interest) and normalized collision energies of 20 to 30 % were used. To obtain SY values, the in-source fragmentation voltage was varied from 0 to 100 V in 5-V increments (data collected in triplicate) and all other voltages were kept constant. The SY method in ref. [23] was used to estimate ion internal energy distributions and these were obtained from collision energy breakdown curves of benzylammonium ion fragmentation data. For all internal energy distributions reported in this work, an in-source CID voltage of 20 V was used. A detailed description of the SY method (theory and calculations) and data analysis can be found in ref. [23]. The best fit sigmoid functions for Figs 3–7 are given in Table S2 (Supplementary Material).
Supplementary Material
Calculated bond dissociation energies of benzylammonium thermometer ions, parameters of best fit sigmoid curves for Figs 3–7, and plots of 4-substituted benzylammonium survival yields versus in-source CID voltage are available on the Journal’s website.
Conflicts of Interest
G.N.K. is the managing director of Accurate Mass Scientific, the Australian distributor of DART ion sources.
Acknowledgements
The authors thank the Australian Research Council for funding (grant no. DE130100424). IonSense Inc. and Accurate Mass Scientific are acknowledged for the use of the DART ion source. Professor Richard O’Hair (University of Melbourne) is thanked for helpful discussions.
References
[1] R. Javanshad, A. R. Venter, Anal. Methods 2017,| Crossref | GoogleScholarGoogle Scholar |
[2] P. Pruski, D. A. MacIntyre, H. V. Lewis, P. Inglese, G. D. S. Correia, T. T. Hansel, P. R. Bennett, E. Holmes, Z. Takats, Anal. Chem. 2017, 89, 1540.
| Crossref | GoogleScholarGoogle Scholar | 1:CAS:528:DC%2BC28XitFGgt7rI&md5=eda861e9c2587f40b8f0dc731ac9a2a6CAS |
[3] A. K. Jarmusch, C. M. Alfaro, V. Pirro, E. M. Hattab, A. A. Cohen-Gadol, R. G. Cooks, PLoS One 2016, 11, e0163180.
| Crossref | GoogleScholarGoogle Scholar |
[4] F. A. M. G. van Geenen, M. C. R. Franssen, A. H. M. Schotman, H. Zuilhof, M. W. F. Nielen, Anal. Chem. 2017, 89, 4031.
| Crossref | GoogleScholarGoogle Scholar | 1:CAS:528:DC%2BC2sXjs1Kgs7s%3D&md5=26ce8a7f4a2db6a1335a41443379d868CAS |
[5] M. T. Bokhart, D. C. Muddiman, Analyst 2016, 141, 5236.
| Crossref | GoogleScholarGoogle Scholar | 1:CAS:528:DC%2BC28XhtFymsLbF&md5=e493a2c6874bc9b7ef5e934b274c90cdCAS |
[6] S.-C. Cheng, C. Shiea, Y.-L. Huang, C.-H. Wang, Y.-T. Cho, J. Shiea, Anal. Methods 2017,
| Crossref | GoogleScholarGoogle Scholar |
[7] J. Chen, F. Tang, C. Guo, S. Zhang, X. Zhang, Anal. Methods 2017,
| Crossref | GoogleScholarGoogle Scholar |
[8] J. Srbek, B. Klejdus, M. Douša, J. Břicháč, P. Stasiak, J. Reitmajer, L. Nováková, Talanta 2014, 130, 518.
| Crossref | GoogleScholarGoogle Scholar | 1:CAS:528:DC%2BC2MXhsVejur0%3D&md5=e4ef3e1d6c23e2d33f7f0c771d3cab87CAS |
[9] M. J. Pavlovich, B. Musselman, A. B. Hall, Mass Spectrom. Rev. 2016, 9999, 1.
[10] J. A. R. Teodoro, H. V. Pereira, D. N. Correia, M. M. Sena, E. Piccin, R. Augusti, Anal. Methods 2017,
[11] A. M. Bruno, S. R. Cleary, A. E. O’Leary, M. C. Gizzi, C. C. Mulligan, Anal. Methods 2017,
[12] M. C. Bridoux, A. Schwarzenberg, S. Schramm, R. B. Cole, Anal. Bioanal. Chem. 2016, 408, 5677.
| Crossref | GoogleScholarGoogle Scholar | 1:CAS:528:DC%2BC28XhtVWlurnL&md5=667b36c05a55ac3ddb93810e04011a9fCAS |
[13] T. P. Forbes, E. Sisco, M. Staymates, G. Gillen, Anal. Methods 2017,
| Crossref | GoogleScholarGoogle Scholar |
[14] H. Brown, B. Oktem, A. Windom, V. Doroshenko, K. Evans-Nguyen, Forensic Chem. 2016, 1, 66.
| Crossref | GoogleScholarGoogle Scholar |
[15] M. Dumlao, P. M.-L. Sinues, M. Nudnova, R. Zenobi, Anal. Methods 2014, 6, 3604.
| Crossref | GoogleScholarGoogle Scholar | 1:CAS:528:DC%2BC2cXotFOhsbY%3D&md5=c742a4539190da2afe63f4f814c57d4fCAS |
[16] P. A. D’Agostino, C. L. Chenier, Rapid Commun. Mass Spectrom. 2010, 24, 1617.
| Crossref | GoogleScholarGoogle Scholar | 1:CAS:528:DC%2BC3cXmt12mtbc%3D&md5=639cc39ec4d5f9b1e9c881d4ae827277CAS |
[17] M. C. Dumlao, L. E. Jeffress, J. J. Gooding, W. A. Donald, Analyst 2016, 141, 3714.
| Crossref | GoogleScholarGoogle Scholar | 1:CAS:528:DC%2BC28XktV2ltL4%3D&md5=cbf1a75795d330ea84597f47dcd53988CAS |
[18] S. Li, X. Wang, L. Liu, Y. Guo, Q. Mu, A. Mellouki, Environ. Sci. Pollut. Res. Int. 2017, 24, 15794.
| Crossref | GoogleScholarGoogle Scholar | 1:CAS:528:DC%2BC2sXptFeksb0%3D&md5=8276f93387e4461a2620f26f13caef21CAS |
[19] A. Schütz, S. Brandt, S. Liedtke, D. Foest, U. Marggraf, J. Franzke, Anal. Chem. 2015, 87, 11415.
| Crossref | GoogleScholarGoogle Scholar |
[20] M. C. Dumlao, D. Xiao, D. Zhang, J. Fletcher, W. A. Donald, J. Am. Soc. Mass Spectrom. 2017, 28, 575.
| Crossref | GoogleScholarGoogle Scholar | 1:CAS:528:DC%2BC28XhvVagsLnF&md5=cc482949f1cb05267e8bc29883f14eedCAS |
[21] J. I. Zhang, N. Talaty, A. B. Costa, Y. Xia, W. A. Tao, R. Bell, J. H. Callahan, R. G. Cooks, Int. J. Mass Spectrom. 2011, 301, 37.
| Crossref | GoogleScholarGoogle Scholar | 1:CAS:528:DC%2BC3MXjvVKktLw%3D&md5=928db3a36632421fb089ed2aca68a27bCAS |
[22] J. Gross, Anal. Bioanal. Chem. 2014, 406, 63.
| Crossref | GoogleScholarGoogle Scholar | 1:CAS:528:DC%2BC3sXhsVCis7jP&md5=db1bce8a2a6501a6e03093bea9d864d1CAS |
[23] E. R. Stephens, M. Dumlao, D. Xiao, D. Zhang, W. A. Donald, J. Am. Soc. Mass Spectrom. 2015, 26, 2081.
| Crossref | GoogleScholarGoogle Scholar | 1:CAS:528:DC%2BC2MXhs1WqtL%2FN&md5=893d665207631c7c623638793ef1af79CAS |
[24] J.-C. Wolf, M. Schaer, P. P. Siegenthaler, R. Zenobi, Eur. J. Mass Spectrom. 2015, 21, 305.
| Crossref | GoogleScholarGoogle Scholar | 1:CAS:528:DC%2BC28XovFyqtQ%3D%3D&md5=0ed1b4b0a423ca7f3f7111ef654683c8CAS |
[25] J.-C. Wolf, R. Etter, M. Schaer, P. Siegenthaler, R. Zenobi, J. Am. Soc. Mass Spectrom. 2016, 27, 1197.
| Crossref | GoogleScholarGoogle Scholar | 1:CAS:528:DC%2BC28XkvFGksL8%3D&md5=920155e65749a97ff10d4ae732c2d8f7CAS |
[26] J. H. Gross, Mass Spectrometry 2017 (Springer: Berlin).
[27] R. B. Cody, A. J. Dane, in Ambient Ionization Mass Spectrometry (Eds M. Domin, R. Cody) 2015, pp. 23–57 (The Royal Society of Chemistry: London).
[28] M. Zhou, J. F. McDonald, F. M. Fernández, J. Am. Soc. Mass Spectrom. 2010, 21, 68.
| Crossref | GoogleScholarGoogle Scholar |
[29] R. Hippler, S. Pfau, M. Schmidt, K. H. Schoenbach, Low-Temperature Plasma Physics: Fundamental Aspects and Applications 2001 (Wiley-VCH: Berlin).
[30] N. Na, C. Zhang, M. Zhao, S. Zhang, C. Yang, X. Fang, X. Zhang, J. Mass Spectrom. 2007, 42, 1079.
| Crossref | GoogleScholarGoogle Scholar | 1:CAS:528:DC%2BD2sXpsVGmtr8%3D&md5=94b3f1ea786f9e219fecca4887bd081bCAS |
[31] J. D. Harper, N. A. Charipar, C. C. Mulligan, X. Zhang, R. G. Cooks, Z. Ouyang, Anal. Chem. 2008, 80, 9097.
| Crossref | GoogleScholarGoogle Scholar | 1:CAS:528:DC%2BD1cXhtlaktb%2FI&md5=0406747f6cdc0f77c06ebfdf451461b7CAS |
[32] Y. Zhao, Z. Wei, H. Zhao, J. Jia, Z. Chen, S. Zhang, Z. Ouyang, X. Ma, X. Zhang, Anal. Chem. 2016, 88, 10805.
| Crossref | GoogleScholarGoogle Scholar | 1:CAS:528:DC%2BC28XhslWjsLjJ&md5=9e1adeca5691b9aa3943e25bea250347CAS |
[33] R. B. Cody, J. A. Laramée, H. D. Durst, Anal. Chem. 2005, 77, 2297.
| Crossref | GoogleScholarGoogle Scholar | 1:CAS:528:DC%2BD2MXit1ahurk%3D&md5=a00cf715042d492d8c2ec58f0352a187CAS |
[34] M. M. Nudnova, L. Zhu, R. Zenobi, Rapid Commun. Mass Spectrom. 2012, 26, 1447.
| Crossref | GoogleScholarGoogle Scholar | 1:CAS:528:DC%2BC38XmvF2msr0%3D&md5=f37c76eae2a0b611b917eec6100134d1CAS |
[35] M. F. Mirabelli, J.-C. Wolf, R. Zenobi, Anal. Chem. 2016, 88, 7252.
| Crossref | GoogleScholarGoogle Scholar | 1:CAS:528:DC%2BC28XhtVCjsbfJ&md5=d7d0004fee11a0f52d288c4221797356CAS |
[36] V. Gabelica, E. De Pauw, M. Karas, Int. J. Mass Spectrom. 2004, 231, 189.
| Crossref | GoogleScholarGoogle Scholar | 1:CAS:528:DC%2BD2cXhtVCqsbg%3D&md5=134fdb64b974526f6dd575ebd7a7a9e6CAS |
[37] M. Nefliu, J. N. Smith, A. Venter, R. G. Cooks, J. Am. Soc. Mass Spectrom. 2008, 19, 420.
| Crossref | GoogleScholarGoogle Scholar | 1:CAS:528:DC%2BD1cXjtlWjs70%3D&md5=8c2a0cbc47e4fd9bf3d36eddee778a83CAS |
[38] W. A. Donald, G. N. Khairallah, R. A. J. O’Hair, J. Am. Soc. Mass Spectrom. 2013, 24, 811.
| Crossref | GoogleScholarGoogle Scholar | 1:CAS:528:DC%2BC3sXnsVWnu7o%3D&md5=43b6afeb048a29e85c6e2bff949f3d5aCAS |
[39] A. I. S. Holm, W. A. Donald, P. Hvelplund, M. K. Larsen, S. B. Nielsen, E. R. Williams, J. Phys. Chem. A 2008, 112, 10721.
| Crossref | GoogleScholarGoogle Scholar | 1:CAS:528:DC%2BD1cXht1Sjt73N&md5=5108d71472de68901c12a3ced8a1084aCAS |
[40] W. A. Donald, R. D. Leib, M. Demireva, E. R. Williams, J. Am. Chem. Soc. 2011, 133, 18940.
| Crossref | GoogleScholarGoogle Scholar | 1:CAS:528:DC%2BC3MXhtlWrs7fJ&md5=c607984b86b61c0eade6eb38a4aaa45cCAS |
[41] W. A. Donald, E. R. Williams, Pure Appl. Chem. 2011, 83, 2129.
| Crossref | GoogleScholarGoogle Scholar | 1:CAS:528:DC%2BC3MXhs1Orsb%2FO&md5=dc7110888181ad91b96cff464eb9453dCAS |
[42] I. W. Griffiths, E. S. Mukhtar, R. E. March, F. M. Harris, J. H. Beynon, Int. J. Mass Spectrom. Ion Phys. 1981, 39, 125.
| Crossref | GoogleScholarGoogle Scholar | 1:CAS:528:DyaL3MXltl2jtLg%3D&md5=7cf79864c19322fa313223447f77dbfdCAS |
[43] H. I. Kenttämaa, R. G. Cooks, Int. J. Mass Spectrom. Ion Process. 1985, 64, 79.
| Crossref | GoogleScholarGoogle Scholar |
[44] K. V. Barylyuk, K. Chingin, R. M. Balabin, R. Zenobi, J. Am. Soc. Mass Spectrom. 2010, 21, 172.
| Crossref | GoogleScholarGoogle Scholar | 1:CAS:528:DC%2BC3cXjslykuw%3D%3D&md5=5a2cb31149608a5aa460d8128d1a62b9CAS |
[45] J. F. Greisch, V. Gabelica, F. Remacle, E. De Pauw, Rapid Commun. Mass Spectrom. 2003, 17, 1847.
| Crossref | GoogleScholarGoogle Scholar | 1:CAS:528:DC%2BD3sXmtlyqsLg%3D&md5=94b8f97105b0f47d1a8323dc8e61d05dCAS |
[46] Y.-R. Luo, Comprehensive Handbook of Chemical Bond Energies 2007 (CRC Press: Boca Raton, FL).
[47] D. Morsa, V. Gabelica, F. Rosu, J. Oomens, E. De Pauw, J. Phys. Chem. Lett. 2014, 5, 3787.
| Crossref | GoogleScholarGoogle Scholar | 1:CAS:528:DC%2BC2cXhslKktr%2FM&md5=1f84556ff05362dd90ee559fb6b4b3e9CAS |
[48] J. E. Carpenter, C. P. McNary, A. Furin, A. F. Sweeney, P. B. Armentrout, J. Am. Soc. Mass Spectrom. 2017, 28, 1876.
| 1:CAS:528:DC%2BC2sXotVOms7k%3D&md5=3f2d6f82bf9ac30e83f727a6273485c6CAS |
[49] D. Gatineau, A. Memboeuf, A. Milet, R. B. Cole, H. Dossmann, Y. Gimbert, D. Lesage, Int. J. Mass Spectrom. 2017, 417, 69.
| Crossref | GoogleScholarGoogle Scholar | 1:CAS:528:DC%2BC2sXlvVSqsb0%3D&md5=9874bbc28edb631d00de875bb94047f5CAS |
[50] D. Al-Balaa, A. Rajchl, A. Grégrová, R. Ševčík, H. Čížková, J. Mass Spectrom. 2014, 49, 911.
| Crossref | GoogleScholarGoogle Scholar | 1:CAS:528:DC%2BC2cXhsFOlsLvM&md5=b37f57edd18603d586583fecdd998611CAS |
[51] M. G. Mazzotta, J. O. E. Young, J. W. Evans, L. A. Dopierala, Z. A. Claytor, A. C. Smith, C. Snyder, N. C. Tice, D. L. Smith, Anal. Methods 2015, 7, 4003.
| Crossref | GoogleScholarGoogle Scholar | 1:CAS:528:DC%2BC2MXmsFehtL0%3D&md5=650e4f9d3225bea7f6b04667b260bfbcCAS |
[52] A. T. Navare, J. G. Mayoral, M. Nouzova, F. G. Noriega, F. M. Fernández, Anal. Bioanal. Chem. 2010, 398, 3005.
| Crossref | GoogleScholarGoogle Scholar | 1:CAS:528:DC%2BC3cXht1KnsrnJ&md5=d6c2cd77f3982449aeb20a135104520fCAS |
[53] G. A. Harris, F. M. Fernández, Anal. Chem. 2009, 81, 322.
| Crossref | GoogleScholarGoogle Scholar | 1:CAS:528:DC%2BD1cXhsVGnsLfE&md5=48a4c29dd8714324636174e86e66fadbCAS |
[54] L. Song, J. E. Bartmess, in Ambient Ionization Mass Spectrometry (Eds M. Domin, R. Cody) 2015, Ch. 3, pp. 58–103 (The Royal Society of Chemistry: London).
* W. Alexander Donald was the recipient of the 2016 RACI Physical Chemistry Division Lectureship and the 2016 RACI Analytical and Environmental Chemistry Division Peter W. Alexander Medal.