Alkali-Metal Modification of Li(Ni0.33Mn0.33Co0.33)O2*
Jimmy Wu A and Neeraj Sharma A BA School of Chemistry, University of New South Wales, Sydney, NSW 2052, Australia.
B Corresponding author. Email: Neeraj.sharma@unsw.edu.au
Australian Journal of Chemistry 72(8) 600-606 https://doi.org/10.1071/CH19114
Submitted: 8 March 2019 Accepted: 5 June 2019 Published: 27 June 2019
Abstract
Layered lithium transition metal oxides are widely used as cathodes in lithium-ion batteries and are continuously being developed to provide more energy. Here, the synthesis and structure of Li(Ni0.33Mn0.33Co0.33)O2, ‘Li0.9K0.1(Ni0.33Mn0.33Co0.33)O2’, and ‘Li0.9Cs0.1(Ni0.33Mn0.33Co0.33)O2’ are characterised in detail and compared with similar studies in the literature. Structural models are evaluated based on the statistical quality of fitting via the Rietveld method with X-ray diffraction data and the use of a range of starting structural models. Critically, this work highlights that the larger alkali atoms do not dope on to the Li sites but rather are likely to be distributed on the surface of the particles which is also evidenced with electron microscopy. This work showcases that care must be taken by researchers when using such doping regimes and the concentration of the dopants.
Introduction
The development of LiCoO2 (LCO) by Goodenough et al.[1] which adopts an α-NaFeO2 crystal structure,[2,3] and subsequent commercialisation of the first lithium-ion battery (LIB) in 1991 by Sony Corporation[4,5] introduced highly efficient methods to store energy for practical use in electronics, dominating the portable electronics market even today.[6,7] The initial success of LIBs was due to utilising the high charge-to-weight ratio of lithium – the third lightest element, with a low self-discharge rate[8] and high cyclability[9] compared with other secondary batteries, such as Ni-Cd, and high reversible specific capacities of 140 mAh g−1 at 4.2 V.[10] Their versatility for various commercial applications ranging from handheld electronics to large-scale energy grid storage[11,12] and electric vehicles[13] have made them quintessential in a continually advancing technological world. However, irreversible capacity fade at extended voltages (~4.2–4.4 V) occurs due to crystal symmetry changes from hexagonal to monoclinic[14] as Co3+ oxidises to Co4+. Continued work on improving LCO has led to the culmination and commercialisation of an isostructural second-generation cathode, Li(NixMnyCoz)O2 (NMC), specifically Li(Ni0.33Mn0.33Co0.33)O2 (NMC111). This composition exhibits higher reversible specific capacities of 150 mAh g−1 [15] due to the incorporation of Ni and Mn species onto the transition metal layer and uses the redox of Ni2+/Ni4+ during intercalation/deintercalation, producing stable reversible capacities as the Co3+/Co4+ reaction is inhibited until extreme levels of delithiation (around 0.33 > Li > 0).[16] Mn4+ has been proposed to also stabilise the structure as it, in principle, is chemically inert and does not contribute to any side reactions during cycling.[17]
Recent research has also considered doping on to the Li layer (3a sites) with alkali metal ions such as K+,[18] Na+,[19] or Rb+[20] in order to investigate changes in electrochemical performance. The concept is to stabilise the structure with a larger alkali atom at extended delithiation levels. When incorporating a larger atom, such as K (ionic radii in 6-fold coordination, IR = 1.38 Å) on the Li 3a site (IR = 0.76 Å), this should cause the lattice to expand along the 00l stacking axis for a solid solution case. Table 1 summarises recent publications which involve targeted doping of the Li-site of NMC with an alkali metal. Although all authors have demonstrated improved electrochemical performance in their materials, specifically an increase in capacity retention over time, the interpretation of the structural data in particular, and to an extent the electrochemical data, has led to a degree of confirmation bias, which will be examined in this work. Here, X-ray diffraction (XRD) data, coupled with Rietveld refinements, is used to provide an in-depth analysis of structural characteristics. Transmission electron microscopy (TEM) and energy dispersive X-ray spectroscopy (EDS) studies are used to argue whether the doping regimes used in this work and those reported earlier truly incorporate alkali metal ions into the targeted Li layer, or if they contribute to an increase in electrochemical performance in some other manner.
Results and Discussion
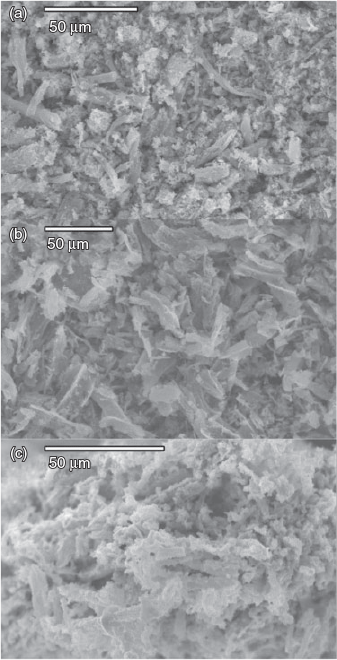
Scanning electron microscopy (SEM) analyses, shown in Fig. 1, reveal long string-like structures present throughout the parent, ‘Li0.9K0.1(Ni0.33Mn0.33Co0.33)O2’, and ‘Li0.9Cs0.1(Ni0.33Mn0.33Co0.33)O2’, which is likely due to the formation of the product along the surface of a strand of cotton, retaining the shape as it is burnt off during synthesis.
|
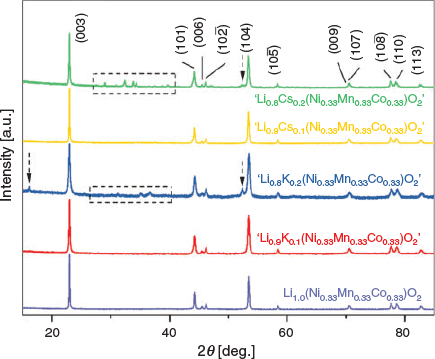
The XRD patterns are displayed in Fig. 2 of the synthesised parent, Li(Ni0.33Mn0.33Co0.33)O2, as well as the alkali-modified materials, ‘Li1−xKx(Ni0.33Mn0.33Co0.33)O2’ and ‘Li1−xCsx(Ni0.33Mn0.33Co0.33)O2’ (x = 0.1, 0.2). Both the K- and Cs-modified materials show phase purity at x = 0.1, however at x = 0.2, both show the formation of impurities (see additional peaks around 2θ 27°–40°) and as a result, these impure materials were not studied further. The diffraction patterns of ‘Li0.9K0.1(Ni0.33Mn0.33Co0.33)O2’ and ‘Li0.9Cs0.1(Ni0.33Mn0.33Co0.33)O2’ resemble the parent structure, as there are no new reflections, and peak intensities show no significant fluctuations. This indicates that the introduction of the K and Cs species does not significantly affect the layered structure. Although a downshift in all 00l reflections is expected (as larger cations are placed into the Li layer) in all synthesised materials, no significant shift was visible in any of these reflections.
|
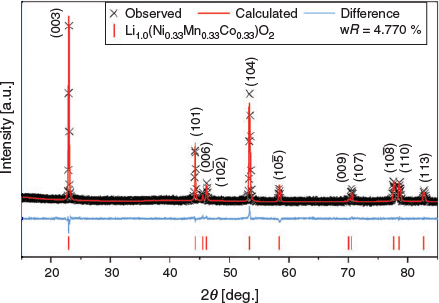
Rietveld analyses were applied to Li(Ni0.33Mn0.33Co0.33)O2 using a structural model[26] and the XRD data, as shown in Fig. 3. For simplicity, the parent is modelled without any Li/Ni cation mixing and full refinement parameters are reported in Table S1 (Supplementary Material). The fitting statistics and the lack of any significant impurities suggest a pure phase.
|
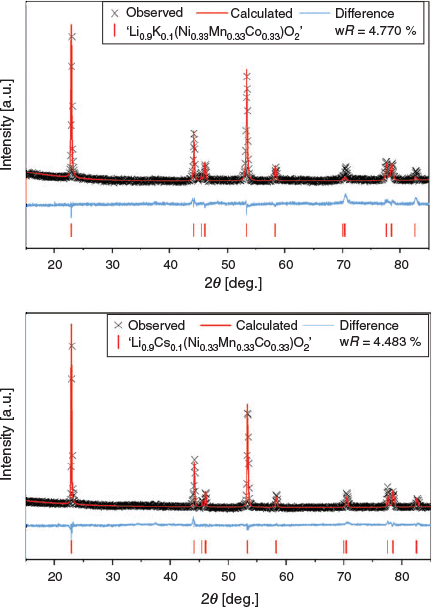
The XRD data and Rietveld analysis of ‘Li0.9K0.1(Ni0.33Mn0.33Co0.33)O2’ and ‘Li0.9Cs0.1(Ni0.33Mn0.33Co0.33)O2’ are shown in Fig. 4 and full refinement parameters can be found in Tables S2 and S3 (Supplementary Material) respectively. Rietveld refinements for these materials used a modified model based on Li(Ni0.33Mn0.33Co0.33)O2 by reducing the site occupancy factor (SOF) of Li to 0.9 and adding 0.1 of K or Cs onto the same site coordinates. Even though there were no additional impurities, the statistics of the fit for both materials were worse than the parent material when modelling K/Cs on the Li site by ~1.2–1.5 %, which suggests that the models of doping K/Cs onto the Li site do not completely agree with the collected XRD patterns from the materials.
|
For layered Li(NixMnyCoz)O2 materials, the c/a ratio can aid in determining the degree of cation mixing, specifically between Ni2+ (0.69 Å) and Li+ (0.76 Å) on the crystallographic 3b sites due to their similar ionic radii. This mixing can lead to a decrease in electrochemical performance,[27,28] which can be due to high Li diffusion barriers.[29,30] A c/a ratio higher than 4.899 indicates a stable hexagonal ordering of close-packed cubic symmetry,[31,32] which is found in Li(Ni0.33Mn0.33Co0.33)O2 and other similar layered cathode materials, however ratios below 4.899 indicate a higher degree of trigonal distortion of octahedra within the lattice as cation mixing increases.[33] The ratio of intensities of the 003 and 104 reflections also aid in deducing the degree of cation mixing of Li(NixMnyCoz)O2 materials. Although this value has not been rigorously defined, a ratio around 1.2 can indicate a layered structure with reduced cation mixing,[29,34] and higher values indicate even lower degrees of cation mixing.[35,36] It should be noted that the ratio of 003 and 104 reflections can be used to indicate a degree of cation mixing but for the models presented here the end members of mixing or no mixing are used. The r1 factor, which is the ratio of the 10 –2 and 006 combined Bragg peak intensities to the 101 Bragg peak intensity, has also previously been used to indicate the degree of hexagonal ordering,[37] where lower r1 ratios indicate a higher degree of hexagonal ordering as the intensity of the 101 reflection changes significantly based on the amount of Ni on the Li site. The synthesised Li1.0(Ni0.33Mn0.33Co0.33)O2 had a c/a ratio of 4.9781(2) and an I003/I104 ratio of 1.57, and an r1 ratio of 0.85 which indicates the synthesis of a well ordered material with minimal cation mixing. To further characterise (if any) small changes in peak intensities with chemical doping, for example 0.1 K in this system with a difference of ~1.9 electrons, future studies would benefit by incorporating synchrotron X-ray or high resolution neutron diffraction data. Currently, the studies presented in Table 1, along with this study, have used laboratory XRD data only.
Table 2 compares the lattice parameters, as well as the c/a, I003/I104, and r1 ratios of all three synthesised materials. The parent and doped samples exhibit the expected hexagonal ordering (c/a > 4.899) but each of the modelled refinements display c/a ratios lower than 4.9781(2) from Li(Ni0.33Mn0.33Co0.33)O2, however only marginally less (< 0.1 %). The r1 ratios are 1.05 for both ‘Li0.9K0.1(Ni0.33Mn0.33Co0.33)O2’ and ‘Li0.9Cs0.1(Ni0.33Mn0.33Co0.33)O2’ suggesting that there is a higher degree of hexagonal disordering compared with the parent material due to the 101 reflection being attenuated by the Ni species occupying the Li sites.[38] The I003/I104 ratios show similar values for the Cs-containing and parent sample, while the K-containing sample has a marginally lower ratio, potentially suggesting a higher degree of cation mixing.

|
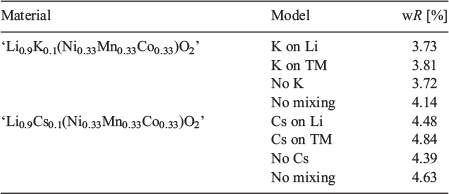
Other models were then considered to better understand the mechanism in which K/Cs is introduced into the material. A second model considered replacing 0.1 Ni with 0.1 K/Cs on the transition metal (TM) site and subsequently placing the Ni onto the Li layer to simulate cation mixing. However, this model disregards the large change in ionic radii when incorporating larger atoms (K with IR = 1.38 Å, Cs with IR = 1.67 Å) onto the TM site (Ni2+ IR = 0.69 Å, Mn4+ IR = 0.53 Å, Co3+ IR = 0.55 Å (low spin) and 0.61 Å (high spin)). A third model followed the same concept as the second, but only 0.05 Ni was exchanged between the TM and Li site and K/Cs was completely omitted from the structure, leaving a small vacancy in the total SOF. A final model used was similar to the third model but did not include any Li/Ni mixing and the Li SOF was set to 0.900. Table 3 summarises statistics of fit for each of the four models applied to both ‘Li0.9K0.1(Ni0.33Mn0.33Co0.33)O2’ and ‘Li0.9Cs0.1(Ni0.33Mn0.33Co0.33)O2’ while full refinement parameters are found in Tables S2 and S3 (Supplementary Material). Even though certain models had further parameters that could be refined, the fits for models without K/Cs still proved to give better statistics. In other words, omitting K or Cs from the Li(NixMnyCoz)O2 structure results in a better fit to the data and, in combination with minimal differences in lattice parameters (Table 2), strongly indicates that there is essentially no doping of K/Cs into the Li(NixMnyCoz)O2 structure. When considering the lower I003/I104 ratio of the K-containing sample, it suggests more Li/Ni mixing.
|
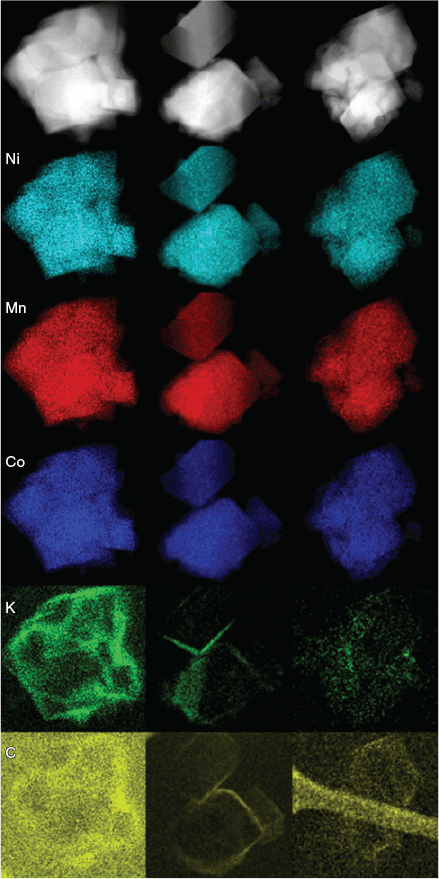
Beyond XRD, it is difficult to characterise the occurrence of Li/Ni cation mixing as well as devise a conclusive crystal structure which accounts for the addition of the alkali atoms. TEM images were obtained from multiple different particles of ‘Li0.9K0.1(Ni0.33Mn0.33Co0.33)O2’ (Fig. 5) and these show a homogeneous distribution of Ni, Mn, and Co via elemental mapping. However, these maps clearly show an inhomogeneous distribution of K. K can be seen to either coat the particle inhomogeneously or have an affinity for the particle edges and sides. This is strong evidence that the addition of K in the synthesis, and potentially other alkali atoms, are not being successfully doped onto any crystallographic site in the crystal structure but rather are inhomogeneously distributed in the sample. There is the slight possibility that a few atoms successfully dope onto the targeted Li sites, but may be inhomogeneously distributed throughout the layers, such as 1 K atom per 30 Li layers. Instead, it is more probable that the alkali atoms form a surface layer around Li(NixMnyCoz)O2 particles, which in turn, have some positive effect on the electrochemical properties of the materials. This is likely to be the case in some or most of the materials reported in Table 1 as well.
|
Foo et al.[38] studied the effects of intercalating water in layered O3-Na3CoO2 yH2O. They observed that a monolayer hydrate (y = 0.6) with hydration on the Na site caused the c lattice parameter to expand by 2.6 Å (~23 %), while a bilayer hydrate (y = 1.3) resulted in an expansion of 8.4 Å (~75 %) compared with the parent. The atomic radius of H2O (~2.75 Å) is bigger than the ionic radii of the alkali metal ions used in our work but if alkali ions were to insert into the Li layer throughout the structure there should be an expected expansion. The structural refinements obtained in this study, along with those listed in Table 1, show insignificant expansions in the c stacking axis. The largest reported expansion was 0.057 Å (~0.401 %) with 5 % Na doping,[19] while the largest expansion from our synthesised materials was only 0.001 Å (~ < 0.01 %) for ‘Li0.9Cs0.1(Ni0.33Mn0.33Co0.33)O2’ even though a larger doping percentage was used. In all instances, all samples were characterised via powder X-ray diffraction which observes an average crystal structure from all crystallites. This long range picture clearly demonstrates virtually no doping based on statistical arguments (even in the published literature in some cases) and on lattice expansion arguments. Furthermore, some of the previous literature is lacking some details about the structural models used, such as what parameters are refined and the variation (error) in the parameters. The variation becomes critical when considering low doping levels and therefore it is difficult to judge the validity of the results.
The current literature regarding this attempted doping regime, on alkali-ion sites in layered compounds, requires improvement when reporting. Although authors have demonstrated different synthesis methods to produce phase pure materials which target the Li site for small doping percentages (< 7 %) and show favourable increases in electrochemical performance, authors do not sufficiently explore and provide conclusive structural evidence of alkali insertion onto the targeted Li sites.
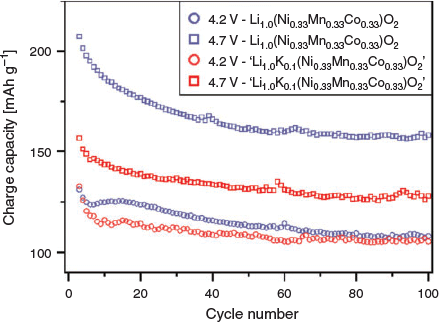
The electrochemical properties of Li(Ni0.33Mn0.33Co0.33)O2 and ‘Li0.9K0.1(Ni0.33Mn0.33Co0.33)O2’ were briefly explored and compared, as shown in Fig. 6. At 4.2 V, Li(Ni0.33Mn0.33Co0.33)O2 performs slightly better than the K-containing material by ~7 % at the 10th cycle; however, by 100 cycles, the difference is reduced to ~2.4 %. Similarly, at 4.7 V, the synthesised K-containing material initially achieves a capacity ~24.4 % less than the parent material, however after 100 cycles, the difference is reduced to ~19 %. The individual performance of the K-containing materials show a consistent trend of achieving lower capacities than the parent, however the capacity retention, as characterised from the 10th to the 100th cycle, is typically better than the parent, as shown in Table 4. However, to increase the validity of electrochemical analyses, it is critical to measure multiple cells under the same conditions in order to appreciate the variation of the electrochemical performance parameters. This is often not specified in the literature and could be implemented to improve reporting.
|

|
Conclusions
The idea of modifying the Li site of Li(NixMnyCoz)O2 has previously been shown to improve the electrochemical properties of the modified materials. However, the current understanding in the literature lacks in-depth structural investigations. The publications outlined in this study do not satisfactorily prove and justify the doping/substitution mechanism of alkali ions onto the Li site. The results shown in this study suggest that the ‘doping’ mechanism may actually be introduction of Li vacancies, some cation mixing as Ni fills locations on the Li site during synthesis, and the presence of inhomogeneously distributed K/Cs in the sample. The combination of these may or may not have some beneficial performance effects. The electrochemical performance of the K-containing material showed increased capacity retention ~4 % higher than the parent material at both 4.2 and 4.7 V. The structural characterisation using various structural models and the fact that there is insufficient expansion of the c lattice parameter suggests that the doping of larger alkali metal ions onto the Li site does not occur. For both materials, the stacking axis changes marginally (< 0.01 %). TEM images show an inhomogeneous distribution of K either over the surface or around the edges of electrode particles. This inhomogeneously distributed K (and Cs) and the vacancies are likely to be the reason behind performance differences. This work clearly highlights that detailed structural analysis is essential before claims of successful chemical doping can be made, especially with such low concentrations as shown in the literature. Future studies in this area would also highly benefit from high-quality synchrotron X-ray and neutron diffraction data, coupled with elemental analyses, as well as more in-depth electrochemical studies to assess the reproducibility of enhanced electrochemical performance.
Experimental
Materials Preparation
Alkali (‘A’ = K, Cs) modified ‘Li1−xAx(Ni0.33Mn0.33Co0.33)O2’ where x = 0, 0.1, 0.2, specifically targeting the Li-site, was synthesised stoichiometrically via a co-precipitation method.[13] Stoichiometric amounts of LiNO3 (AJAX Chemicals, > 98 %), Ni(NO3)2·6H2O (Alfa Aesar, 98 %), Mn(NO3)·6H2O (Alfa Aesar, > 98 %), Co(NO3)2·6H2O (Acros Organics, 99 %), as well as KNO3 (May & Baker, 99 %) or CsNO3 (Sigma Aldrich, 99 %) were diluted to 0.4 M with MilliQ water to form a solution which was maroon in colour and then transferred into a beaker. Cotton was added to the beaker and allowed to absorb the contents overnight before being drained of excess liquid and placed in an alumina crucible. The drained cotton was heated at a rate of 100°C per hour from ambient temperature to 400°C before allowing to cool and grinding the black product in an agate mortar and pestle. The ground product was returned to an alumina crucible and heated at the same rate from ambient temperature to 900°C and holding at 900°C for 4 h before allowing it to slowly cool back to ambient temperature resulting in a black powder as the final product.
Materials Characterisation
Laboratory XRD patterns were primarily collected using a Co-source (λ 1.78901 Å) PANalytical Empyrean II X-ray diffractometer in Bragg–Brentano geometry. Co radiation was used to reduce background levels, as well as to minimise sample fluorescence.[39] As collections were primarily completed on powdered samples, low-angle peak asymmetry was mitigated using 0.02 rad Soller slits. Analyses of crystal structures observed in the diffraction data were conducted through quantitative Rietveld refinements[40] in GSAS II,[41] in which a model is fitted to the observed diffraction data using a least-squares approach by changing both instrumental or structural parameters.
SEM analyses were conducted with a Hitachi S-3400, equipped with a Bruker XFlash 6|30 for energy dispersive spectroscopy (EDS) studies. The samples were mounted on SEM stubs with carbon tape. TEM analyses were conducted on a dual tilt stage with a JEOL JEM-F200. TEM samples were prepared by ultrasonicating small amounts of ‘Li0.9K0.1(Ni0.33Mn0.33Co0.33)O2’ in dimethyl carbonate (DMC) for 1 h before drop-casting onto a Cu grid with a thin perforated carbon film.
To investigate the electrochemical performance, electrodes were prepared from the synthesised materials and charged and discharged in CR2032 coin cells (MTI Corp.) using a battery cycler (Neware Technologies). The powdered materials were first converted into their electrode form by dissolving eight parts of synthesised material, one part carbon black powder (MTI Corp. ≥ 99.5 %) – a highly conductive material, and one part polyvinylidene fluoride (PVDF) (MTI Corp., ≥ 99.5 %) which acts as a binding agent. N-Methyl-2-pyrrolidone (NMP) (Sigma Aldrich, 99.5 %) was used to dissolve the solid components to form a viscous slurry. The resulting slurry was mixed for a minimum of 8 h with a magnetic stirrer to ensure homogeneity, and then pasted on an aluminium foil current collector to a thickness of 200 μm with a notch bar. This was dried in a vacuum oven overnight at 100°C to create an electrode sheet, which was then pressed at 100 kN using a flat-plate press (MTI Corp.) for 2 h to ensure proper contact of the electrode materials to the aluminium foil before being transferred into an Ar-filled glovebox. The cells were constructed with glass fibre separators, Li metal counter electrodes, and 1 M LiPF6 (Sigma Aldrich, ≥ 99.99 %) in DMC (Sigma Aldrich, ≥ 99 %) and ethylene carbonate (EC) (Sigma Aldrich, 99 %) in a 1 : 1 vol-% ratio. The cells were cycled from 3 to 4.2 or 4.7 V using rates of 30 mA g−1 to probe the capacity and capacity fade over time.
Supplementary Material
Structural tables derived from Rietveld refinements are available on the Journal’s website.
Conflicts of Interest
The authors declare no conflicts of interest.
Acknowledgements
This work was financially supported by the Australian Research Council Discovery program (DP170100269) and the Research Training Scheme.
References
[1] K. Mizushima, P. C. Jones, P. J. Wiseman, J. B. Goodenough, Mater. Res. Bull. 1980, 15, 783.| Crossref | GoogleScholarGoogle Scholar |
[2] Z. Lu, D. MacNeil, J. R. Dahn, Electrochem. Solid-State Lett. 2001, 4, A200.
| Crossref | GoogleScholarGoogle Scholar |
[3] B. Huang, Y. I. Jang, Y. M. Chiang, D. R. Sadoway, J. Appl. Electrochem. 1998, 28, 1365.
| Crossref | GoogleScholarGoogle Scholar |
[4] G. E. Blomgren, J. Electrochem. Soc. 2017, 164, A5019.
| Crossref | GoogleScholarGoogle Scholar |
[5] A. Yoshino, Angew. Chem. Int. Ed. 2012, 51, 5798.
| Crossref | GoogleScholarGoogle Scholar |
[6] M. Li, J. Lu, Z. Chen, K. Amine, Adv. Mater. 2018, 30, 1800561.
| Crossref | GoogleScholarGoogle Scholar | 30589465PubMed |
[7] N. Nitta, F. Wu, J. T. Lee, G. Yushin, Mater. Today 2015, 18, 252.
| Crossref | GoogleScholarGoogle Scholar |
[8] J. Jaguemont, L. Boulon, Y. Dube, Appl. Energy 2016, 164, 99.
| Crossref | GoogleScholarGoogle Scholar |
[9] S. Megahed, B. Scrosati, J. Power Sources 1994, 51, 79.
| Crossref | GoogleScholarGoogle Scholar |
[10] R. Kohler, J. Proell, S. Ulrich, V. Trouillet, S. Indris, M. Przybylski, W. Pfleging, Proc. SPIE 2009, 7202, 720207.
[11] C. J. Orendorff, D. Doughty, Electrochem. Soc. Interface 2012, 21, 35.
| Crossref | GoogleScholarGoogle Scholar |
[12] A. Vayrynen, J. Salminen, J. Chem. Thermodyn. 2012, 46, 80.
| Crossref | GoogleScholarGoogle Scholar |
[13] L. G. Lu, X. B. Han, J. Q. Li, J. F. Hua, M. G. Ouyang, J. Power Sources 2013, 226, 272.
| Crossref | GoogleScholarGoogle Scholar |
[14] J. N. Reimers, J. Dahn, J. Electrochem. Soc. 1992, 139, 2091.
| Crossref | GoogleScholarGoogle Scholar |
[15] Y. M. T. Ohzuku, Chem. Lett. 2001, 30, 642.
| Crossref | GoogleScholarGoogle Scholar |
[16] B. J. Hwang, Y. W. Tsai, D. Carlier, G. Ceder, Chem. Mater. 2003, 15, 3676.
| Crossref | GoogleScholarGoogle Scholar |
[17] N. Yabuuchi, Y. Makimura, T. Ohzuku, J. Electrochem. Soc. 2007, 154, A314.
| Crossref | GoogleScholarGoogle Scholar |
[18] Z. G. Yang, X. D. Guo, W. Xiang, W. B. Hua, J. Zhang, F. R. He, K. Wang, Y. Xiao, B. H. Zhong, J. Alloys Compd. 2017, 699, 358.
| Crossref | GoogleScholarGoogle Scholar |
[19] Y. H. Li, J. Y. Liu, Y. K. Lei, C. Y. Lai, Q. J. Xu, J. Mater. Sci. 2017, 52, 13596.
| Crossref | GoogleScholarGoogle Scholar |
[20] Z. Zhang, D. Chen, C. Chang, RSC Adv. 2017, 7, 51721.
| Crossref | GoogleScholarGoogle Scholar |
[21] P. Dahiya, C. Ghanty, K. Sahoo, S. Basu, S. Majumder, J. Electrochem. Soc. 2018, 165, A2536.
| Crossref | GoogleScholarGoogle Scholar |
[22] C. X. Gong, W. X. Lv, L. M. Qu, O. E. Bankole, G. H. Li, R. Zhang, M. Hu, L. X. Lei, J. Power Sources 2014, 247, 151.
| Crossref | GoogleScholarGoogle Scholar |
[23] Z. Zheng, Z. Wu, W. Xiang, W. Hua, W. Guo, Chem. J. Chin. Univ. 2017, 38, 1458.
[24] R. R. Zhao, Z. L. Yang, J. X. Liang, D. L. Lu, C. C. Liang, X. C. Guan, A. M. Gao, H. Y. Chen, J. Alloys Compd. 2016, 689, 318.
| Crossref | GoogleScholarGoogle Scholar |
[25] W. Hua, J. Zhang, Z. Zheng, W. Liu, X. Peng, X.-D. Guo, B. Zhong, Y.-J. Wang, X. Wang, Dalton Trans. 2014, 43, 14824.
| Crossref | GoogleScholarGoogle Scholar | 25162932PubMed |
[26] S.-C. Yin, Y.-H. Rho, I. Swainson, L. Nazar, Chem. Mater. 2006, 18, 1901.
| Crossref | GoogleScholarGoogle Scholar |
[27] K. Shaju, P. G. Bruce, J. Power Sources 2007, 174, 1201.
| Crossref | GoogleScholarGoogle Scholar |
[28] H.-J. Noh, S. Youn, C. S. Yoon, Y.-K. Sun, J. Power Sources 2013, 233, 121.
| Crossref | GoogleScholarGoogle Scholar |
[29] X. Zhang, W. Jiang, A. Mauger, F. Gendron, C. Julien, J. Power Sources 2010, 195, 1292.
| Crossref | GoogleScholarGoogle Scholar |
[30] K.-S. Lee, S.-T. Myung, J. Prakash, H. Yashiro, Y.-K. Sun, Electrochim. Acta 2008, 53, 3065.
| Crossref | GoogleScholarGoogle Scholar |
[31] K. Karthikeyan, S. Amaresh, G. Lee, V. Aravindan, H. Kim, K. Kang, W. Kim, Y. Lee, Electrochim. Acta 2012, 68, 246.
| Crossref | GoogleScholarGoogle Scholar |
[32] C. Deng, S. Zhang, B. Wu, S. Y. Yang, H. Q. Li, J. Solid State Electrochem. 2010, 14, 871.
| Crossref | GoogleScholarGoogle Scholar |
[33] C. Julien, A. Mauger, K. Zaghib, H. Groult, Materials 2016, 9, 595.
| Crossref | GoogleScholarGoogle Scholar |
[34] Y. H. Ding, P. Zhang, Y. Jiang, D. S. Gao, Solid State Ion. 2007, 178, 967.
| Crossref | GoogleScholarGoogle Scholar |
[35] W. Liu, P. Oh, X. Liu, M. J. Lee, W. Cho, S. Chae, Y. Kim, J. Cho, Angew. Chem. Int. Ed. 2015, 54, 4440.
| Crossref | GoogleScholarGoogle Scholar |
[36] M. Li, J. Lu, Z. Chen, K. Amine, Adv. Mater. 2018, 30, 1800561.
| Crossref | GoogleScholarGoogle Scholar | 30589465PubMed |
[37] J. Dahn, U. von Sacken, C. Michal, Solid State Ion. 1990, 44, 87.
| Crossref | GoogleScholarGoogle Scholar |
[38] M. Foo, T. Klimczuk, R. Cava, Mater. Res. Bull. 2005, 40, 665.
| Crossref | GoogleScholarGoogle Scholar |
[39] P. Rozier, J. M. Tarascon, J. Electrochem. Soc. 2015, 162, A2490.
| Crossref | GoogleScholarGoogle Scholar |
[40] H. M. Rietveld, J. Appl. Cryst. 1969, 2, 65.
| Crossref | GoogleScholarGoogle Scholar |
[41] B. H. Toby, R. B. Von Dreele, J. Appl. Cryst. 2013, 46, 544.
| Crossref | GoogleScholarGoogle Scholar |
* Neeraj Sharma is the recipient of the 2018 RACI Rennie Memorial Medal.


