Development of a 3-D-printable device for continuous measuring of heavy metal ion concentrations
Charl de Villiers A , Magdalena Wajrak B * and Alex Lubansky C
A Medi-Stats ANZ, 13 Mcrae Road, Sans Souci, NSW 2219, Australia.
B School of Science, Edith Cowan University, 270 Joondalup Drive, Joondalup, WA 6027, Australia.
C Haemograph Pty Ltd, 1/360 Ascot Vale Road, Moonee Ponds, Vic. 3039, Australia.
Abstract
Three-dimensional (3-D) printing offers the potential to create a range of tailored devices within many different industrial facilities. In this article, devices were designed and fabricated using 3-D printing to house electrodes for the testing of heavy metal concentration in hazardous fluids, particularly for biological samples such as urine or blood. The devices, connected to a syringe pump, were shown to be able to be operated without leaking. Proof of concept experiments were performed using Anodic Stripping Voltammetry (ASV) methods, demonstrating that the devices are able to be used for quick, cheap testing, showing the potential of the technique as a more hygienic analysis technique than conventional ASV with an immediacy that standard techniques such as inductively coupled plasma mass spectrometry (ICP-MS) do not offer. With further development and validation, 3-D-printed ASV techniques may provide a robust, reliable and affordable solution for heavy metal concentration detection in remote locations.
Keywords: 3-D-printed flow cell, electroanalytical chemistry, flow analysis, hazardous samples, lead, metal ions, microfluidic techniques, voltammetry.
Introduction
Heavy metals such as zinc, cadmium, lead, mercury and nickel are known to be present in the human body and can have adverse toxic effects in high concentrations.1 The human body absorbs heavy metals through inhalation, ingestion and dermal contact as well as through consumption of foods and beverages that have been exposed to heavy metal pollution. Industrial workers, particularly in industries such as mining, where high levels of exposure are common, may have high toxic metallic ion concentrations in their bodies. As a result, employees need regular monitoring to ensure their exposure to metals does not exceed allowable levels.1
The residence time of heavy metals within the body varies significantly. Nickel stays in the human body for between 20 and 60 h whereas lead and mercury remain in the human body for up to 1 month.2,3 Current practice for monitoring involves sending samples of urine to major facilities where inductively coupled plasma–mass spectrometry (ICP-MS) techniques are used. Employees in remote mining areas suspected of having exposure may typically wait 2 weeks or longer for results, during which time they are either isolated from site or further exposed to heavy metals while already potentially having a high heavy metal concentration. The on-site availability of easy-to-use equipment with a low marginal cost and rapid turnaround would be advantageous as it would enhance testing regimes for potentially exposed workers, enabling more rigorous tools such as ICP-MS to be used when there is a reliable indication of a problem.
Although portable digital voltammeters such as the PDV6000+ already exist and have been used successfully in the past, the level of human exposure and human error possible can have negative effects on tests. It is important to minimise human exposure to test samples, especially for biohazardous samples such as urine or citrated blood because it has the possibility to pose a danger to the health of the test operators. For example, at the Murrin Murrin mine in Western Australia, workers must be tested for cobalt and nickel in urine samples after each shift. A portable digital voltammeter has been trialed at the site to allow onfield analysis of urine samples; however, currently that involves the operator of the PDV6000+ instrument pipetting urine samples into the voltametric cell and thus exposes the operator to biohazardous samples. A possible solution would be to use a 3-D-printed flow cell, which would eliminate this exposure. Manual preparation of samples also leaves room for human error, for example in mixing the sample with the correct amount of test material.4
One issue with the electrodes in urinalysis is the need to develop a housing and system that will allow urine to be analysed with minimal human exposure to test samples and a system that will reduce human error associated with sample preparation. Microfluidic techniques have shown promise for analysing urine for a range of biomarkers, and are generally a reliable platform for performing well-controlled tests. One limitation with the use of microfluidic techniques is the need for expertise in fabrication and expensive facilities for production. Another limitation is the need to integrate channels of the order of 100 µm in width with electrodes of the order of 10 mm in diameter. With the electrodes setting a lower limit for the size of a device and housing, and the amount of urine available for a typical sample setting the upper limit, the ability to reliably design and produce devices within these constraints poses a challenge.
In this article, we worked to address the challenge by using 3-D-printing technology to custom-print housing for the electrodes. The successful use of 3-D-printing technology for electrochemical applications has been demonstrated previously by various researchers.5 Three-dimensional (3-D) printing allows the ability to tailor and print bespoke devices at a low marginal cost per device,6 while the increasing availability and decreasing cost of 3-D printers increase the likelihood that any given site will have access to a 3-D printer as required. A series of designs were simulated to ensure the flow maintained a representative concentration near the electrode. From these simulations, a design was chosen and printed. The resultant device was then integrated with electrodes and a broader set-up and tested with a lead solution.
Background
The current preferred method of screening body fluids for traces of heavy metals is using ICP-MS.7 This method of screening is extremely accurate and can detect multiple elements at concentration levels of parts per trillion.8 The disadvantages of this method are the cost, size and lack of portability of the equipment as well as requirement for high levels of support and infrastructure.9
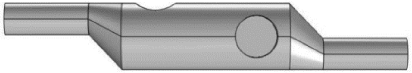
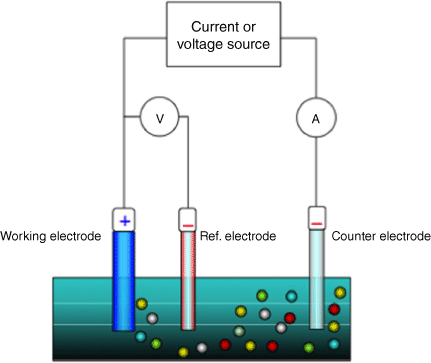
Anodic stripping voltammetry (ASV) is an alternative method and is in a much more portable format.10 The schematic of an ASV device shown in Fig. 1 comprises three electrodes surrounding a stirring device. There is a working electrode, a reference electrode and an auxiliary electrode. The basic procedure involves three steps: sample preparation, a reduction step and an oxidation step where the anodic stripping occurs.9 During the first step, the sample is digested and mixed with the required concentration of matrix solution. Once the electrodes are immersed in the prepared sample, a negative potential with respect to the reference electrode is applied to the working electrode to induce a reduction reaction. During the final step, the negative potential is reduced until the oxidation reaction occurs and the ions are stripped from the working electrode.9 The auxiliary electrode is used to make an electrical connection to the electrolyte to allow current to be applied to the working electrode. The reference electrode serves as a reference point for comparing the potential of the other electrodes, and is an electrode with a known, stable equilibrium potential.11 Although the voltammetric method is widely used and the equipment is readily available and affordable, there is a lack of standardisation in sample preparation and continuous exposure to biohazards, which must be reduced, and the preparation of samples must be simplified with a standard procedure for this method to be an acceptable method of portable testing.
Schematic of an anodic stripping voltammetry (ASV) device showing the arrangement of the working, reference and auxilliary electrodes with coloured spheres representing various ions in the sample. Reproduced from Bard and Faulkner.11
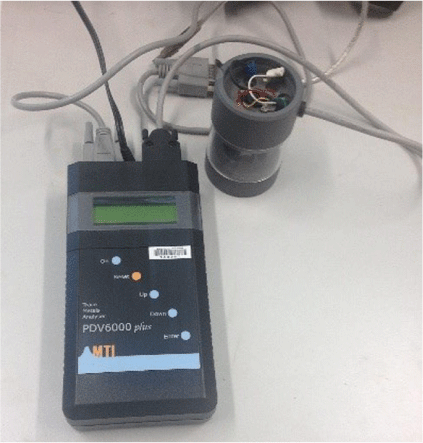
The PDV6000+ (Fig. 2) is a portable analytical device used to perform ASV.12 The system works by inducing a reduction reaction at the surface of a working electrode in order to build a metallic deposit on the face of the electrode. This reduction reaction is induced by applying a negative potential to the electrode. Once deposition has occurred for a set period of time, the potential is changed to a more positive value, causing a sudden oxidation reaction to occur. This oxidation reaction causes a current spike within the electrolyte that the PDV6000+ measures. The size of this peak and where it is located on a voltage scale is used to determine the type of metal ion and its concentration.12,13
Design, methods and materials
Simulations
Simulations were performed using COMSOL Multiphysics V4.3 with the Laminar Flow and Transport of Diluted Species packages. The inlet concentration for all simulations was set at 100 arbitrary units.
Design
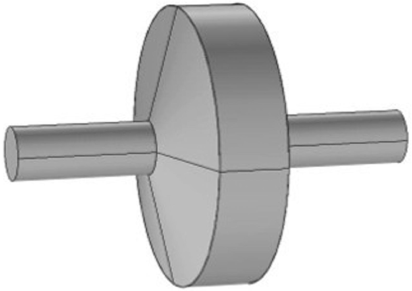
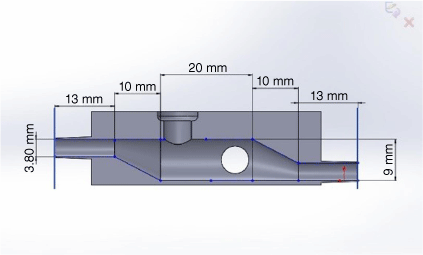
The recessed areas around the electrode ports accommodate an O-ring to ensure a seal is formed between the electrodes and the device. A set of collars were printed and attached to existing electrodes in order to exert pressure on the O-ring to form a seal. Fig. 3 shows a schematic layout of the digital 3-D model including dimensions. The inlet and outlets were extended by 3 mm each to ensure they were long enough to accommodate the connection hose. The device had to be designed with consideration to minimising volume and optimising concentration distribution uniformity within the flow chambers. A key design constraint was the size of urine samples typically available. Based on sample cups manufactured by Sarstedt, which are commonly used at local medical centres, the sample size is limited to 50 mL. The aim was to design a device that could conduct ASV tests with a sample size of 20 mL in order to ensure adequate sample volume remained if reruns were required.
3-D printing
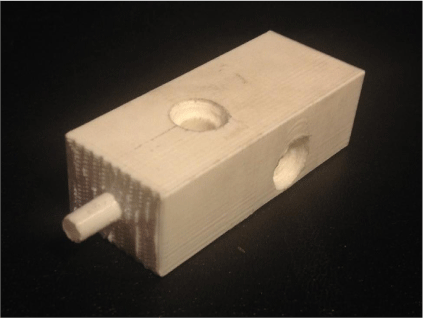
A digital 3-D model of the device was developed in SolidWorks using the optimised geometry obtained through simulation data. The completed model was designed with dimensions to match the best simulation model and then exported as an .STL file for printing. Makerbot software was used to prepare the .STL file for printing, and the device was printed using a Makerbot Replicator 2. Polylactic acid (PLA) was chosen as the material for preparation because it has a low concentration of metals that would contaminate results, and is approved for medical use.
Printing was carried out in a vertical orientation to minimise the requirement for support material through the flowing section. The printer settings were set to fine resolution (0.1 mm) with a 20% infill. The printing speed was set to 50 mm s–1 to reduce the amount of stringing that had been found to occur at higher speeds. Fig. 4 below shows the Makerbot Replicator 2 printing the device using PLA filament, whereas Fig. 5 shows the final 3-D printed device.

Materials
The solution that was used to test the 3-D-printed flow device was a 50 ppb (μg L–1) Pb2+ standard solution, which was mixed with an electrolyte ClAc solution, which consisted of NaCl, CH3COOH and CH3COONa. Other solutions used in this experiment were 1000 ppm (mg L–1) Pb2+ and 1000 ppm (mg L–1) Hg2+ standards, and Milli-Q water.
Equipment setup
The total setup consisted of the 3-D-printed device, a syringe pump with syringes, tubing, the electrodes and PDV6000+, a photograph of which can be seen in Fig. 6. The PDV6000+ electrochemical cell was replaced with the 3-D-printed device and working, reference and auxillary electrodes were inserted into the 3-D-printed device and immersed into the ClAc electrolyte solution. The Pb2+ standard solution was continuously pumped into the 3-D-printed device and electrochemical analysis of the analyte was performed using the PDV6000+ potentiometer.
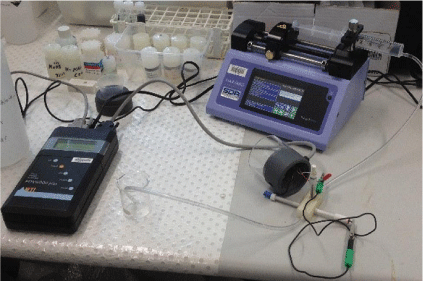
The dimensions of the device were determined by using the diameter and position of the electrodes as well as the diameter of the tips of the Nipro syringes used during experimental testing. A Harvard Apparatus Pump 2 Elite syringe pump was used as the driving mechanism to induce fluid flow within the device.
The PDV6000+ was used for validating the device with ASV testing. Fig. 2 shows the PDV6000+ device that was used during the validation of the 3-D-printed device. Fig. 1 shows the standard configuration consists of a cup system housing three electrodes and an electric stirrer. To the authors’ knowledge, there is no literature about the effect of electrode positioning in the PDV6000+ device. As such, it was assumed that provided the electrodes do not change position during repeated testing, the electrode positions do not influence results as it is a comparison method.
Young13 showed that by varying the deposition time, the sensitivity of the readings alters the peak current measured. By increasing the deposition time, the measured peak current also increases. Young13 used deposition times ranging from 5 to 320 s. Based on this study, it was determined that a deposition time of 60 s would be suitable for a proof of concept.
Design calculations
Using the deposition time, device volume and sample size, required inlet velocity, flow regime and residence times were calculated. A second flow velocity was also determined based on a 50-mL syringe infusing for 60 s to perform a system flush. The results can be found in Table 1. The diffusivity (D, m2 s‒1) of Pb2+ was calculated using the Stokes–Einstein equation. The diffusion coefficient found in Eqn 2 was used in the Transport of a Diluted Species package in COMSOL Multiphysics V4.3.
Experiments
The glassy carbon (GC) working electrode was prepared by electrochemically depositing a mercury film. A solution of 20 ppm of Hg2+ was prepared by mixing 0.8 mL of 1000-ppm Hg2+ standard with 40 mL of ClAc solution. The working GC electrode, platinum auxiliary electrode and silver–silver chloride reference electrode were thoroughly cleaned and polished in preparation for experimental testing. The working electrode was then prepared by using the electrode conditioning function of the PDV6000+ device for 480 s with the Hg2+ solution. This step needed to be completed at the start of each batch (~20 electrochemical runs) of analysis to maximise peak sensitivity.
A 20-mL syringe filled with ClAc was set up on the syringe pump, which was set to deliver a chosen flow rate from the range to be tested. A blank run was completed with a deposition time of 60 s using only the electrolyte (ClAc) to prepare a baseline for comparison with the samples. A 50-ppb sample of Pb2+ was prepared by mixing 0.2 mL of 10 ppm of Pb2+ with 40 mL of ClAc. A 20-mL syringe containing the sample was attached to the device and prepared. The sample was then passed through the device with the inlet velocity determined in Table 1.
A range of flow rates between 0.260 and 0.833 mL s–1 was also tested. By using a range of flow rates, it was possible to determine how mass transport by convection influenced the sensitivity of the PDV6000+ in the 3-D-printed device.
Results and discussion
Calculations
Table 1 shows the volume and residence time for each of the designs. The volume calculations for Fig. A1 and A2 were based on an expansion length of 10 mm. The volume must be as low as possible to minimise the sample size required for testing. By reducing the volume, the fluid velocity increases for a given flow rate. The average residence time of a particle within the device gives a good indication of how quickly the device fills or how quickly it can be flushed. A long residence time means more time is needed to fill the device, which for this application is undesirable.
The Reynolds number gives an indication of the state of flow, whether it is laminar, transitional or turbulent.
When preparing simulations on COMSOL, this information is important as it influences the settings in the program. Based on the value calculated for the highest flow rate used during testing, the flow regime can be considered to be laminar as the Reynolds Number was below 2300. The maximum velocity obtainable with the syringe pump is pump is 0.073 m s–1 so transition or turbulent flow cannot currently be achieved. The Reynolds number Re is calculated following Yunus and Cengel Cimbala14 as:
where ρ (kg m–3) is the fluid density, μ (Pa·s) is the fluid viscosity, D2 (m) is the diameter of the main body and v (m s–1) is the linear velocity. Using values for water within the body of the devices produced a maximum Re value of 665, well below the onset of transition flow.
As mentioned in the 3-D printing section, the diffusivity coefficient of Pb2+ in water had to be determined in order to complete the mass transport simulations in COMSOL Multiphysics V4.3. When comparing the diffusivity coefficient of Pb2+, where D = 1.83 × 10⁻⁹ m2 s–1, with that of Ni2+, where D = 3.45 × 10⁻⁹ m2 s–1, it can be said that the size of the difference is not significant. This suggests that convection and electro-migration would have a much more significant effect on mass transport within the system than diffusion. The diffusivity was calculated from the Stokes–Einstein equation (reproduced from Bird et al.15):
where k is the Boltzmann constant, T is the fluid temperature (K) and ra is the size of the particles in solution (µm).
The effect of gravity on the diffusion of Pb2+ was calculated to determine whether it would have a significant effect on ion distribution within the device. The result of this calculation was used to determine whether or not having an off-axis entrance and exit would benefit the filling or draining ability of the device. The results showed it would take 8200 years for a Pb2+ ion to migrate from the top of the device channel to the bottom with gravity as the only driving factor. Based on this, it can be said that the effect of gravity on the rate of diffusion is insignificant. The effect of gravity on diffusion was calculated based on the equation from Bird et al.15:
where Δρ (kg m–3) is the density difference between the particle and the solvent, and u (m s–1) is the settling velocity.
The settling time (t, days) can then be calculated by
Simulations
It was determined that a long expansion area provided a more uniform concentration distribution in both the symmetric and asymmetric models through the use of a parametric sweep on the 3-D models without electrodes present. The shorter expansion regions showed zones of concentration below 30% around the outer edges of the device after 10 s of fluid flow at 0.333 mL s–1. Without the electrodes present, the performance of the symmetric model appeared to be superior as the asymmetric model showed areas of low concentration along the lower boundary of the inlet expansion area.
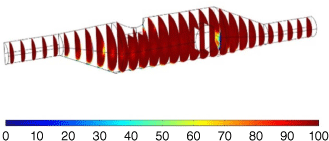
With the introduction of the electrodes, the asymmetric model showed superior performance and displayed a more consistent distribution of concentration levels above 99 on the electrode surfaces. As the authors are unaware of any literature suggesting that electrode positioning has significant effect on ASV testing, the depth of the electrodes within the device was altered between 1 and 3 mm to determine whether the accuracy of concentration of lead ions could be improved. It was found that positioning the working and reference electrodes 2.5 mm into the device left adequate space to ensure there would be no physical contact between the electrodes while being able to get very consistent concentration levels of 99.5–100 across the electrode surfaces. Fig. 7 shows the concentration after 10 s of fluid flow at 0.333 mL s–1 in both the symmetric and asymmetric models with the electrodes positioned at a depth of 2.5 mm. The asymmetric model in Fig. 7b displays much better concentration distribution, particularly on the flat surfaces of the electrodes. Fig. 7a shows particularly low concentration around the vertical electrode near the inlet. Fig. 7b also shows a lower concentration around the downstream side of the electrode but the overall concentration in that area is still higher than that of Fig. 7a. The ability to flush the solution out of the system was also simulated to ensure the device could be effectively cleaned for repeated use. This was important as contamination from prior tests could significantly affect measured results. The simulations involved flowing 50 mL of purified Milli-Q water through the device with a flow rate of 0.833 mL s–1. Both the symmetric and asymmetric results showed that no Pb2+ ions remained in the device after 60 s of flushing. This shows that with a 50-mL syringe of purified Milli-Q water, both devices can be completely flushed for repeated use, allowing them to be prepared for repeated use without the need for disassembly. Based on the results of Fig. 7, the device represented by Fig. 7b offers superior performance as the sample is distributed more uniformly in the device after 10 s and it was chosen to be printed and used for laboratory testing. The device that has a more uniform sample concentration at the 10-s interval displays better flow behaviour. It fills more quickly and therefore requires less fluid for the preparation stage prior to conducting ASV testing. It also ensures that a high amount of sample is distributed over the electrode surface in as short a time as possible, which improves the sensitivity of the measurements. These simulations were developed on the idea that a single 20-mL syringe would be pumped through the device and it is owing to this that the rate at which concentration reaches equilibrium on the electrode was critical. This arrangement was changed during laboratory testing and is addressed in further detail in the Experimental section.
Pb2+ Concentration distribution (%) of the symmetric and asymmetric devices. The left image shows Pb2+ concentration distribution after 10 s of fluid flow at 0.333 mL in the symmetric device with the electrodes set at a depth of 2.5 mm. The right side image shows Pb2+ concentration distribution after 10 s of fluid flow at 0.333 mL s–1 in the asymmetric device with the electrodes set at a depth of 2.5 mm.
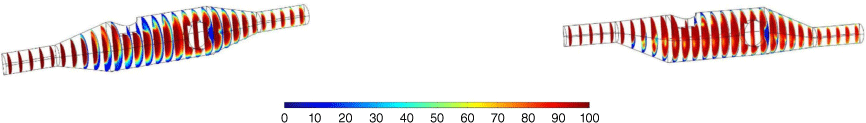
Although the simulations were performed assuming that convection was the dominant mode of mass transfer, electromigration effects were found to be significant, resulting in a depletion of Pb2+ ions localised at the electrode surfaces. This meant that the flow rate had to be increased significantly compared with the value calculated in the Results and Discussion section, resulting in further simulations being conducted on the asymmetric device using a flow rate of 0.833 mL s–1, which is the highest flow rate obtainable with the syringe pump. Fig. 8 shows the concentration distribution after 10 s of inflow at a rate of 0.833 mL s–1, and the concentration distribution is significantly better than the distribution observed in Fig. 7b.
Experimental
Experiments were completed using the method outlined in the Design calculations section. The first test was completed using the calculated flow rate of 0.328 mL s–1. The resultant peak was small and the sensitivity of the device did not match the existing PDV6000+ configuration. Crow16 determined that mass transfer in voltammetry consists of diffusion, convection and electro-migration. During the deposition phase, the ions closest to the electrode surface bond with the electrode, creating a deposit. This process causes a depletion of Pb2+ ions in the immediate vicinity of the electrode. The rate at which the molecules are able to rearrange is significantly slower than the rate at which Pb2+ ions deposit on the electrode surface.16 Based on these findings, it was determined that by increasing the flow rate of the fluid, the Pb2+ ions would fill the vacancies around the electrode at a faster rate, resulting in increased sensitivity. Flow rates in the range of 0.260–0.833 mL s–1 were then tested in order to prove that flow rate has a significant influence on device sensitivity.
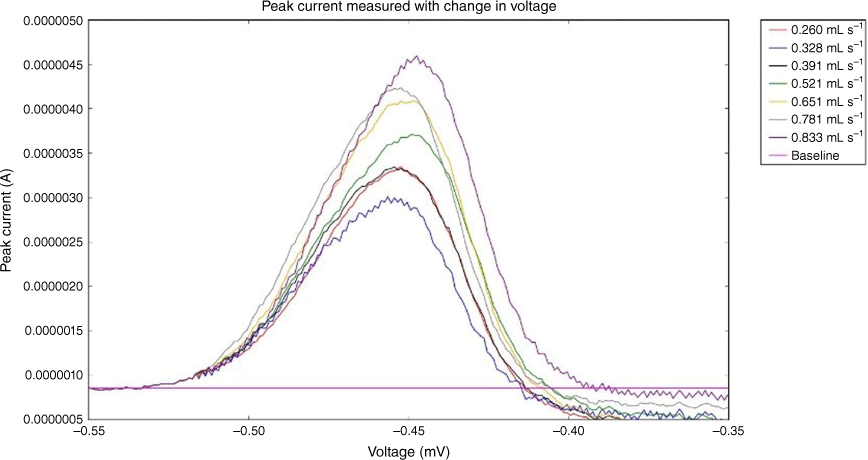
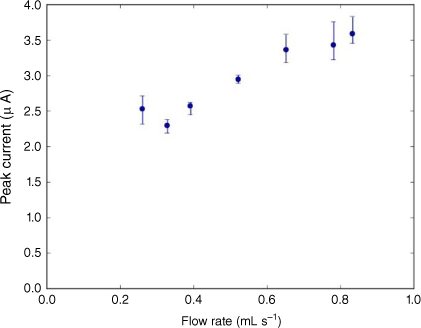
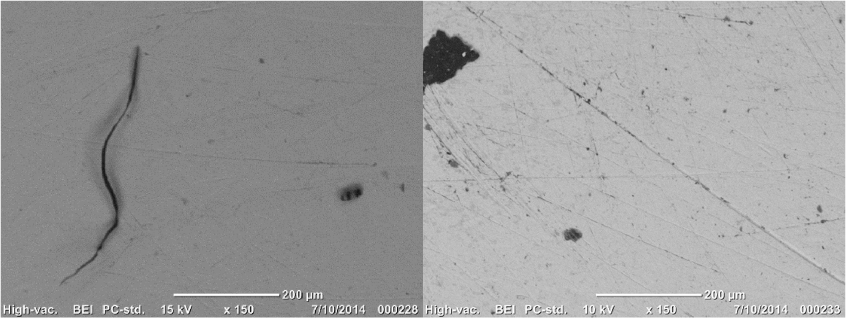
Fig. 9 shows the peak current vs voltage for each of the seven flow rates tested. When measuring from the baseline, it can be seen that an increase in flow rate results in an increased peak size. The flow rates used were 0.260, 0.328, 0.391, 0.521, 0.651, 0.781 and 0.833 mL s–1. ASV testing was conducted six times at each flow rate to obtain an average value and to reduce the influence of outliers in the data. Fig. 9 shows the profiles of the measured peak curves as the applied voltage approaches a more positive value. Fig. 10 shows the averaged values of the maximum peak height obtained for each flow rate; error bars show the outliers in the results. Fig. 10 shows that there is a high level of repeatability in the results. It also shows that there is a positive, near-linear correlation between flow rate and peak current measured. Crow16 states that there is a point of saturation where the rate at which Pb2+ ions fill the vacancies in the electrolyte created by deposition is at a rate equal to or greater than the rate of electro-migration. Once this point has been reached, increasing the flow rate no longer has a significant influence on the size of the peak current measured. Owing to the large increase of flow rate without being able to increase the volume of fluid, a method had to be developed to allow the fluid to be recirculated through the device. Currently, the syringe pump is set to continually inject and withdraw, creating a continuous flow across the electrode surface during the deposition phase. The fluid is contained in a vessel attached to the outlet where it is held until the syringe withdraws and pulls the fluid through the device. There were significant variations between the results after the working electrode was replated with mercury. It was noted during experimental testing that the mercury film plating obtained during the electrode conditioning process was inconsistent. The mercury film creates a conductive surface where reduction reaction can occur. Having inconsistent mercury plating between test dates greatly influenced test results. The condition of the electrode surface has significant influence on the sensitivity of the device. Any surface imperfections on the face of the working electrode or any impercations or interferences can reduce sensitivity. It has been found that a smoother and more polished electrode surface provides much higher sensitivity.17 For example, Fig. 11 shows two images of another type of working electrode, bismuth electrode, taken with an electron microscope. Each image had a different preparation method: Fig. 11a was slowly cooled whereas Fig. 11b was chilled. It can be clearly seen in Fig. 11b that there are impurities collecting in the surface scratches; these impurities can reduce the detection sensitivity of the device.17
Profiles of measured peak currents curves for each flow rate tested. A baseline is included as a point of measurement; the difference between the baseline and peak height determines the peak value created by the stripping process.
Profile of averaged values for maximum peak current measured for each of the flow rates tested, with error bars outlining the minimum and maximum values measured.
Images of a bismuth electrode taken with an electron microscope that has undergone different treatment processes to observe how they influenced the surface finish of the electrodes. The left image shows electron microscope image of a bismuth electrode that has been slowly cooled. Note the significantly smoother surface finish compared with the chilled bismuth electrode. The right side image shows electron microscope image of a bismuth electrode that has been chilled. Note the rough surface finish and impurities on the electrode surface.
All tests were conducted with 50-ppb Pb2+ solution with a deposition time of 60 s. When comparing the peak current results for a flow rate of 0.833 mL s–1 measured on different days, a range between 2.498 and 5.316 µA was measured depending on the quality of the mercury film. The PDV6000+ device is sensitive to changes in the environment and result repeatability is hard to obtain, and the quality of the mercury plating on the electrode surface had a significant effect on the results. The current device limitation is being able to frequently replate mercury film on the working electrode so that there is sufficient mercury film on the GC electrode, which has a significant effect on final results. On some occasions, small air bubbles formed near the electrodes, causing excessive noise in the results. The system has to be bled with care prior to conducting any testing. A simplified methodology for properly bleeding the system prior to use would be beneficial.
Further work
The experimental results showed that a 3-D-printed device can be used in conjunction with the PDV6000+ instrument but the level of sensitivity is currently still lower than the original PDV6000+ configuration. In order to improve this, the rate at which Pb2+ ions fill the vacancies around the electrodes created by the reduction reaction must be increased. This can be achieved by either increasing the fluid velocity near the electrodes or by creating turbulence in the flow regime by the introduction of obstructions in the flow path. As the tests were conducted at the maximum capacity of the syringe pump, increasing the velocity of the fluid is difficult. The first way this can be done is by reducing the cross-sectional area of the flow device, as:
v = Q ÷ A
where Q (m3 s–1) is the volumetric flow rate and A (m2) is the cross-sectional area, by decreasing the area, the fluid velocity would increase. In order to decrease the cross-sectional area of the device, smaller electrodes must be used. Bard and Faulkner11 state that microelectrodes have other advantages such as being able to conduct voltammetry in resistive media, having short response times and having improved mass transport characteristics due to spherical diffusion as apposed to planar diffusion. The introduction of a baffle in the inlet and outlet of the device can also induce turbulence, which will improve the distribution of Pb2+ ions within the device. This theory will have to be validated with simulation data prior to being implemented.
Conclusions
The preliminary results of the laboratory tests are promising and serve to validate the use of a 3-D-printed microfluidic device in conjunction with the PDV6000+ instrument for ASV testing. The objectives set out in this report were successfully accomplished. This project has scope for further work in future projects in order to attain the aim of having a field-ready device for urinalysis. The current level of detection sensitivity is lower than the existing PDV6000+ test device but the 3-D-printed device is still only in early development stages. Sensitivity can be improved in a number of ways mentioned in the Experimental section and Further work section. By taking the steps outlined in the latter section, this device can be developed to a point where it has the potential to be applied in the industrial sector for rapid onsite urinalysis. This device has the possibility to significantly improve the methods by which trace heavy metals are tested for in the human body. Significant gains can be made both in time and cost reduction by having a portable and easy to use device. By removing the need for sample transportation and potentially unnecessary employee downtime, productivity levels can be improved in remote industrial areas.
Data availability
The data presented in this study are available on request from the first author. The data are not publicly available as further study will be carried out using the same data.
Author contributions
A. Lubansky and C. de Villiers provided the conceptualisation. C. de Villiers, M. Wajrak and A. Lubansky designed the methodology and were resposible for writing of the paper. C. de Villiers and M. Wajrak contributed the validation and formal analysis. A. Lubansky provided the project administration. All authors have read and agreed to the published version of the manuscript.
References
1 Qu C-S, Ma Z-W, Yang J, Liu Y, Bi J, Huang L. Human exposure pathways of heavy metals in a lead–zinc mining area, Jiangsu Province, China. PLoS One 2012; 7(11): e46793.
| Crossref | Google Scholar |
2 Denkhaus E, Salnikow K. Nickel essentiality, toxicity, and carcinogenicity. Crit Rev Oncol Hematol 2002; 42(1): 35-56.
| Crossref | Google Scholar |
3 Järup L. Hazards of heavy metal contamination. Br Med Bull 2003; 68(1): 167-182.
| Crossref | Google Scholar |
5 Ambrosi A, Pumera M. 3D-printing technologies for electrochemical applications. Chem Soc Rev 2016; 45(10): 2740-2755.
| Crossref | Google Scholar |
6 Kreiger M, Pearce JM. Environmental life cycle analysis of distributed three-dimensional printing and conventional manufacturing of polymer products. ACS Sustain Chem Eng 2013; 1: 1511-1519.
| Crossref | Google Scholar |
8 Stetzenbach KJ, Amano M, Kreamer DK, Hodge VF. Testing the limits of ICP-MS: determination of trace elements in ground water at the part-per-trillion level. Ground Water 1994; 32(6): 976-985.
| Crossref | Google Scholar |
9 Nam SH, Masamba WRL, Montaser A. Investigation of helium inductively coupled plasma–mass spectrometry for the detection of metals and nonmetals in aqueous solutions. Anal Chem 1993; 65(20): 2784-2790.
| Crossref | Google Scholar |
10 Ashley K, Song R, Esche CA, Schlecht PC, Baron PA, Wise TJ. Ultrasonic extraction and portable anodic stripping voltammetric measurement of lead in paint, dust wipes, soil, and air: an interlaboratory evaluation. J Environ Monit 1999; 1(5): 459-464.
| Crossref | Google Scholar |
17 Wajrak M, Hart R, Prince K. Investigation of electrochemically deposited arsenic on the surface of solid gold electrodes using SIMS, SEM and Synchrotron soft X-rays. Proceedings of the 16th Australian Conference on Nuclear and Complementary Techniques of Analysis NCTA 2009; 25–27 November 2009; Sydney, NSW, Australia. AINSE Ltd, 2010. pp. 1–5.
Appendix 1. Various 3-D cell designs referenced in Table 1.
Conceptual design of the internal chambers of a symmetrically shaped device housing three electrodes.