

Genetic parameters for yearling wool production, wool quality and bodyweight traits in fine wool Merino sheep
A. A. Swan A B C , I. W. Purvis A and L. R. Piper AA CSIRO Livestock Industries, FD McMaster Research Laboratory, Armidale, NSW 2350, Australia.
B Animal Genetics and Breeding Unit (AGBU1), University of New England, Armidale, NSW 2351, Australia.
C Corresponding author. Email: andrew.swan@une.edu.au
Australian Journal of Experimental Agriculture 48(9) 1168-1176 https://doi.org/10.1071/EA07425
Submitted: 21 December 2007 Accepted: 27 May 2008 Published: 7 August 2008
Abstract
Genetic parameters were estimated for traits measured in the first year of production in a multi-bloodline flock of fine wool Merino sheep. Between 5025 and 9271 animals were measured, depending on the trait, and these animals were the progeny of up to 430 sires. Heritability estimates for fleece weight traits ranged from 0.37 to 0.49, while estimates for five wool quality traits ranged from 0.34 for staple strength to 0.66 for mean fibre diameter. For bodyweight, the heritability estimated at weaning was 0.20, and at the yearling age was 0.51. Maternal genetic effects were significant for fleece weight and bodyweight traits and were highly correlated between these trait groups, indicating that these effects are determined by similar groups of genes in both trait groups. While most genetic correlation estimates were either favourable or neutral, there were economically antagonistic correlations between fleece weight and mean fibre diameter, ranging from 0.15 to 0.30, and between mean fibre diameter and staple strength (0.26). Overall, the heritabilities and genetic correlations estimated in this fine wool population were similar to estimates from other strains, indicating that outcomes from selection programs will be similar across strains and that fine wool sheep can be included in across flock genetic evaluations with other strains.
Introduction
There has been a consistent and well documented trend towards production of finer wool in the Australian Merino sheep industry since the late 1980s. The forces driving this reduction in diameter are well understood and stem from consumer preferences for lightweight garments and the need to improve processing efficiency in the wool manufacturing sector. These factors operate directly on auction price and have led to consistent premiums for finer wools throughout the last two decades.
These forces stimulated a growing interest in fine wool production throughout the Australian Merino sheep industry. However, until the advent of the CSIRO Fine Wool Project in 1990, there was little information on the genetics of fine wool sheep that could be used to design breeding programs in this increasingly important sector of the industry. The Fine Wool Project was a collaborative research initiative established to address this knowledge gap. The participants included The Australian Association of Stud Merino Breeders, The Australian Superfine Wool Growers Association, The Woolmark Co., CSIRO Livestock Industries, CSIRO Textile and Fibre Technology, NSW Agriculture, Agriculture WA and the CRC for Premium Quality Wool. At the core of the project was a fine wool breeding flock, with a high quality measurement program designed to collect individual animal records on a variety of traits, allowing a comprehensive study of genetic parameters in fine wool sheep.
Prior to this, most of the studies reporting genetic parameters for Merino sheep have been based on medium wool bloodlines as these had been the predominant types used in the industry. However, given the increasing importance of fine wool Merino sheep, it was important to know whether the inheritance and genetic relationships between traits follow similar patterns to those observed in other strains. This was important in two respects: first, in the design of breeding programs and prediction of genetic progress for fine wool flocks, and second, in across-flock genetic evaluation which may require the comparison of fine wool sheep with sheep from other strains. The Merino industry has recently seen the development of a new across-flock genetic evaluation system, MERINOSELECT, combining sheep from ultra-fine through to strong wool strains in a common analysis (Brown et al. 2007). Knowledge of genetic parameters in fine wool sheep relative to those of other strains is required for the MERINOSELECT evaluation.
Two studies based on small to medium size fine wool Merino datasets have previously been reported by Mullaney et al. (1970) using Australian bloodlines and Wuliji et al. (2001) using New Zealand fine wool sheep. In addition, preliminary estimates of heritabilities and correlations from subsets of the complete dataset of the Fine Wool Project flock have been published by Swan et al. (1995), Purvis and Swan (1997) and Asadi Fozi et al. (2005). While collectively these studies have shown that fine wool genetic parameters are not substantially different to medium wool parameters, the complete Fine Wool Project dataset now provides us with the ability to investigate this issue with greater precision.
In this paper we present estimates of genetic parameters obtained from the final dataset of the Fine Wool Project breeding flock, for the traits of primary importance in the development of breeding objectives. These include fleece weights and measures of fibre diameter attributes, staple length and strength, and bodyweight in the first year of production.
Materials and methods
Environment
From 1990 to February 1997 the Fine Wool Project flock was located on CSIRO’s ‘Longford’ field station. Longford is situated 37 km north-west of Armidale in the Northern Tablelands of NSW (latitude 30°20′S, longitude 151°27′E, altitude 1189 m). The property comprised 947 ha of undulating, lightly timbered country, with the predominant soils being yellow solodic and podzolic types. Animals grazed improved perennial pastures with high clover content through late winter and spring. The area experiences a cool temperate climate with a slight summer predominance of rainfall, averaging ~800 mm annually.
In February 1997, the flock was relocated to the Arding field station (latitude 30°36′S, longitude 151°32′E, altitude 1046 m), 15 km south of Armidale. The climate and pastures at Arding are similar to Longford. For the purposes of this study, measurements recorded at these locations were pooled, therefore assuming that both were representative of a single ‘Northern Tablelands’ environment. Between-year and location differences were accommodated in the definition of the contemporary group fixed effect described below.
Contributing bloodlines
The breeding flock comprised nine fine wool bloodlines and two medium wool bloodlines. The medium wools were included as a link to previous research which had concentrated on those genotypes. Choice of bloodlines was based on factors such as industry influence, geographical location, and willingness of owners to participate. Selection of the foundation animals was left to the contributors, with the proviso that the animals should be a representative sample of the bloodline. Rams were of a grade similar to those generally available to commercial wool producers, while ewes were also of a commercial standard.
Purchase of foundation ewes and replacement policy
The breeding flock was established in early 1990 with the purchase of 100 ewes each from six bloodlines. Within each bloodline the ewes were mated to four sires, and lambed in November 1990. In 1991, there were further purchases of breeding ewes, with 60 per bloodline in the original six bloodlines, 160 from four bloodlines and 72 from one bloodline. Each group of ewes was mated to six sires from their respective bloodlines, apart from the bloodline with 72 ewes in which two sires were used.
Ewes born at Longford in 1990 were mated for the first time in 1992. Then, with the entry of the 1991 drop ewes into the breeding flock in 1993, most bloodlines reached their intended size of ~200 ewes mated. From this mating onwards, seven sires per bloodline were used.
Once the flock was fully established, it comprised five age classes, with the oldest class being culled each year. Consequently, between one-half to two-thirds of the ewe hoggets available entered the breeding flock at each mating. Each year before mating, the contributors were invited to visually class the ewe hoggets. Their classing decisions were recorded, but before the classing in 1994, all females were required to build up flock numbers. From 1994 on, the contributors were able to cull 1 to 2%, but the balance of the female replacements was chosen at random to eliminate the possible impacts of selection on genetic parameter estimation.
Ram purchase and replacement policy
In order to maintain the flocks as close as possible to industry standards, most rams were replaced each year with new batches purchased from the same contributors. Numbers of rams used from 1990 to 1992 are as described in the previous section, while from 1993 onwards, there were about seven rams used in each bloodline. In most cases, six of these were new rams purchased from the contributors, while the seventh was a link sire. In total, 430 sires were used throughout the duration of the project, as shown in Table 1.

|
Management flocks
The breeding ewes were run in four management flocks, with all bloodlines and age classes equally represented in each flock. Ewes were re-assigned at random to these flocks each year following shearing. Lambs were randomly assigned to three management flocks at weaning (again with all bloodlines equally represented). They were run in these flocks until their first shearing. At this time, the ewe hoggets were then re-allocated at random to three management flocks. Maiden ewes then entered the breeding flock at ~18 months of age, having been randomly reallocated again to the four ewe management flocks.
Mating
Matings were for 5 weeks and took place in May–June. Within each bloodline, ewes were randomly allocated to rams, and were then mated in single sire groups. Ewes were not mated within their management flocks. Consequently, each sire was represented in all management flocks within any year of mating. On completion of mating, ewes were redrafted into their management flocks.
Sampling and shearing
Shearing took place in August for the breeding ewes and in September for the yearling ewes and wethers. At pre-shearing sampling (~6 weeks before shearing), mid-side wool samples were taken and used for measurement of yield (clean fleece weight), fibre diameter, staple length, and staple strength.
At shearing, greasy fleece weights (unskirted and skirted) were recorded. Following shearing, the sheep were body weighed. At this time, ewes were rerandomised to management flocks as described above.
Lambing
Lambing began in mid-October. The ewes lambed in small plots of 1 ha or less, with ~25 to a plot. The ewes in any particular plot were of the same management flock and bloodline, but had not necessarily been mated to the same sire. This was intended to remove statistical confounding between sires and lambing plots, but may have led to increased errors in determining sire pedigrees.
Marking took place in December when the lambs were ~2 months of age. Males were castrated, and all lambs were mulesed and tail docked at this time. Ewe and wether progeny were managed together throughout the measurement period for the traits reported.
Weaning
Lambs were weaned at approximately three months of age in mid- to late-January. The only measurement taken at weaning was weaner bodyweight. At this time, the lambs were randomly allocated to three management flocks balanced for bloodlines, sires, and age of dam.
General management
Flock management generally reflected commercial practices, allowing however that there were constraints imposed by the experimental regime. The sheep grazed on improved pasture, with supplementary feeding only used as necessary. Sheep were drenched according to the strategic drenching program recommended for the Northern Tablelands of NSW, or as required following monitoring of faecal egg counts. They were treated with a multi-target vaccine annually, and were also given annual supplements of selenium which was deficient on Longford. Following shearing, all sheep were dipped, and jetting was carried out when flystrike was prevalent.
Traits
The traits analysed in this study were weaning bodyweight (wwt, measured in kg) and yearling traits including total greasy fleece weight (ygfw, kg), skirted greasy fleece weight (ysfw, kg), total clean fleece weight (ycfw, kg), clean scoured yield (yyld, %), mean fibre diameter (yfd, µm), coefficient of variation of fibre diameter (yfdcv, %), staple strength (yss, N/kTex), staple length (ysl, mm), and off-shears bodyweight (ywt, kg). Trait means, average ages, and other data structure related parameters are shown in Table 1.
Fixed effects
The fixed effects fitted in our analyses were contemporary group, bloodline, birth-rearing type, age of dam, sex and age of measurement. Contemporary groups were essentially defined as management groups within years, although one lamb crop (1992) was subdivided into smaller contemporary groups due to treatment for a footrot outbreak. The number of contemporary groups and mean contemporary group size for each trait is shown in Table 1. Bloodline was fitted as a factor with 11 levels. Birth-rearing type was coded with three levels, including single born-single reared, multiple born-single reared, and multiple born-multiple reared. The frequency of triplet litters was very low, and there were no litters with more than three lambs. Sex was fitted as a factor with two levels, ewes and wethers, and age of dam was fitted as a factor with two levels, maiden (2 years of age) and adult (>2 years of age). Age of measurement was fitted as a linear covariate for bodyweights, fleece weights, and staple length only. No interactions among fixed effects were fitted as these had no effect on genetic parameter estimates.
Estimation of genetic parameters
Data were analysed with ASReml (Gilmour et al. 2006) under the following general model for both univariate and multivariate analyses:
y = Xβ + Za + Wm + Sp + e
where y is a vector of data records ordered by animals within traits, β is a vector of fixed effects for each trait, a and m are vectors of random direct and maternal genetic effects respectively for all traits and animals in the pedigree, p is a vector of random permanent maternal environment effects for dams across traits, and e is a vector of random residuals for animals within traits. X, Z, W, and S are design matrices relating records to fixed effects, direct genetic effects, maternal genetic effects, and maternal permanent environment effects respectively. The variance structure of random effects is:
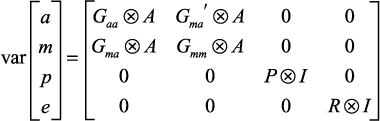
where Gaa is a matrix of direct genetic covariances between traits, Gmm is a matrix of maternal genetic covariances between traits, Gma is a matrix of covariances between maternal and direct genetic effects, and A is the additive relationship matrix between animals. P is a matrix of covariances between permanent maternal environment effects of different traits, R is a matrix of residual covariances between traits, and I indicates identity matrices of appropriate order. The symbol ⨂ indicates the direct product operation of matrices. Note that maternal genetic and maternal permanent environment effects were not necessarily fitted for all traits.
In the first instance, the following univariate models were fitted in order to test maternal effects:
-
Direct genetic effects only
-
Direct genetic effects + uncorrelated maternal genetic effects
-
Direct genetic effects + correlated maternal genetic effects
-
Direct genetic effects + correlated maternal genetic effects + maternal permanent environment effects
The addition of each parameter was tested sequentially using a likelihood ratio test:
LRT = 2 | LogLi − LogLj |
where LogLi and LogLj are the REML log-likelihoods for models i and j, where (i,j) = (2,1), (3,2), or (4,3). This statistic was tested as a chi-square variable with one degree of freedom. The model chosen for each trait for further multivariate analyses was either the full model (4), or one of the reduced models if adding parameters did not significantly increase the REML likelihood.
Maternal effects for yearling fleece weight traits were also examined in models which included weaning weight as a linear covariate.
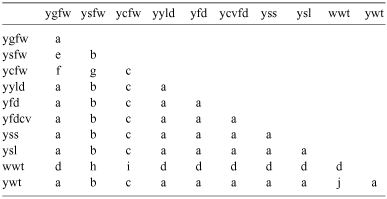
The models for each trait determined by these univariate analyses were then used in a series of multivariate analyses. We attempted to simultaneously fit as many traits as possible, and while we were not able to fit all traits in a single model, analyses with up to seven traits were possible. Table 2 summarises this process such that in the presentation of correlations in the results tables, pairs with the same letter in Table 2 came from the same analysis.
|
Multivariate analyses of yearling fleece weights proved problematic because of the high correlation between the traits and the need to fit maternal genetic effects. To overcome convergence problems in finding the REML estimates we fitted the maternal genetic effects of each fleece weight trait as a single effect (i.e. with an implied genetic correlation of 1), but with the maternal genetic variance scaled appropriately. In three bivariate analyses, the maternal genetic variance of ycfw was modelled as 0.81 × the variance of ygfw, the variance of ysfw was modelled as 0.62 × the variance of ygfw, and the variance of ysfw was modelled as 0.94 × the variance of ycfw. These scaling factors were determined by finding the maximum likelihood over a range of values, thus requiring several runs for each bivariate analysis.
Results
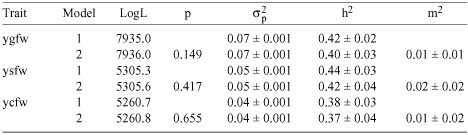
Results from the testing of alternative maternal effects models are shown in Table 3. For the three fleece weight traits, direct heritabilities (h2) in model 1 were 0.40, 0.49, and 0.39 for ygfw, ysfw, and ycfw respectively. In model 2, which fitted an uncorrelated maternal genetic effect in addition to the direct genetic effect, the maternal heritabilities (m2) were 0.06, 0.05, and 0.05. Estimates of h2 in model 2 were reduced relative to model 1 by similar amounts to the estimates of m2, to 0.34, 0.42, and 0.33 for ygfw, ysfw, and ycfw, respectively. However, the genetic covariance between direct and maternal effects in models 3 and 4 was strongly negative, with estimates of the correlation (ram) ranging from –0.37 to –0.60. This resulted in quite substantial increases in both h2 and m2 in these models. The maternal permanent environment effect significantly increased the log-likelihood for both ygfw and ysfw, but not for ycfw, although estimates of the maternal permanent environment ratio (c2) were similar for all three traits (0.05, 0.07 and 0.04). Thus, the models chosen for these three traits for multivariate analyses were model 4 for ygfw and ysfw, and model 3 for ycfw.

|
Maternal effects were not significant for any of the other wool traits, and model 1 was therefore selected for multivariate analysis of these traits. Estimates of heritabilities were high for yfd (0.66), yyld (0.61) and ysl (0.54), and moderate for yfdcv (0.45) and yss (0.35).
Maternal effects significantly influenced bodyweight, particularly at weaning. The maternal genetic effect on wwt was of the same magnitude as the direct genetic effect (h2 = 0.21 and m2 = 0.18). The direct-maternal covariance was small and positive (ram = 0.08), while the maternal permanent environment effect was strong (c2 = 0.09). Thus, Model 4 was selected for wwt. The direct heritability was much higher for ywt, and although the maternal heritability was lower, it was still significant. In model 2, h2 for ywt was 0.49 while m2 was 0.07. Although adding the direct-maternal covariance did not significantly increase the log-likelihood for ywt, model 3 was selected for further analysis, as implied by the covariance model for direct and maternal genetic effects.
The impact of using weaning weight as a linear adjustment on fleece weight is shown in Table 4. Maternal effects were no longer significant, with model 2 estimates of m2 of 0.01, 0.02, and 0.01 for ygfw, ysfw, and ycfw respectively. The direct heritabilities from model 1 were similar to the estimates for the equivalent unadjusted traits for both ygfw and ycfw (h2 = 0.42 and 0.38 in Table 4 compared with 0.40 and 0.39 in Table 3) but lower for ysfw (h2 = 0.44 in Table 4 and 0.49 in Table 3).
|

|
Estimates of phenotypic variances (σ2p) and correlations (rp) from multivariate analyses are shown in Table 5. The variances were very similar to estimates from univariate analyses in Table 3. Phenotypic correlations were in the main similar to genetic correlations (rg, Table 5). The largest difference was seen in the correlation between yss and yfdcv, where the phenotypic correlation was –0.37 while the genetic correlation was –0.59. This also extended to associations between yss and other traits: phenotypic correlations for yss with fleece weight and bodyweight were higher than genetic correlations (e.g. rp(ygfw,yss) = 0.14, rg(ygfw,yss) = 0.02), while the phenotypic correlation with yfd was lower than the genetic correlation (0.16 v. 0.26). Phenotypic correlations between bodyweight and fleece weight were higher than genetic correlations (e.g. rp(ygfw,ywt) = 0.46, rg(ygfw,ywt) = 0.25).
Estimates of heritabilities and genetic correlations between direct genetic effects are shown in Table 5. Heritability estimates were again very similar to estimates from univariate analyses presented in Table 3. Genetic correlations among the three fleece weight traits were very high, ranging from 0.87 to 0.90. Correlations between mean fibre diameter and fleece weight traits were moderate to small and positive, and were 0.25, 0.30, and 0.15 with ygfw, ysfw, and ycfw respectively. The correlation between staple strength and CV of fibre diameter was strongly negative (–0.59), while the correlation between staple strength and mean fibre diameter was positive (0.26). The correlation between weaning weight and yearling weight was strongly positive (0.61), while correlations of these traits with fleece weight were low to moderately positive, ranging from 0.23 to 0.46. Correlations between bodyweight and mean fibre diameter were 0.19 (wwt) and 0.20 (ywt). Staple length had low to moderate positive correlations with fleece weight traits, mean fibre diameter, and bodyweight traits, ranging from 0.13 to 0.38.
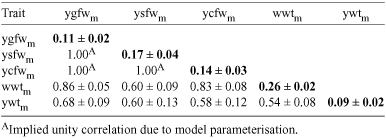
Maternal heritabilities and genetic correlations between maternal effects are shown in Table 6. Estimates of maternal heritabilities from multivariate analyses tended to be higher than estimates from univariate analyses, particularly for ysfw (m2 = 0.17 in Table 6 v. 0.10 in Table 3) and wwt (m2 = 0.26 in Table 6 v. 0.18 in Table 3). As noted above, the parameterisation for fleece weight maternal effects in multivariate analyses assumed unity correlation across traits. Genetic correlations between maternal effects for fleece weight and bodyweight were highly positive. In particular, the correlations for wwt with ygfw and ycfw were 0.86 and 0.83 respectively. For other combinations of fleece weight and bodyweight traits the correlations were lower ranging from 0.58 to 0.68. The maternal effects correlation between wwt and ywt was moderately positive (0.54).
|
Correlations between direct and maternal genetic effects from multivariate analyses are shown in Table 7. Some of these have equivalent estimates in Table 3 from the univariate analyses, and where this is the case the estimates from multivariate analyses were closer to zero. The direct-maternal correlation for ygfw was –0.32 in Table 7 compared with –0.44 in Table 3, for ysfw it was –0.44 compared with –0.60, for ycfw it was –0.45 compared with –0.51, for wwt it was 0.04 compared with 0.08, and for ywt it was –0.10 compared with –0.16. Correlations between direct and maternal effects among the fleece weight traits were similar, as expected from the parameterisation of maternal genetic effects of these traits, although the correlation between the maternal effect of ygfw and the direct effect of ysfw was low (–0.05). Correlations between ywt and fleece weight traits were moderately negative, ranging from –0.26 to –0.37. For the two bodyweight traits, correlations were close to zero with the exception of maternal wwt with direct ywt, which was moderately positive (0.58). The majority of other direct-maternal correlations were close to zero.

|
Discussion
Heritabilities
In addition to estimated heritabilities from multivariate analyses in this study, Table 6 also shows heritabilities from other studies for comparison. The values from Fogarty (1995) and Safari et al. (2005) are averages from several studies on wool breeds, compiled for purposes of review. The majority of the studies reviewed were carried out in Australia. The estimates from Safari et al. (2007a, 2007b) were derived from a study which combined data from several Merino research flocks. These were mainly medium wool flocks, but also included the Fine Wool Project data reported here. The estimates from Wuliji et al. (2001) were derived from a New Zealand fine wool population.
The heritabilities estimated in this study were very similar to the literature averages of Fogarty (1995) and Safari et al. (2005). Estimates for fleece weight, staple strength, and bodyweight were consistent, while estimates for fibre diameter and staple length tended to be higher in this study than others. There were greater differences between our estimates of heritabilities and those of Safari et al. (2007a) and even more so with those of Wuliji et al. (2001).
The results provide strong evidence that heritabilities for Australian fine wools are consistent with other Australian Merino populations, but not necessarily with New Zealand fine wool Merinos. In Australian Merino populations, approximate values for heritabilities are 0.4 for fleece weight, 0.6 and higher for fibre diameter, 0.35 for staple strength, 0.5 for staple length, 0.2 to 0.3 for weaning weight, and 0.5 for yearling weight. Therefore, there is considerable scope for genetic improvement of these traits, allowing for some constraints due to the effect of the unfavourable genetic correlations discussed below.
Maternal effects
In common with other studies on Merinos, maternal effects were present for fleece weight and bodyweight. Maternal heritabilities for fleece weight from multivariate models in Table 7 ranged from 0.11 to 0.17. These were similar to estimates from other Merino studies including Hickson et al. (1995), Wuliji et al. (2001) and Safari et al. (2007a), which ranged from 0.07 to 0.14. Direct-maternal correlations for fleece weight shown in Table 7 and in the studies of Hickson et al. (1995), Wuliji et al. (2001) and Safari et al. (2007a) were strongly negative in the range –0.35 to –0.6.
Maternal heritabilities for bodyweight were also similar to those in other Merino studies, including Mortimer and Atkins (1995), Hickson et al. (1995), Vaez Torshizi et al. (1996), Wuliji et al. (2001), and Safari et al. (2007a). There is a clear trend for maternal effects to reduce with age, with maternal heritabilities ranging from 0.11 to 0.42 at weaning, averaging ~0.2, and from 0.07 to 0.16 at the yearling stage, averaging ~0.1. In contrast, direct-maternal correlations for bodyweight in other studies tend to become less negative and even positive with age. For example, Mortimer and Atkins (1995) estimated correlations of –0.2 at weaning and 0.12 at the yearling stage, while Safari et al. (2007a) estimated correlations of –0.12 and 0.07 at the same stages.
As shown in Table 3, there were no significant maternal effects for yield, fibre diameter traits, staple length or staple strength. No other estimates of maternal effects on these traits have been reported in the literature.
It is clear that there are significant maternal genetic effects for fleece weight and bodyweight in Merino sheep, which are quite strong for early measurements, but decline with age. While there appears to be a strong negative correlation between direct and maternal genetic effects for fleece weight, this correlation is closer to zero for bodyweight.
Adjusting fleece weight for weaning weight
Asadi Fozi et al. (2005) showed that accounting for maternal genetic effects in Merino breeding objectives led to more accurate predictions of genetic gain, with increases in overall response ranging from 1.4 to 14.3%, depending on the level of emphasis placed on maternally influenced traits in the objective. However, estimation of maternal effects in genetic evaluation is problematic in Australian Merino flocks because dam pedigrees and associated birth information are often not recorded. Atkins and Ramsay (2001) suggest the use of weaning weight as a covariate for early fleece weights (to 18 months of age), to compensate for unknown birth and rearing type and age adjustment factors, and to remove maternal genetic and environmental effects. Consistent with the results of Atkins and Ramsay (2001), maternal effects on fleece weight were no longer significant in our data after fitting weaning weight as a covariate (Table 4), although in contrast to Atkins and Ramsay (2001) there was no increase in the direct heritability for fleece weight in our data.
It is apparent from our results that the weaning weight adjustment removes maternal effects on fleece weight because the genetic correlations between the maternal effects on weaning weight and fleece weight traits are high (greater than 0.8 for clean and grease fleece weight in Table 6), and the genetic correlations between the direct effects are lower (0.33 to 0.45 in Table 7).
While the weaning weight adjustment may be used for within-flock applications, its use in across-flock genetic evaluation where the amount of pedigree and birth information varies between flocks requires further investigation.
Fleece weight and fibre diameter
The genetic correlation between fleece weight and mean fibre diameter is a key issue for fine wool Merino breeding programs. The correlation is small and positive, and is therefore economically antagonistic because fine wool breeding objectives often seek to increase fleece weight and reduce fibre diameter. The correlation estimates from our data ranged from 0.15 to 0.30 (Table 5), close to the average of literature estimates reported by Safari et al. (2005) and the estimates of Safari et al. (2007b). For greasy fleece weight and fibre diameter, Safari et al. (2005) reported an average correlation of 0.36, while for clean fleece weight and fibre diameter the average was 0.28. This strongly suggests that the relationship between these traits in fine wool Merinos is not atypical, and that simultaneous improvement in the two traits is no more problematic in fine wools than it is in other strains.
Staple strength correlations with fibre diameter traits
The second major economically antagonistic genetic correlation in Merinos is between mean fibre diameter and staple strength. The estimate of 0.26 in our study (Table 5) was lower than the literature average of 0.37 reported by Safari et al. (2005). As a result of this correlation, breeding programs which select specifically for reduced fibre diameter will result in a negative response in staple strength, unless strength is included in the breeding objective. A strong negative genetic correlation between staple strength and CV of fibre diameter (–0.59 in Table 5) means that CV can be effectively used as a selection criterion for staple strength. This is a cost effective alternative because measurement of CV is much less expensive than staple strength. The relationship between staple strength and CV of fibre diameter in our study was again consistent with literature estimates, with an average of –0.52 reported by Safari et al. (2005).
Bodyweight correlations with wool traits
Small positive genetic correlations between bodyweight and wool traits including fleece weight, mean fibre diameter and staple length are also consistent with the literature averages reported by Safari et al. (2005) and the estimates of Safari et al. (2007b). Apart from fibre diameter, these correlations are favourable for current breeding programs.
Maternal effects correlations
Correlations between maternal genetic effects in Table 6 show a strong relationship between the maternal effects for fleece weight and bodyweight, demonstrating that these traits are under the control of very similar genetic influences.
Skirted fleece weight
While skirted fleece weight has limited relevance to Merino ram breeders, it is very relevant to commercial wool producers. This is because the trait is measured by the Sirolan FleecescanTM, one of two technologies used for on-farm fibre measurement. In commercial flocks, the measurements from FleecescanTM can be used to optimise clip preparation and carry out selection (Kelly et al. 2007). In this context, selection will be based on phenotypic information only, but with the potential to combine all available traits in a selection index. When the measurements are derived from FleecescanTM, parameters involving skirted fleece weight should be used in constructing the index. Calculations based on a simple objective with equal emphasis on increasing clean fleece weight and reducing fibre diameter showed that selection response was similar when using either skirted fleece weight or greasy fleece weight as a criterion in the index.
Implications for breeding programs and genetic evaluation
The Australian Merino is a very diverse breed, with a wide range in mean performance for the economically important traits across flocks (see Coelli et al. 1996 for example). The results presented in this paper show that genetic parameters for the key early age traits in fine wool Merinos are very similar to those published in other studies which have mainly been based on medium wool genotypes.
As observed in other studies, the traits studied here were highly heritable, and apart from the genetic correlations between fleece weight and mean fibre diameter and staple strength and mean fibre diameter, most relationships are either favourable or neutral. This means that there is considerable scope to improve fine wool Merino performance based on breeding objectives tailored for fine wool production systems.
The MERINOSELECT across-flock genetic evaluation system combines sheep from ultra-fine through to strong wool strains in a common analysis (Brown et al. 2007). To accommodate the wide range in average performance across flocks, the evaluation model implements genetic grouping and variance homogenising techniques. The results from our study provide an important validation for the MERINOSELECT system, in demonstrating that the heritabilities and genetic correlations for fine wool Merinos appear to be no different to those for other Merino strains.
Acknowledgements
The CSIRO Fine Wool Project was partially funded by The Woolmark Co. and the Cooperative Research Centre for Premium Quality Wool. We also acknowledge the valuable contribution made by the participating sheep breeders, and the dedication and professionalism of all CSIRO staff who worked on the project.
Asadi Fozi M,
Van der Werf JHJ, Swan AA
(2005) The importance of accounting for maternal genetic effects in Australian fine-wool Merino breeding. Australian Journal of Agricultural Research 56, 789–796.
| Crossref | GoogleScholarGoogle Scholar |

Atkins KD, Ramsay AMM
(2001) Can weaning weight improve the accuracy of genetic evaluation for fleece weight in young Merino sheep? Proceedings of the Association for Advancement of Animal Breeding and Genetics 14, 373–376.
Brown DJ,
Huisman AE,
Swan AA,
Graser H-U,
Woolaston RR,
Ball AJ,
Atkins KD, Banks RG
(2007) Genetic evaluation for the Australian sheep industry. Proceedings of the Association for Advancement of Animal Breeding and Genetics 17, 187–194.
Coelli KA,
Atkins KD,
Casey AE, Semple SJ
(1996) Genetic differences among Merino bloodlines from NSW and Victorian wether comparisons (1984–1995). Wool Technology and Sheep Breeding 44, 178–195.
Fogarty NM
(1995) Genetic parameters for liveweight, fat and muscle measurements, wool production and reproduction in sheep: a review. Animal Breeding Abstracts 63, 101–143.
Hickson JD,
Swan AA,
Kinghorn BP, Piper LR
(1995) Maternal effects at different ages in Merino sheep. Proceedings of the Australian Association for Animal Breeding and Genetics 11, 416–420.
Kelly MJ,
Swan AA, Atkins KD
(2007) Optimal use of on-farm fibre diameter measurement and its impact on reproduction in commercial Merino flocks. Australian Journal of Experimental Agriculture 47, 525–534.
| Crossref | GoogleScholarGoogle Scholar |
Mortimer SI, Atkins KD
(1995) Maternal effects influence growth traits of Merino sheep. Proceedings of the Australian Association for Animal Breeding and Genetics 11, 421–424.
Mullaney PD,
Brown GH,
Young SSY, Hyland PG
(1970) Genetic and phenotypic parameters for wool characteristics in fine-wool Merino, Corriedale, and Polwarth sheep. II. Phenotypic and genetic correlations, heritability, and repeatability. Australian Journal of Agricultural Research 21, 527–540.
| Crossref | GoogleScholarGoogle Scholar |
Purvis IW, Swan AA
(1997) Can follicle density be used to enhance the rate of genetic improvement in Merino flocks? Proceedings of the Australian Association for Animal Breeding and Genetics 12, 512–515.
Safari E,
Fogarty NM, Gilmour AR
(2005) A review of genetic parameter estimates for wool, growth, meat and reproduction traits in sheep. Livestock Production Science 92, 271–289.
| Crossref | GoogleScholarGoogle Scholar |
Safari E,
Fogarty NM,
Gilmour AR,
Atkins KD,
Mortimer SI,
Swan AA,
Brien FD,
Greeff JC, Van der Werf JHJ
(2007a) Across population genetic parameters for wool, growth and reproduction traits in Australian Merino sheep. 2. Estimates of heritability and variance components. Australian Journal of Agricultural Research 58, 177–184.
Safari E,
Fogarty NM,
Gilmour AR,
Atkins KD,
Mortimer SI,
Swan AA,
Brien FD,
Greeff JC, van der Werf JHJ
(2007b) Genetic correlations among and between wool, growth and reproduction traits in Merino sheep. Journal of Animal Breeding and Genetics 124, 65–72.
|
CAS |
Crossref |
PubMed |
Swan AA,
Lax J, Purvis IW
(1995) Genetic variation in objectively measured wool traits in CSIRO’s fine wool flock. Proceedings of the Australian Association for Animal Breeding and Genetics 11, 516–520.
Vaez Torshizi R,
Nicholas FW, Raadsma HW
(1996) REML estimates of variance and covariance components for production traits in Australian Merino sheep, using an animal model. 1. Bodyweight from birth to 22 months. Australian Journal of Agricultural Research 47, 1235–1249.
| Crossref | GoogleScholarGoogle Scholar |
Wuliji T,
Dodds KG,
Land JTJ,
Andrews RN, Turner PR
(2001) Selection for ultrafine Merino sheep in New Zealand: heritability, phenotypic and genetic correlations of liveweight, fleece weight and wool characteristics in yearlings. Animal Science (Penicuik, Scotland) 72, 241–250.
1 AGBU is a joint venture of NSW Department of Primary Industries and the University of New England.