Dietary cation–anion differences in some pasture species, changes during the season and effects of soil acidity and lime amendment
Sophie Pelletier A E , Richard J. Simpson B , Richard A. Culvenor B , Gilles Bélanger A , Gaëtan F. Tremblay A , Guy Allard C , Jörg Braschkat B D and Peter J. Randall BA Agriculture and Agri-Food Canada, Soils and Crops Research and Development Centre, Québec, QC G1V 2J3, Canada.
B CSIRO Plant Industry, PO Box 1600, Canberra, ACT 2601, Australia.
C Département de Phytologie, Faculté des Sciences de l’Agriculture et de l’Alimentation, Université Laval, Québec, QC G1V 0A6, Canada.
D Present address: Birkenweg 49, 69221 Dossenheim, Germany.
E Corresponding author. Email: pelletiers@agr.gc.ca
Australian Journal of Experimental Agriculture 48(8) 1143-1153 https://doi.org/10.1071/EA08121
Submitted: 10 April 2008 Accepted: 22 May 2008 Published: 14 July 2008
Abstract
The difference between cation and anion concentrations is an important property when assessing feed for dry dairy cows in order to avoid hypocalcaemia following calving. Dietary cation–anion difference (DCAD) is used to assess suitability of feed and predict the risk of milk fever; a value of –5 cmol(+)/kg dry matter (DM) or less is desirable. This work has examined the DCAD of 16 field-grown species found in pasture in southern Australia. The DCAD [cmol(+)/kg DM] at the flowering stage varied from 7 to 32 for grasses, 21 to 72 for legumes and 72 to 99 for dicot weeds. The average DCAD for legumes was 50 cmol(+)/kg DM, over 2-fold higher than the 20 cmol(+)/kg DM average for grasses. There was a substantial decline in DCAD of herbage as the season progressed. In a glasshouse experiment with five grass species in an acid soil, lime application increased yield and tended to lower the DCAD. Lime decreased uptake per unit root length of potassium and chlorine and increased uptake of calcium by phalaris and timothy. While DCAD is an important attribute of herbage for assessing its suitability for prepartum diets of dairy cows, the present data indicate that it would be prudent to also consider concentrations of calcium and other mineral nutrients in herbage, particularly when examining less familiar plant species or the effects of different cultural practices on the composition of herbage for such diets.
Additional keywords: aluminium, developmental stage, harvest.
Introduction
Hypocalcaemia in dairy cows after calving is a problem worldwide. In Australia, it is estimated that 5% of dairy cows are affected by milk fever, the symptomatic form of hypocalcaemia and, in some years, the incidence may be more than 20% in individual herds (McNeill et al. 2002). At a subclinical level, hypocalcaemia can affect 33–40% of dairy cows in Australia and New Zealand. In the United States, 5–7% of dairy cows are affected by hypocalcaemia at a clinical level and an estimated 66% are affected by hypocalcaemia at a subclinical level (Sanchez 1999). The problem has been reported in other livestock as well as in dairy cows and hypocalcaemia is a problem in ewes lambing in winter and spring in south-eastern Australia (Judson and McFarlane 1998).
Studies have shown that the precalving diet can affect the incidence of postcalving hypocalcaemia in dairy cows (Judson and McFarlane 1998) and ewes (Grant et al. 1988). Dry dairy cows consuming feed containing an excess of cations [generally potassium (K) and sodium (Na)] over anions [generally chlorine (Cl) and sulfate (SO4)], described as a high dietary cation–anion difference (DCAD), have a higher risk of developing postcalving hypocalcaemia than those fed a low DCAD ration (Horst et al. 1997). Goff and Horst (2003) recommended that dry dairy cows should be given rations with a DCAD at or below –5 cmol(+)/kg dry matter (DM) in order to lower the risk of postcalving hypocalcaemia. However, in many herbages the DCAD is normally higher than this threshold value. For example, in eastern Canada, herbage DCAD can reach 66 cmol(+)/kg DM (Tremblay et al. 2006) and in south-eastern Australia, DCAD reported for pastures range from –17 to 87 cmol(+)/kg DM (McNeill et al. 2002). Indeed, it is estimated that non-lactating cows consuming a pasture-based diet in the last 2 weeks of pregnancy will almost always be eating herbage that is above the threshold DCAD regarded as optimum (Roche et al. 2000). The DCAD of diet can be manipulated by adding anionic salts, but this approach is limited because of problems with palatability of the anionic salt sources commonly used for this purpose. If the DCAD in the herbage exceeds 25 cmol(+)/kg DM it will be particularly difficult to add enough anionic salts to decrease the DCAD in the diet to the target value of –5 cmol(+)/kg DM without causing dry cows to reduce their DM intake (Oetzel and Barmore 1993; Horst et al. 1997). Therefore, identifying types of feed that have an intrinsically low DCAD is an important approach in the prevention of postcalving hypocalcaemia.
The mineral balance and DCAD of herbage is known to be strongly influenced by the species in the pasture and the timing of the harvest in the growing season (Braschkat and Randall 2004; Tremblay et al. 2006; Pelletier et al. 2007a). In addition, fertiliser application can have a substantial effect on DCAD (Pelletier et al. 2007a). It is thus likely that soil properties such as pH could have an impact on herbage DCAD through effects on the availability of nutrients (Thomas and Hargrove 1984), or because low pH soils often have high soil aluminium (Al), which reduces root growth and thus may affect the mineral nutrition of plants (Delhaise and Ryan 1995). Soil acidification is a continuing process accelerated by agriculture and, in south-eastern Australia, it potentially limits pasture production over substantial areas (Scott et al. 2000). Correcting soil acidity by amending acid soils with lime may in turn affect the availability and uptake of nutrients, and potentially alter herbage DCAD. Liming directly increases the availability of calcium (Ca), decreases the uptake of K and often increases available sulfur (S) (Adams 1984).
In this study, it was postulated that herbage mineral concentrations and DCAD would vary with species, growth conditions and harvest management. This hypothesis was tested in three experiments conducted in Australia. In the first experiment, 16 pasture species of grasses, legumes, and weeds were grown in the field under similar conditions. Seven of these species, three grasses and four legumes, were sampled on six occasions during the growing season. In the second experiment, five grass species were grown in a glasshouse in acid soils amended with different levels of lime to have a range of soil pH. In the third experiment, timothy and phalaris were grown in a glasshouse in soils amended with different lime levels to evaluate how root growth and nutrient uptake vary with soil pH and herbage species.
Materials and methods
Experiment 1: the DCAD of 16 pasture species grown in the field
The DCAD was determined for shoot material of nine grass species, five legume species and two common weeds of pasture grown as single species swards in the field. The species were: the perennial grasses, cocksfoot (Dactylis glomerata L.) cv. Currie, perennial ryegrass (Lolium perenne L.) cv. Victorian, phalaris (Phalaris aquatica L.) cv. Holdfast, wallaby grass [Austrodanthonia richardsonii (Cashm.) Lind.] cv. Taranna, and Yorkshire fog grass (Holcus lanatus L.); the annual grasses, annual ryegrass (Lolium rigidum L.) cv. Wimmera, barley grass (Hordeum leporinum L.), soft bromegrass (Bromus mollis L.), and vulpia (Vulpia bromoides L., SF Gray); the perennial legumes, lucerne (Medicago sativa L.) cv. Aurora and white clover (Trifolium repens L.) cv. Tahora; the annual legumes, barrel medic (Medicago truncatula L.) cv. Caliph, serradella (Ornithopus sativus L.), and subterranean clover (Trifolium subterraneum L.) cv. Goulburn; and the weeds, capeweed (Arctotheca calendula L.) and Paterson’s curse (Echium plantagineum L.). The details of the experiment are fully described in Braschkat and Randall (2004). Briefly, the plots were established at Ginninderra Experiment Station near Canberra in the Australian Capital Territory (149°06′E, 35°12′S) 600 m.a.s.l. There were three replicate blocks. The soil type was a mottled eutrophic Red Chromosol (Isbell 1996) with a fine sandy loam texture. The soil pH was 5.9 in water (pHw) and a mixed fertiliser supplying ammonium nitrogen, phosphorus (P), K and S was applied and incorporated before sowing. The seed was sown in autumn (May) and each species was sampled for analysis at approximately the same phenological stage, at the beginning of flowering (anthesis). Three grasses, perennial ryegrass, phalaris and annual ryegrass, and four legumes, lucerne, white clover, barrel medic and subterranean clover were also sampled on six occasions from early spring to mid summer. However, at the last harvest on 14 January, the herbage of the annual species (annual ryegrass, barrel medic and subterranean clover) was not retained for analysis because it had begun to decompose in the field following 153 mm of rain in December.
Experiment 2: effect of liming an acid soil on mineral nutrient contents and DCAD of five pasture grasses
Five pasture grass species were grown in pots of acid soil amended with lime to modify the pH and obtain a range of extractable soil Al contents. There were also pots without lime. The grasses are commonly found in pastures in southern Australia and vary in their relative performance on acid soils. The grasses used were: cocksfoot cv. Porto; microlaena [Microlaena stipoides (Labill) R.Br.]; perennial ryegrass cv. Roper; phalaris cv. AT98, and tall fescue (Festuca arundinacea L.) cv. Fraydo.
The soil used was a Kurosol (Isbell 1996), a duplex soil with a silty loam surface texture and a high content of gravel through the A horizon, from Rye Park, New South Wales (148°55′E, 34°31′S). The surface 0.1 m was removed and the 0.1–0.2-m layer collected, mixed, sieved moist and prepared for potting. The soil as collected was analysed by methods described in Rayment and Higginson (1992): pHw 4.8, pH(CaCl2) 4.0, organic carbon 0.57%, exchangeable K 0.074 cmol(+)/kg DM, and Al saturation 66% cation exchange capacity (CEC). Lime (superfine, 94.5% CaCO3 + 3% MgCO3, 96% passing a 0.25-mm sieve) was added to batches of soil at rates of 0, 0.32, 0.65, 0.90 and 1.90 g lime/kg soil at 5% moisture, thoroughly incorporated by mixing in a soil mixing box, and allowed to incubate for 4 weeks before sowing. It is likely that Al was a major factor limiting plant growth on this soil. The addition of lime lowered the amount of extractable Al in the soil (calculated as % of CEC) from 61 without lime to 45, 25, 12 and 0% at the highest lime rate.
Pots were cylindrical, 8.6 cm in diameter and held 0.9 kg soil of 5% moisture. Seed was sown at a rate of 0.06 g/pot except for microlaena (0.1 g/pot). Pots were kept at 15–20°C and the surface soil regularly moistened until seedling emergence, then pots were transferred in late August to a glasshouse in Canberra set to maintain 25/15°C day/night. The soil was maintained at 85% of field capacity by regular applications of demineralised water and monitored by weighing pots twice a week. A nutrient solution containing 2.571 g NH4NO3, 2.00 g NH4H2PO4, 0.867 g K2SO4, 0.507 g MgSO4.7H2O, 0.333 g CaCl2.2H2O, 0.04335 g CuSO4.5H2O, 0.09879 g ZnSO4.7H2O, 0.00111 g (NH4)6Mo7O24 and 0.01591 g H3BO3/L was applied before sowing at a rate of 0.03 L per pot. A further two applications of the same solution minus the P component were made at 1 and 3 weeks after seedling emergence. Pots were arranged in a three replicate split-plot design randomised twice per week with species as the main plot treatment and lime rate as the split-plot treatment. Plants were harvested 4 weeks after placement in the glasshouse by cutting the shoots at soil level and washing them in tap water before drying.
Experiment 3: shoot and root growth, uptake of nutrients and shoot DCAD of timothy and phalaris as affected by lime applied to an acid soil
This experiment used soil from the same site and similar procedures to those described for Experiment 2. There were two species, phalaris cv. Sirosa and timothy (Phleum pratense L.) cv. Viking. Phalaris is widely used in southern Australia and has a moderately low DCAD as shown in the earlier experiments, while timothy has been recommended for the production of low DCAD herbage in Canada (Tremblay et al. 2006).
Five lime amendment treatments (0, 0.93, 1.09, 1.32 and 1.94 g CaCO3/kg) were applied to batches of soil as described for Experiment 2. After mixing, 1.1 kg of amended soil was weighed into pots of 8.6 cm in diameter and potted soil was fumigated with methyl bromide to kill potential pests and control root diseases, then wetted and incubated for 1 week to let pH stabilise before sowing. Seed was sown at a rate of 0.05 g/pot of viable seeds of timothy or phalaris in late April. Pots were managed as described in Experiment 2, from seedling to growth in the glasshouse. Pots were arranged in a split-plot design with four replicate blocks. Plant species were assigned to main plots and amendment treatments to subplots. Pots were re-randomised within each block every week. Water and nutrient management was similar to Experiment 2 except that nutrient application was split 35, 35 and 30% of total on 11, 20 and 32 days after sowing, respectively. Shoots were harvested 54 days after sowing and washed in tap water before drying. Roots were recovered by soaking the pots and gently washing away the soil on a sieve. Roots were then preserved in 50% v/v water/ethanol and stained with methylene blue before measuring length and average diameter using a Delta-T scanner and WinRHIZO software version 4.0B (Régent Instruments, Québec, Canada).
Chemical analyses
Plant material
Shoots were oven dried at 70°C for 48 h, weighed, ground in a puck mill and subsamples pressed into 32-mm pellets using a hydraulic press before estimation of mineral element concentrations with a Philips 1404 X-ray fluorescence spectrometer (Philips, Almeto, the Netherlands) using a dual anode Sc-Mo tube (Norrish and Hutton 1977).
Soils
In Experiment 3, soils were sampled weekly and subsamples of each treatment were dried at 40°C for 24 h and sieved in a 2-mm sieve and pH(CaCl2) and exchangeable Al were measured (Rayment and Higginson 1992). The pH was measured with a glass electrode in a 1 : 5 soil : 0.01 mol/L CaCl2 suspension. Al was extracted in 1 mol/L KCl (1 : 10) with shaking for 1 h and after centrifuging at 5000g for 5 min, Al was determined in the supernatant using a Varian Vista Pro (Varian, Mulgrave, Vic.) inductively coupled plasma atomic emission spectrograph.
Calculations and statistical analyses
The DCAD in plant samples was calculated according to Ender et al. (1971):
DCAD [cmol(+)/kg DM] = (K+ + Na+) – (Cl– + S2–) (1)
with each element expressed in cmol(+)/kg DM (g/kg DM × 100 × valence/atomic weight).
Milk fever %, the risk of prepartum dairy cows developing milk fever given particular DCAD and concentrations of mineral nutrients in their diet, was calculated using the equation given by Lean et al. (2006):
Milk fever % = eLT/(1 + eLT) × 100 (2)
where LT = −5.76 + 0.548 (Ca) − 0.505 (Mg) + 0.185 (P) + 0.02 (DCAD) − 0.203 (Ca)2 + 0.03 (days of exposure to the prepartum diet). The LT is the logit-transformation of the regression equation for predicting the incidence of milk fever in their meta-analysis, in this case for the reference Holstein–Friesian breed.
Data were subjected to ANOVA using the general linear model either with SAS (SAS Institute 1999) or the Minitab 12 statistical software package and standard deviations for individual mean data points calculated using the one-way procedure in Minitab. Statistical significance was postulated at P ≤ 0.05. Contrasts defined a priori were performed on species treatments of Experiment 1. The comparison of regression slopes was performed according to Snedecor and Cochran (1967).
Results
Experiment 1: DCAD of field-grown pasture species
The DCAD in species at flowering
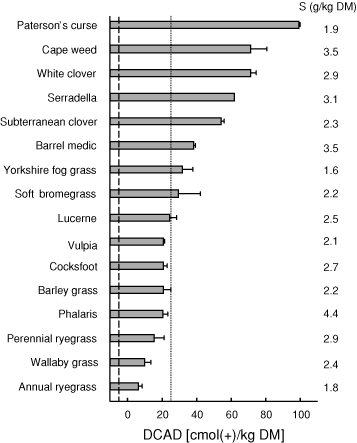
The DCAD values of species shown in Fig. 1 were calculated using concentrations of K, Na, and Cl given in Braschkat and Randall (2004) and the concentrations of S shown in Fig. 1. The dicotyledonous species as a group had higher DCAD (Fig. 1) and K concentrations than the monocotyledons (P < 0.001). Concentration of Na was relatively low; it was similar in legumes and grasses (≤2.1 g/kg DM) and higher in the dicotyledonous weeds (11.1 g/kg DM for cape weed and 5.4 g/kg DM for Paterson’s curse). Concentration of Cl varied considerably among species, while S concentration was similar in monocotyledons and dicotyledons. Comparing legumes and grasses in Fig. 1, grasses showed lower DCAD [20 cmol(+)kg DM] than legumes [50 cmol(+)/kg DM] (P < 0.001). Mean K concentration in grasses was also lower than legumes (P = 0.005). Among the legumes, K concentration varied from 19.2 g/kg DM in lucerne to 40.5 g/kg DM in white clover. Among the grasses, K concentration varied from 14.1 g/kg DM in annual ryegrass to 28.6 g/kg DM in barley grass. Interestingly, herbage K concentration and DCAD in lucerne were both below the highest values recorded for the grasses. Legumes generally had lower Cl concentrations (3.8–7.9 g/kg DM) than grasses (6.6–12.4 g/kg DM). Annual ryegrass, with the lowest DCAD of all species, had the lowest K concentration (14.1 g/kg DM) combined with a Cl concentration above the average (7.7 g/kg DM).
|
The herbage K concentrations were generally higher than those of the other elements and there was a strong correlation between K concentration in herbage of the 16 species and the DCAD (DCAD = 0.979 × K – 32; R2 = 0.89). The relationships between Na, Cl, or S concentrations and the DCAD were not significant (R2 = 0.35 for Na, 0.09 for Cl, and 0.01 for S).
Changes in DCAD with time
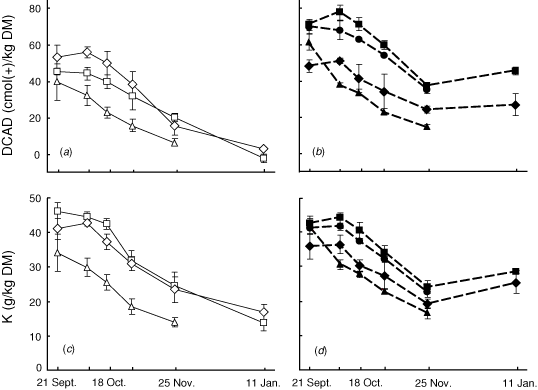
In all species, DCAD declined steadily from about mid October until late November (Fig. 2a, b). At the next harvest in mid January, the DCAD had declined further in perennial ryegrass and phalaris but not in the legumes; lucerne and white clover had a DCAD similar to or slightly higher than the value in late November. The K concentration tended to follow DCAD variations. It decreased from mid October to January for grasses while for legumes, it decreased from mid October to late November and slightly increased in December (Fig. 2c, d). Similarly, for the 16 species harvested at flowering, there was a strong correlation between the mean values of DCAD for the seven species harvested at five times and the corresponding K concentrations (DCAD = 0.651 × K – 11; R2 = 0.99).
|
Experiment 2: effect of liming an acid soil on mineral nutrient contents and the DCAD of five pasture grasses
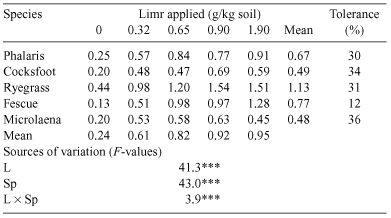
The five grass species differed in their growth in unamended soil (Table 1). The yield of shoots in the unamended soil, expressed as a percentage of maximum yield was only 12% in fescue and 30–36% in the other species. Incremental lime treatments of 0, 0.32, 0.65, 0.90, and 1.90 g/kg soil raised pH from 4.0 to 4.2, 4.5, 4.8 and 5.7. This resulted in highly significant shoot yield increases, 3- to 4-fold in phalaris, cocksfoot, ryegrass and microlaena and 7-fold in fescue, with yield generally reaching its maximum at the second or third lime increment.
|
Lime decreased concentrations of K in shoots for all species and decreased concentrations of Cl for a majority of the species (Table 2). Lime substantially increased concentrations of Ca, but the effects of lime on other elements varied with species. In all species, the DCAD was highest without lime (Table 2). Increasing lime applications tended to lower the DCAD in each of the species; the data were, however, variable and a separate analysis of each species showed that the effect in phalaris and cocksfoot failed to reach significance.
Considering the five species together, there was a strong relationship between the DCAD and K concentration in the shoots, K concentration explaining ~81% of the variation in DCAD (R2 = 0.81). Considering the five species separately, the slopes of the regressions were not significantly different, but their elevations were significantly different (P < 0.001).
Experiment 3: effect of lime on shoot and root growth, uptake of nutrients and shoot DCAD of timothy and phalaris
Soil pH, extractable Al, and shoot and root yield
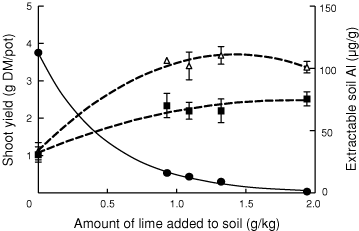
Soil pH(CaCl2) in this experiment was 3.91 in the absence of lime. Addition of 0.93, 1.09, 1.32 or 1.94 g lime/kg increased pH to 4.9, 5.3, 5.4 or 6.0 and decreased extractable Al from 113 µg/g to 16, 13, 9 and 1 µg/g soil, respectively (Fig. 3). Shoot yield responded only to the first increment, 0.93 g lime/kg (Fig. 3).
|
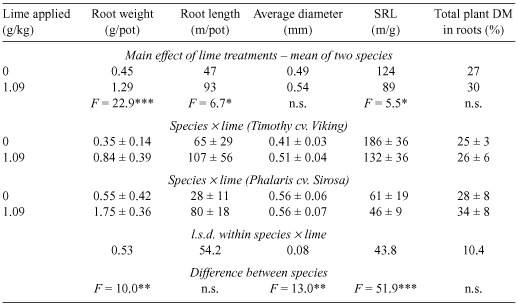
Roots were collected from the unlimed pots and from pots receiving the 1.09 g lime/kg [pH(CaCl2) = 5.3, Al = 13 µg/g]. Lime significantly increased root length and weight and decreased specific root length, but average root diameter and the proportion of total DM allocated to the root were unchanged (Table 3). The species differed in root weight, average diameter and specific root length, but not in root length or the proportion of DM allocated to roots.
|
Concentrations of nutrients and DCAD
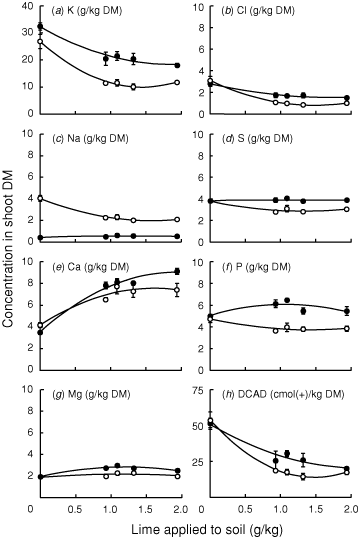
The concentration of K was higher in timothy than phalaris; in both grass species concentrations of K were higher in the shoots of plants from the unlimed soil compared with the limed soil (Fig. 4a). The concentrations of Na were very low in timothy and varied little with lime rate, whereas concentrations were higher in phalaris and declined with lime application (Fig. 4c). The species differed relatively little in Ca or Mg concentrations (Fig. 4e, g) and lime had little effect on Mg, whereas concentrations of Ca increased substantially with lime application. Concentrations of Cl decreased in the presence of lime (Fig. 4b), while S and P were less affected (Fig. 4d, f). The DCAD was ~50 cmol(+)/kg DM in the unlimed soil irrespective of species (Fig. 4h). Liming decreased the DCAD, the effect tended to be greater in phalaris than timothy, particularly at the second and third levels of lime. These treatments also corresponded to large differences in DM yield between the two grass species (Fig. 3).
|
Uptake of nutrients
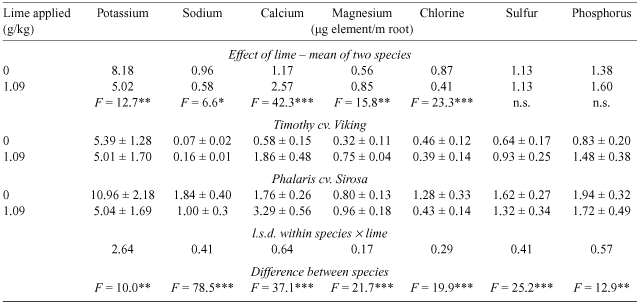
The total uptake of individual mineral nutrients in the shoots at harvest from unlimed and limed treatments, expressed on the basis of root length at harvest (Table 4) was calculated to explore the factors underlying the differences in mineral concentration and DCAD in shoots due to lime application to an acid soil. Clearly, lime substantially increased uptake of Ca and, to a lesser extent, Mg, the other divalent cation measured. Lime decreased uptake per unit length of root of the monovalent cations K and Na and the anion Cl, but had no effect on the anions S and P. There were significant differences between the species. Uptake of Mg and Ca was higher in phalaris than in timothy and the effect of lime was proportionately less. Uptake of K was similar in the two species with lime, but substantially higher in phalaris than timothy in the absence of lime. Uptake of Na by timothy was less than one-tenth that in phalaris, and was decreased by lime in phalaris. Uptake of Cl was similar in the two species in the presence of lime and was increased in the absence of lime, substantially more in phalaris than in timothy.
|
Discussion
The species used in Experiment 1 are found in temperate pastures grown in southern Australia, but are also important components of temperate and Mediterranean pastures elsewhere. Pasture species, including grasses, legumes and weeds showed substantial differences in DCAD, when compared at flowering. This, together with the recorded decline in DCAD in both grasses and legumes over spring and early summer is useful information when selecting diets for prepartum cows that are at risk of developing milk fever. However, the flowering harvests used in the main species comparison were spread over ~2 months. It is thus important to consider to what extent the differences between species were due to the time they were harvested. In addition, our observation that lime application to an acid soil can alter the DCAD of grass herbage and the earlier work of Pelletier et al. (2007a, 2007b), showing that chloride application to grass pastures can lower the DCAD, raise the question of the consistency of the species differences over different environments.
Species differences in DCAD and seasonal effects
In the comparison of species shown in Fig. 1, the DCAD varied 10-fold. In each of the seven species shown in Fig. 2, the DCAD measured at successive harvests declined over this period, as did K concentration. It is noteworthy that of the two medicago species, lucerne had a higher DCAD than barrel medic at harvests two through five (Fig. 2b) yet because barrel medic flowered earlier, lucerne ranked below barrel medic when compared at flowering (Fig. 1). This raises the possibility that differences in the time of flowering could account for the ranking of the species as shown. Consequently, we plotted the DCAD measured at flowering against date of flowering and found a weak relationship (R2 = 0.33). The strong relationship found between K concentration and DCAD compared in the 16 species at flowering was not improved by the inclusion of harvest dates in the regression, perhaps reflecting the relationship between harvest date and K concentration. The fact that the relative ranking of the seven species shown in Fig. 2 was mostly maintained between October and the end of November supports the notion of intrinsic differences in DCAD between species. Clearly, however, when comparing between species, seasonal effects on DCAD must be considered.
Differences among species were also observed among common grasses grown in the field in eastern Canada (Tremblay et al. 2006). The DCAD was lowest in timothy (38 cmolc/kg DM), highest in cocksfoot [66 cmol(+)/kg DM], and intermediate in smooth bromegrass (Bromus inermis Leyss.) [49 cmol(+)/kg DM]. Higher DCAD of cocksfoot and soft bromegrass compared with values of the present paper were due to higher herbage K concentration (from 30.3 to 37.6 g K/kg DM) and lower herbage Cl concentration (from 4.9 to 5.1 g Cl/kg DM) compared with what was observed in the present experiment (from 24.5 to 25.9 g K/kg DM; from 7.9 to 11.5 g Cl/kg DM) for these two species. This could be partly due to the stage of development that was earlier (early- to mid-heading stage) in the experiment from Tremblay et al. (2006) compared with the present experiment (flowering stage).
Concentration of K and DCAD of herbage
The strong relationship between K concentration and DCAD is consistent with earlier work on herbage grasses DCAD (Horst et al. 1997; Tremblay et al. 2006; Pelletier et al. 2006, 2007a, 2007b). In the subset of species sampled over the growing season (Fig. 2), the K concentration and DCAD generally decreased throughout the growing season. A similar observation was made in eastern Canada on the spring growth of timothy; the DCAD was 13 cmol(+)/kg DM lower at the early flowering stage compared with the stem elongation stage (Pelletier et al. 2006). In the present experiment, the increase in both DCAD and K concentration in December for lucerne and white clover (Fig. 2) was possibly due to new growth following summer rain.
The strong correlation between DCAD and K concentration for herbage grown in Experiments 1 and 2 is unsurprising considering that K is quantitatively the major ion included in the calculation of the DCAD, and suggests that when no Cl fertilisation is applied, K concentration could be used as a proxy for DCAD to assess the suitability of herbage for feeding to prepartum dairy cows, in cases where concentrations of all the elements required to calculate the DCAD are not known. Goff and Horst (1997) and Beede (2005) also found that K contributed most of the variation in the DCAD in feeds, but there were some notable exceptions such as oat hay where variations in Na and Cl were more important.
Soil acidity and liming effects on DCAD and nutrient uptake
The effect of lime in decreasing DCAD was predominantly due to the change in K concentration; changes in Cl, S, and Na concentrations played only a minor role because they were present in smaller concentrations compared with K or were less affected by lime.
The action of lime in altering element concentrations in shoots could occur through changes to the supply or availability of mineral nutrients in the rhizosphere, improvement in root growth allowing more soil to be explored, altered uptake of nutrients per unit length of root, dilution effects due to increased shoot growth or altered allocation of nutrients between roots and shoots. Although nutrients in roots were not measured, it is not likely that nutrient allocation between roots and shoot explains alteration in shoot element concentrations with liming because DM allocation between roots and shoots was not altered by lime (Table 3). Clearly, the importance of different factors in determining shoot mineral concentrations differed with the element as lime increased concentrations of Ca and Mg but decreased concentrations of K and Cl and had little effect on concentrations of S and P.
In Experiment 3, lime led to increased root growth because it raised pH above the point causing phytotoxic Al to precipitate out of the soil solution (Table 3; Fig. 3). Shoot yield, however, responded only to the first increment of lime where soil Al was decreased to 16 µg/g soil (Fig. 3). It can, therefore, be concluded that 16 µg Al/g soil was at or below the threshold for toxicity in these grass species and that lower Al contents were not toxic.
The increase in shoot Ca concentration with lime (Fig. 4e) may be caused by the extra Ca supplied in the lime; however, other effects of lime should be considered. The extra root growth would have allowed more soil to be explored. Root growth may also have been improved by the Ca supply as Ca deficiency may occur, particularly in acid subsurface soils (Bruce et al. 1989). A further factor is the increased uptake of Ca per unit root in the lime treatment (Table 4). This may be due in part to the enhanced supply of Ca, but Ca is taken up mainly in the apex region (Marschner 1995), accordingly, lime by improving root growth, may have disproportionately increased the effective absorption surface area and improved the efficiency on a total root length basis. Also, in the unamended soil, high Al may have inhibited uptake of Ca (Huang et al. 1992) and may have altered plant Ca homeostasis (Kikui et al. 2007). Lime increased Mg uptake per unit root (Table 4), but proportionately less than Ca. Analytical grade CaCO3 was used as the source of lime, so no Mg was supplied from this source. The increased efficiency of uptake of Mg with lime may have been due to removal of phytotoxic Al (Clark 1977).
It has been reported that Al inhibits K uptake (Miyasaka et al. 1989), yet in Experiment 3, K uptake per m root was higher in the unamended soil which contained higher levels of toxic Al compared with the limed soil (Table 4). It has also been reported that K present in the soil solution was lower after treatment with lime (Tyler and Olsson 2001), an observation that may partly account for the lower uptake shown in Table 4. The total amount of K in shoots was in fact higher in the limed treatment, 42 mg per pot compared with 30 mg per pot in the untreated soil, an increase of 40% due to lime. By contrast, lime increased shoot weight by 160% (mean of two species), resulting in a decline in concentration by dilution. As well as reduced K in the soil solution, the total supply of K in the soil may have limited uptake in the higher yielding treatments, despite the addition of 35 mg K to all pots in the basal nutrient application. In support of this notion, K concentration in phalaris shoots fell from 27 g/kg DM in the unamended soil to only 12 g/kg DM in the limed treatments. The critical concentration (whole shoots) for maximum growth by this species is in the range of 16–20 g/kg DM (Reuter and Robinson 1997). This implies that the decline in K concentration in herbage, when yields are stimulated by lime, may depend on the K status of the soil. Accordingly, the effect of liming on herbage K (and DCAD) should be examined on other acid soils; however, the present result is not without precedent (Adams 1984). In the case of Cl, none was supplied in the basal nutrients and it is possible that, like K, Cl levels in the soil limited uptake and dilution accounted for the drop in Cl concentration in the limed treatment compared with the unamended control.
The major difference between timothy and phalaris in Na uptake per m root (Table 4) was also reflected in the Na concentration of the shoots (Fig. 4c) and may be due to their divergent behaviour towards Na. Timothy is known to be natrophobic (Griffith and Walters 1966) and Na concentration in its herbage remains low regardless of the growth conditions. Alternatively, phalaris is natrophilic (Oram et al. 2002). Timothy also had higher K and higher DCAD than phalaris in the limed treatments (Fig. 4a, h), an interesting result in view of previous work that indicated timothy had DCAD values consistently lower than some other pasture grasses (Tremblay et al. 2006). Limited supply of K in the soil may have contributed to this result, and further comparisons examining effects of phenological stage and growth conditions are warranted.
The DCAD and milk fever calculations
None of the species had a DCAD below –5 cmolc/kg DM, the target value for the diet after the addition of any supplements and anionic salts (Fig. 1). Several of the grasses listed in Fig. 1, as well as lucerne and barrel medic late in the season (Fig. 2) and timothy and phalaris with higher rates of lime (Fig. 4h) had a DCAD lower than 25 cmol(+)/kg DM, the maximum value acceptable for herbage alone. Horst et al. (1997) argue that above this value, it is particularly difficult to add enough anionic salts to lower the DCAD of the diet to an acceptable value without experiencing palatability problems.
A recent meta-analysis of a large number of trials (Lean et al. 2006) has provided strong support for the theory that high DCAD diets immediately before calving are associated with increased incidence of milk fever. That study also concluded that in addition to DCAD as determined by Eqn 1, the concentrations of Ca, Mg, and P in the diet also influenced the likelihood of cows developing milk fever.
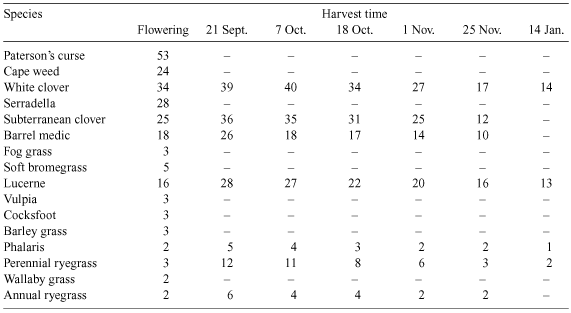
Ranking the species grown in Experiment 1 for risk of milk fever, estimated by Eqn 2 (Lean et al. 2006), showed a broad similarity to the ranking according to the DCAD (Table 5; Fig. 1). For example, in both cases the grasses ranked generally lower than the legumes and other dicots. However, there were important exceptions, the major one being lucerne, which ranked below fog and soft bromegrasses on the basis of DCAD when compared at flowering (Fig. 1). Ranked on the basis of milk fever risk at the same growth stage, lucerne was similar to barrel medic, both medicago species being at the lower end of the range for legumes, but substantially higher than the grasses (Table 5). The different rankings by the two measures can be accounted for largely by the higher Ca concentrations in the legumes and weeds than in the grasses (Ca is included in the milk fever risk equation but not in the calculation of the DCAD with Eqn 1).
|
The trend of the changes over the season in DCAD and milk fever risk were similar (Fig. 2; Table 5); however, the effect of lime application produced quite different trends in the two measures. The DCAD declined with lime application in the grasses in Experiment 2 (Table 2), while calculated milk fever risk increased from <5% without lime to 13% at the highest rate of lime (mean values for five grasses) (data not shown). Lime lowered plant K concentration, accounting for the decline in DCAD (Table 2), and at the same time increased plant Ca concentration, accounting for the increase in milk fever risk. The trends in the two measures in Experiment 3 were similar to those in Experiment 2 – the DCAD decreased due to lime (Fig. 4h) while milk fever risk increased (data not shown).
Although the emphasis in this paper has been on the use of mineral element concentrations in herbage for dry, prepartum cows to calculate the DCAD and milk fever risk, the concentrations of the elements K, Ca and Mg can also be used to calculate the risk of grass tetany (hypomagnesaemia), another major mineral-related disorder of lactating animals. The risk of animals developing grass tetany has been shown to increase substantially as the ratio K/(Ca + Mg) in the herbage rises above 2.2, calculated on a molar charge basis (Kemp and ‘t Hart 1957). Using the data from Experiment 1, the K/(Ca + Mg) ratio in the grasses often exceeded 2.2, particularly in the early harvests, thus indicating some risk of grass tetany. At flowering, the mean of the ratios for the nine grasses shown in Fig. 1 was 2.1 (range 1.5–2.5), considerably higher than the values for the five legumes (mean 1.0, range 0.6–1.3). This is the reverse of the rankings of the species with respect to risk of milk fever (Table 5), an important difference when considering diets for cows before or after calving.
The importance of the DCAD in determining the suitability of herbage for prepartum diets of dairy cows is clearly well established; however, the findings discussed above suggest that it would be prudent to consider a range of properties, not only DCAD, particularly when examining the effects of different cultural practices on the composition of herbage for such diets or assessing the use of unfamiliar species for that purpose.
Acknowledgements
The authors would like to acknowledge the technical assistance of David Marshall, Adam Stefanski and Scott McDonald in the pot experiments and Patricia Wallace for XRFS analyses. Sophie Pelletier thanks CSIRO for hosting her visit and acknowledges the financial support of Fond québécois de la recherche sur la nature et les technologies, NOVALAIT Inc., Ministère de l’Agriculture, des Pêcheries et de l’Alimentation du Québec and Agriculture and Agri-Food Canada.
Braschkat J, Randall PJ
(2004) Excess cation concentrations in shoots and roots of pasture species of importance in south-eastern Australia. Australian Journal of Experimental Agriculture 44, 883–892.
| Crossref | GoogleScholarGoogle Scholar |
CAS |
[Verified 4 June 2008]
Scott BJ,
Ridley AM, Conyers MK
(2000) Management of soil acidity in long-term pastures of south-eastern Australia: a review. Australian Journal of Experimental Agriculture 40, 1173–1198.
| Crossref | GoogleScholarGoogle Scholar |

Tremblay GF,
Brassard H,
Bélanger G,
Seguin P,
Drapeau R,
Brégard A,
Michaud R, Allard G
(2006) Dietary cation-anion difference (DCAD) of five cool-season grasses. Agronomy Journal 98, 339–348.
| Crossref | GoogleScholarGoogle Scholar |
CAS |

Tyler G, Olsson T
(2001) Concentrations of 60 elements in the soil solution as related to the soil acidity. European Journal of Soil Science 52, 151–165.
| Crossref | GoogleScholarGoogle Scholar |
CAS |


