

Interactions of hydrophobic metal complexes and their constituents with aquatic humic substances
Amiel Boullemant A B , Jean-Pierre Gagné C , Claude Fortin A and Peter G. C. Campbell A DA INRS-Eau, Terre et Environnement, Université du Québec, 490 de la Couronne, Québec, QC, G1K 9A9, Canada.
B Present address: Alcan Research and Development Centre, Jonquière, QC, G7S 4K8, Canada.
C Institut des Sciences de la Mer, 310 allée des Ursulines, Rimouski, QC, G5L 3A1, Canada.
D Corresponding author. Email: campbell@ete.inrs.ca
Environmental Chemistry 4(5) 323-333 https://doi.org/10.1071/EN07046
Submitted: 4 July 2007 Accepted: 1 October 2007 Published: 2 November 2007
Environmental context. Lipophilic metal complexes, because they can readily cross biological membranes, are especially bioavailable. However, in natural waters these complexes do not necessarily exist in a free state, i.e. they may bind to the organic matter (humic substances) that is present in natural waters. It follows that the in situ bioavailability of lipophilic metal complexes will tend to be less than that measured in simple laboratory experiments.
Abstract. The ability of dissolved humic substances (HS: fulvic and humic acids) to complex cationic metals is well known, but their interactions with neutral lipophilic metal complexes are little understood. In the present study, we have examined the behaviour of two such complexes (Cd L02: L = DDC = diethyldithiocarbamate, or L = XANT = ethylxanthate) in the presence of Suwannee River Humic and Fulvic acids. Interactions between the neutral complexes and the humic substances were assessed by excitation-emission matrix (EEM) fluorescence spectroscopy at pH 5.5 and 7.0, and by equilibrium dialysis experiments (500 Da cut-off). The EEM measurements were carried out by titrating the humic substances (6.5 mg C L–1) with Cd, in the absence or presence of ligand L (1 µM DDC or 100 µM XANT). Given the very high stability constants for the complexation of cadmium by DDC and XANT and the excess ligand concentration, virtually all (>96%) of the Cd added to the L + HS matrix was calculated to be present as the neutral CdL20 complex over the entire pH range tested. For both humic substances, addition of DDC or XANT alone led to shifts in the fluorescence spectra at both pH values, indicating that the DDC– and XANT– anions likely interact by electrostatic or hydrogen bonding within the humic molecules. The subsequent addition of Cd to these L + HS systems resulted in a disproportionately large enhancement of the fluorescence intensities of individual EEM peaks, this fluorescence enhancement being only slightly decreased by the shift from pH 7.0 to 5.5. We interpret this enhancement as evidence that the two neutral complexes associate with the humic substances, presumably by forming ternary complexes (Ln-Cd-HS). Hydrophobic interactions between the humic substances and the neutral complexes may also contribute, but to a lesser extent, as demonstrated by partitioning calculations based on the lipophilicity of the neutral complexes. The association of the neutral complexes with Suwannee River Humic Acid was confirmed by dialysis experiments.
Additional keywords: Cd, equilibrium dialysis, fluorescence, lipophilic metal complexes, ternary complexes.
Introduction
One of the benefits of the current drive to carry out comprehensive ecological risk assessments for metals of environmental concern, notably in Europe and North America, has been a renewed interest in modelling the interactions of metals with aquatic organisms. A major goal of these risk assessments is to improve the tools used to predict metal bioavailability (uptake and toxicity). In this context, the Biotic Ligand Model or BLM has gained widespread acceptance in the scientific and regulatory communities as the method of choice for relating exposure conditions (metal speciation, ambient water chemistry) to metal toxicity.[1–3]
Lipophilic metal species constitute one of the recognised exceptions to the BLM, in that they can cross biological membranes by simple diffusion through the lipid bilayer,[4] bypassing the normal metal transporter proteins that are involved in the uptake of cationic metals.[5,6] However, almost all the experiments demonstrating this greatly enhanced uptake of lipophilic complexes have been carried out in the laboratory, in the absence of natural organic matter. We asked an obvious question: will this same enhancement occur in the natural environment, in the presence of natural organic matter (humic substances, HS)? The answer to this question is not immediately obvious. On the one hand, from the literature on hydrophobic organic contaminants (HOCs), we know that humic substances can form hydrophobic bonds with such molecules, leading to a decrease in their bioavailability[7] – if this mechanism applied to hydrophobic metal complexes too, then the enhanced uptake observed in the laboratory in synthetic systems might well be attenuated in natural systems. However, it is also known that humic substances are surface active, that they collect at interfaces (including the surfaces of living cells),[8] and that under certain circumstances, they can enhance the permeability of biological membranes towards neutral, lipophilic substrates[9] – if this mechanism dominated, then the enhanced uptake observed in the laboratory in synthetic solutions might be even more pronounced in the presence of humic substances.
In an earlier study,[10] using Cd(DDC)02 (DDC = diethyldithiocarbamate) as a representative lipophilic metal complex and a unicellular green alga (Pseudokirchneriella subcapitata) as the target organism, we demonstrated that at neutral pH the first of these two mechanisms was dominant (i.e. uptake of the metal complex was lower in the presence of Suwannee River Humic Acid (SRHA) than in its absence). However, this protective effect reversed at pH 5.5, the addition of SRHA increasing the uptake of the neutral complex compared with the system in the absence of humic acids.
Interactions between neutral metal complexes and humic acids have not been extensively studied. The present study was undertaken to determine the nature of the bonding involved with Cd(DDC)02 and to evaluate whether these results could be generalised to other CdL02 complexes. To this end, we have extended our earlier observations on Cd(DDC)02 to a second neutral complex, Cd(XANT)02 (XANT = ethylxanthate), have considered both humic and fulvic acids, and have investigated the sensitivity of the interactions to pH changes. Equilibrium dialysis and three-dimensional excitation-emission matrix (EEM) fluorescence spectroscopy were used to probe the interaction of the humic substances with Cd alone, with the ligands alone, and with the CdL02 complexes.
Experimental
Reagents and glassware
All glassware and polycarbonate containers were soaked for at least 24 h in 10% HNO3, thoroughly rinsed seven times with ultra-pure water (18 MΩ cm; Milli-Q3RO/Milli-Q2 system, Bedford, MA, USA) and dried under a laminar flow hood before use. All stock solutions were prepared with ultra-pure water and reagents used for experiments were of analytical grade or better.
Sodium diethyldithiocarbamate trihydrate (NaDDC: ACS quality, purity >99%) was purchased from Sigma Aldrich (St Louis, MO, USA). Potassium ethylxanthate (KXANT: purity >98%) came from Alfa Aesar (Ward Hill, MA, USA). Stock solutions of DDC (40 mg NaDDC) were prepared daily in 100 mL methanol (ACS quality, HPLC grade; Fisher Scientific, Fairlawn, NJ, USA) in order to minimise any degradation of the DDC.[11,12] Similar stock solutions of XANT (50 mg) were prepared monthly in 100 mL methanol.[13] Final concentrations of these ligands in the aqueous solutions (1 µM DDC or 100 µM XANT) were chosen to assure complexation of virtually all of the Cd present in solution (>96%). Standard Suwannee River Humic and Fulvic Acids (SRHA and SRFA respectively, from the International Humic Substances Society (IHSS), St Paul, MN, USA) were selected as representative and well-characterised samples of freshwater humic substances. Stock solutions of SRHA were prepared in ultra-pure water, adjusted to pH 9 with NaOH, and prefiltered through 0.2-μm polycarbonate membranes. The same process was applied to SRFA but the pH was not adjusted (pH near 5.0) because the fulvic acid is soluble at all pH values. The final concentrations of the two stock solutions, as determined by sample combustion after acidification and sparging (total organic carbon analyser, TOC-5000A, Shimadzu, Kyoto, Japan), were between 0.5 and 1 g C L–1.
Buffers were used in the synthetic solutions at pH 7.0 (N-2(hydroxyethyl)piperazine-N′-(2-ethanesulfonic acid), HEPES, purity >99.5%; Sigma Aldrich, St Louis, MO, USA) and pH 5.5 (2-(N-morpholino)ethanesulfonic acid, MES, purity >99.5%; Sigma Aldrich, St Louis, MO, USA). These buffers are known to be non-complexing towards cadmium.[14,15] Radioactive cadmium used for dialysis experiments (109Cd; 60 μCi mmol–1, 0.1 M HCl solution) was purchased from Amersham Bioscience (Buckinghamshire, UK) and was diluted as appropriate with non-radioactive cadmium from an analytical standard solution (SCP Science, Montreal, Canada, 1 g L–1).
Samples for the dialysis and fluorescence measurements were prepared in synthetic solutions (Modified High Salt Medium or MHSM) corresponding to the algal exposure media used in our original experiments.[10] The composition of these solutions (major cations and anions) is summarised in Table 1.
|
Dialysis experiments
To quantify the association of CdL02(L = DDC, XANT) with dissolved SRHA, we carried out equilibrium dialysis experiments. Dialysis bags with a nominal molecular mass cut-off of 500 Da were used (Spectra/Por CE, Spectrum, Houston, TX, USA). Each bag was initially filled with MHSM solution (~45 mL – see Table 1) containing Cd (0.4 nM) and SRHA (6.5 mg C L–1), and either DDC (1.0 μM) or XANT (100 µM). Dialysis experiments were not conducted with SRFA; its effective molecular weight is much lower than that of SRHA, and accordingly it would have been slowly lost to the bulk solution. The dialysis bags were introduced into a beaker containing 900 mL of a solution with the same concentrations of Cd and ligand, but no humic acid. Aliquots (2 mL) inside and outside the bag were collected every day for 5 days, the time required to reach equilibrium. The concentration of 109CdL02 in the aliquots was determined by measuring their radioactivity with a gamma counter (LBK Wallac Compugamma Model 1282, Turku, Finland). A counting window of 16–32 keV was used (main peak at 22 keV) and the counting time was set to 2000 s or to a maximum collection of 100 000 counts. Counts per minute (cpm) were converted into Cd molar concentrations, taking into account the detector efficiency, radioactive decay and the 109Cd specific activity. Any association between neutral complexes and SRHA should lead to an increase in the amount of 109Cd inside the dialysis bag.
Octanol–water partitioning
The octanol–water distribution coefficients (Dow) of the neutral CdL02 complexes were determined by the well-known shake-flask method, which is suitable for low-to-moderate log Dow values (e.g. <6[16]), as anticipated for the neutral complexes studied here. Samples were prepared in triplicate for each pH (7.0 or 5.5) in MHSM (Table 1). Ligand/cadmium ratios were the same as for the fluorescence samples (see next section). Radiolabelled 109Cd was used to follow the partitioning of the neutral complexes between the 5 mL 1-octanol phase (water-saturated; ACS grade, purity >99.6%, Sigma, St Louis, MO, USA) and the aqueous (15 mL) phase. The test tubes were shaken for 20 min and the immiscible phases were allowed to separate for 1 h.[17]
Fluorescence samples
Samples for fluorescence measurements were prepared in MHSM (50 mL). The pH was adjusted (7.0 or 5.5) by addition of 10–2 M HEPES or MES. Ligand and metal concentrations were similar to those used in the earlier algal experiments,[10] so that we could relate the fluorescence results to trends observed in the uptake of the neutral Cd complexes by the test algae. Ligand concentrations were [HS] = 6.5 mg C L–1 and either [DDC] = 1.0 µM or [XANT] = 100 µM. Samples were allowed to equilibrate for 24 h and then were filtered through 0.2 µm polycarbonate filters before the fluorescence measurements were initiated. This equilibration was carried out with rotary agitation (100 rpm), at the ambient temperature (~23°C) and in the dark so as to avoid any potential photooxidation of the humic substances or the HEPES buffer.
In control experiments, we titrated the humic substances with Cd, in the absence of DDC or XANT, and followed changes in the fluorescence spectra. Solutions of each humic substance were prepared in Teflon bottles and an aliquot was characterised by EEM spectroscopy. Cadmium was then added to the bottle to achieve the desired concentration and after an equilibration time of ~15 min, the EEM measurements were repeated. This step was repeated to give six different Cd concentrations (from 0.1 nM to 10 µM in factor 10 steps); after each addition the pH was checked and adjusted if necessary to 7.0 or 5.5.
The same approach was used to study the ternary Cd-L-HS systems. After recording an initial EEM for SRHA or SRFA alone, we then added the organic ligand L and obtained a second EEM. Cadmium was then added in a stepwise manner to the same Teflon bottle (final Cd concentrations from 0.38 to 162 nM; pH adjusted as necessary after each addition). EEM measurements were performed after each successive addition, following an equilibration period of ~15 min.
Fluorescence measurements
Samples for fluorescence measurements were placed in 4 mL quartz cuvettes with a 1-cm path length. Excitation-emission matrix (EEM) measurements were performed on a Varian Eclipse fluorimeter (Varian Canada, Mississauga, ON, Canada) and data were treated with its Eclipse software. Spectra were acquired for wavelengths ranging from 220 to 360 nm (5-nm steps) and from 380 to 580 nm (1-nm steps) for the excitation and the emission spectra respectively. Slit widths were fixed at 5 nm for both excitation and emission. The scanning speed was set at 600 nm min–1. Contour plots were prepared with Sigma Plot 8.02 (Systat Software Inc., Point Richmond, CA, USA).
The ‘corrected spectra’ function was selected for each sample, in order to account for instrumental biases. All corrected spectra were obtained by subtracting a blank corresponding to the spectrum obtained for the inorganic matrix, at pH 7.0 or 5.5, under the same experimental conditions, in order to diminish the Raman and Rayleigh bands; negative values were arbitrarily set to zero.[18] Light absorption was measured for all samples between 220 and 580 nm at a scan speed of 600 nm min–1 on a UV-visible spectrophotometer (Cary 100 Bio, Varian), with a baseline correction for the blank inorganic matrix, at pH 7.0 or 5.5. This was done to check for primary and secondary inner filter effects.[19] We then calculated an exact correction factor fcorr = 10–Atotal, where Atotal = Aexcit + Aemit, Aexcit = 0.5 · A(λi), and Aemit = 0.5 · A(λi); λi represents the ith wavelength and 0.5 is the effective path length of excitation light in a 1-cm cell, and is also the coefficient for the emission path length.[19–21] This correction factor was never below 0.97, implying only very minor corrections as expected for such dilute samples. Lastly, we normalised all the sample results by the area under the Raman scatter peak (λexc = 350 nm), as measured on a blank for each day of the experiments and for each pH.[18] Overall, this approach allowed us to correct for instrumental biases and drift, yielding results that should be comparable with other EEM measurements. To avoid the measurement of Rayleigh scattering peaks (interaction between the excitation light and water molecules), measurements were done for λemission < λexcitation + 15 nm. Fluorescence measurements were performed at room temperature (23°C). All spectra are presented with emission spectra on the x-axis, excitation spectra on the y-axis and fluorescence intensity on the z-axis, expressed as 1000 × Raman units nm–1.
Speciation calculations
For solutions that did not contain humic substances, Cd speciation in solutions was computed with the MINEQL+ chemical equilibrium program,[22] using an updated thermodynamic database (http://www.inrs-ete.uquebec.ca/activites/groupes/biogeo/personal.htm, accessed 3 July 2007). The thermodynamic data from the default database supplied with the MINEQL+ software (v. 4.5) were updated by comparison with the National Institute of Standards and Technology (NIST) Critical Stability Constants of Metal Complexes Standard Reference Database.[23] For solutions containing humic substances, we used the Windermere Humic Aqueous Model (WHAM VI[24]). In addition to the dissolved Cd concentration, input data included the major cations and anions, the known humic substance concentration, measured dissolved iron and aluminium concentrations (present as inorganic residues in SRFA and SRHA), and the solution pH.
Results and discussion
Cadmium speciation in the test solutions
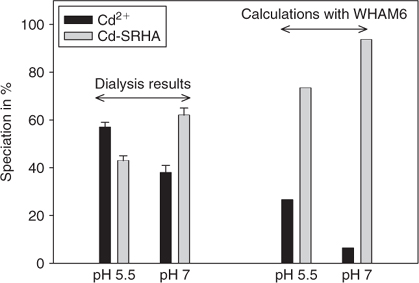
The equilibrium dialysis experiments, carried out at a total Cd concentration of 0.38 nM in the presence of SRHA, showed that 38 ± 3 and 57 ± 2% of the Cd was present in dialysable form, i.e. as uncomplexed inorganic Cd, at pH 7.0 and 5.5, respectively (see Fig. 1). Simulations with the WHAM equilibrium speciation model showed a similar trend with pH for the Cd-SRHA system (pH 7, 6% Cd2+; pH 5.5, 27% Cd2+), but the predicted degree of complexation was greater than that indicated by dialysis. Equilibrium dialysis measurements were not carried out with SRFA samples, owing to expected leakage from the dialysis bags. WHAM simulations for the Cd-SRFA system predicted somewhat lower free Cd2+ concentrations than in the presence of SRHA: 3 and 15% at pH 7.0 and 5.5, respectively. This higher calculated complexation of Cd in the presence of SRFA was due to the lower metal content of the fulvic fraction compared with the humic fraction (especially Al and Fe, as determined experimentally – data not shown), thus decreasing the competition between these metals and Cd for binding to SRFA.
|
Equilibrium speciation simulations (MINEQL+) for binary Cd-L systems (no HS) indicated that in the presence of the test ligands DDC and XANT, more than 96% of the cadmium would be complexed as the CdL02 complex at pH 5.5 and 7.0. The appropriate stability constants (KML, KML2, KHL,...) were introduced into the WHAM database (Table 2), and simulations were then run for the ternary system (Cd-L-HS); predictions for both pH 5.5 and 7.0 indicated that the complexation of Cd by the humic substances was too weak to compete with binding by XANT or DDC, such that essentially all the Cd remained in the CdL02 form.
|
Humic substances EEM plots: effects of pH, concentration and HS fraction
To assess any effects of cadmium and ligands added to the aquatic humic substances, it was necessary to establish a reference spectrum. As Cd, DDC, XANT and their respective complexes do not exhibit any fluorescence response at the concentrations tested, the EEM plots of the humic substances were used as the reference point. Initial runs were performed in the absence of added Cd or synthetic ligands, to determine the effects of pH, HS concentration, and HS fraction on the fluorescence response. For reference humic substances, we repeated spectral measurements five times to determine a 95% confidence interval for peak values in the matrix. This value (±3%) was used to discriminate between negligible and true changes in HS fluorescence.
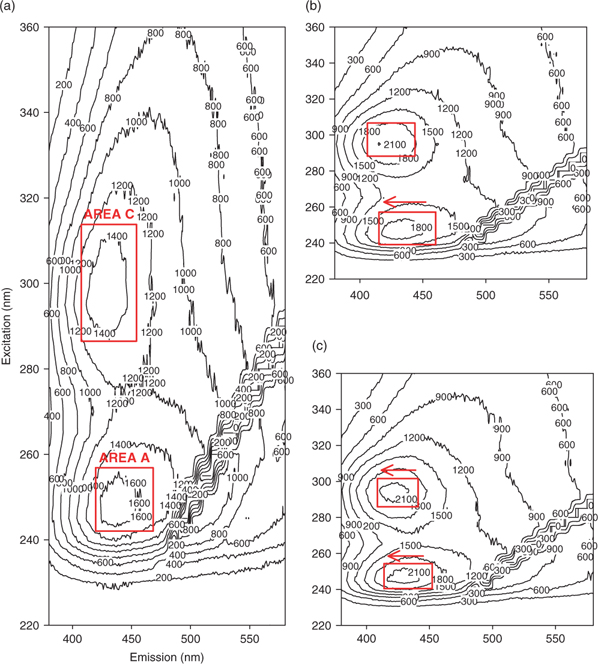
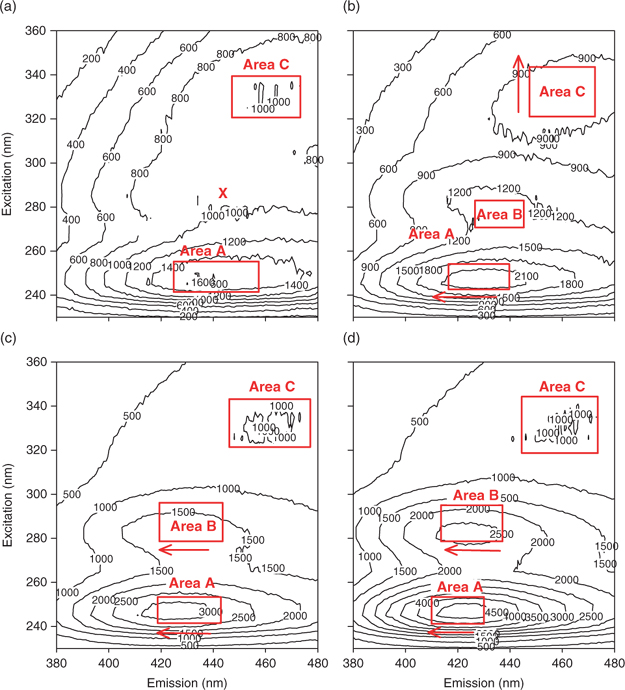
Fluorescence EEM plots for humic substances typically exhibit two or three peaks, located between the first- and second-order Rayleigh scattering bands. These Rayleigh bands, attributable to interactions between water molecules and the excitation light,[25] are barely visible in the present study owing to the blank correction. The three HS peaks, designated areas A, B (when present) and C for convenience, are located as follows (with their excitation-emission wavelength pairs) – see Fig. 2a: A = 245–255 nm/430–465 nm; B = 280 nm/430–443 nm; and C = 315–335 nm/430–460 nm. A relatively wide range has been assigned for each area, because the positions of the maxima vary as a function of pH and the HS fraction. Areas A and C are often reported for aquatic humic substances and seem to be quite universal.[26,27] In contrast, relatively few studies report peaks in area B and none of them offer an explanation for their presence.[27] In our study, maxima in this area were only observed at pH 7.0 for SRHA and SRFA.
|
We characterised the fluorescence of the humic substances at a constant concentration of 6.5 mg C L–1. This environmentally relevant concentration gave a strong fluorescence signal and a good resolution of the peaks in regions A, B and C; the fluorescence intensities of these peaks increased as the pH was raised from 5.5 to 7.0, in agreement with the literature on SRHA and SRFA[27,28] and other humic substances. The EEM plots for SRFA and SRHA were similar, but exhibited differences in peak positions and intensities, as expected on the basis of their known differences in functional group content.[26,29]
In the following discussion of the EEM results, we consider first the binary systems (i.e. Cd + HS and L + HS), and then the ternary system where Cd was added progressively to a matrix containing L and HS.
Fluorescence spectra of humic substances in the presence of cadmium
At pH 7.0 and for both HS fractions, addition of Cd enhanced the fluorescence of peak A (and peak B if present), with in general a concomitant blue shift for these peaks (e.g. Fig. 2), but Cd addition did not significantly affect the fluorescence of peak C. By analogy with earlier work on metal–HS interactions,[30] we attribute the observed shifts to an alteration of the molecular geometry of the ‘fluorophores’ due to the binding of Cd. The term fluorophore is used here to designate the functional groups within the humic (supra)molecule that are responsible for fluorescence; some fluorophores (e.g. quinones) may give rise to more than one EEM peak.[31] The blue shifts of the emission spectra are consistent with the participation of phenolic moieties in the metal–humic substances complexation process.[32] At pH 5.5, Cd additions also increased the fluorescence intensity, and as in the experiment at pH 7, we observed blue shifts for all peak areas, especially in the case of the emission spectrum (the excitation spectrum exhibits weak or negligible blue shifts).
To compare the humic and fulvic acids for the two pH conditions, and to integrate all the EEM data, we calculated an overall index of fluorescence intensity (FI) that takes into account the change in each area in a specified treatment (HS fraction, pH, compound(s) added) divided by the reference (same HS fraction, same pH but no compound(s) added). The calculation is as follows:
where Ii,0 is the intensity of the reference peak i (A, B or C) of the humic substance alone, and Ii is the fluorescence intensity for the same wavelength pair but in the presence of added Cd, added L or added Cd and L. Note that an FI > 0 means an enhancement of the fluorescence intensity (considering all the peaks), whereas an FI < 0 reflects fluorescence quenching.
Plotting fluorescence indices against [Cd]T yielded the following trend: FI = α ln[Cd]T + β (n = 6), with r2 > 0.95 for all combinations of pH and HS fraction (Fig. 3). Based on the parameters α and β, which are empirical fitting parameters (no physico-chemical meaning), the effect of the Cd titration decreased in the order SRFA pH 7.0 > SRHA pH 7.0 > SRHA pH 5.5 ≈ SRFA pH 5.5. That effects are greater at pH 7.0 than at pH 5.5 is consistent with the anticipated competition between the proton and Cd2+ for available HS binding sites,[33] leading to less Cd binding at the lower pH (cf. WHAM predictions for SRFA and SRHA – see the speciation section). Implicit in this argument is the assumption that Cd-induced changes in fluorescence intensity reflect a complexation reaction between Cd and the HS, though not necessarily with a specific fluorophore.[34,35]
|
Most studies of the effects of metals on the fluorescence of humic substances have reported fluorescence quenching.[32] The observation of enhanced fluorescence as a result of Cd addition is thus unusual, particularly in view of the very low (nM) Cd concentrations that we have used. However, the few published results available for the Cd-HS system were not obtained with the EEM approach,[32] or were obtained with experimental conditions far from ours;[36] the experimental media differed from the MHSM medium used in the present study, and the authors’ choice of wavelengths did not correspond to the excitation-emission peaks where we observed enhancement. Grassi and Daquino[37] did report fluorescence enhancement on addition of Cd to SRFA, but they worked at extremely high concentrations of SRFA and Cd, such that Cd addition led to the formation of insoluble adducts. Fluorescence enhancement was observed on samples just before effective precipitation occurred and the authors interpreted this enhancement as spectroscopic evidence for the onset of aggregation phenomena.
Fluorescence spectra of humic substances in the presence of organic ligands (no Cd)
Before investigating the interactions of the test ligands (DDC, XANT) with the humic substances, we first confirmed that neither ligand on its own fluoresced in the pH and concentration ranges of interest.
For both the humic and fulvic acids, the addition of DDC (1.0 µM) enhanced or had no effect on the EEM peaks. The presence of DDC led to the appearance of area B (Fig. 4b) but did not result in noticeable shifts (>5 nm) of peaks A, C or B (when applicable) for SRHA at both pH values. In the SRFA case, at pH 5.5 peak A displayed a blue shift of the emission spectrum but exhibited a red shift at pH 7.
|
Based on the overall FI (greater at pH 7.0 than 5.5), the association of the HS with DDC was greater at the higher pH (Table 3), suggesting the involvement of non-hydrophobic interactions (if hydrophobic bonds were involved, the interaction would be favoured at the lower pH, where the HS is more protonated). Interactions between DDC and HS were most obvious for peak A, with 38 and 13% enhancement at pH 7.0 respectively for SRFA and SRHA (Table 3, Fig. 4b), suggesting that the major interaction takes place in the vicinity of the fluorophore responsible for this peak. Although interactions with DDC were pH-dependent, the enhancement of peaks A and B followed the same trend at both pH values, i.e. SRFA > SRHA, as indicated in Table 3. The greater enhancement at pH 7.0 than pH 5.5 for SRHA and SRFA may be related to conformational changes within the humic (supra)molecule. At neutral pH, where interactions between HS and DDC (pKa = 3.42[23]) are stronger, both molecules are more deprotonated than at acidic pH. With the increase in pH, the HS molecules become less spherical and more elongated.[38] We speculate that this opening up of the molecule may make some new sites (e.g. nitrogen heterocycles) available to interact with the DDC– anion, leading to a greater SRFA–DDC or SRHA–DDC association at circumneutral pH.
|
In contrast to DDC, the addition of XANT quenched the HS fluorescence signal, especially for peak C of SRHA at both pH values (Table 3). Emission and excitation spectra shifted towards red wavelengths for both pH values and for both HS fractions. These changes were reflected in the overall FI, which decreased on addition of XANT but was unaffected by the pH change from 7.0 to 5.5. Clearly the xanthate anion interacts with the humic substances, presumably via hydrophilic interactions, but the effects of this interaction on the fluorescence behaviour of the HS are very different from those of DDC. On the basis of the different functional groups present in the two organic ligands, we speculate that DDC– and XANT– bind to the humic substances by hydrogen bonds (involving N or O as electron donors); the N atom within the DDC molecule would interact mainly with the fluorophore responsible for peak A, whereas the O atom within the XANT molecule would interact principally in the vicinity of the fluorophore responsible for peak C.
From a mechanistic perspective, interactions between non-polar organic compounds and humic substances are well documented in soils[38,39] and in aquatic systems[7] and it is commonly thought that these interactions are hydrophobic in nature. However, DDC and XANT are largely present as anions over the pH range of 5.5 to 7.0 used in the present study. Interactions between anions and humic substances are not without precedent, but they have been much less studied than the binding with cations or with hydrophobic organic molecules. Possible mechanisms for interactions with anions include electrostatic bonding,[40] hydrogen bonding or the formation of ternary complexes in the case of ligands such as DDC– and XANT–.[33] We tested for the possible involvement of ternary complexes by increasing the concentrations of potential bridging cations (Ca2+ or Mg2+, the only other divalent cations present in the solution) by a factor of 10; the HS–DDC interaction was unaffected by this manipulation, suggesting that ternary complex formation was not responsible for the binding (data not shown).
Fluorescence spectra of humic substances in the presence of neutral CdL02 complexes
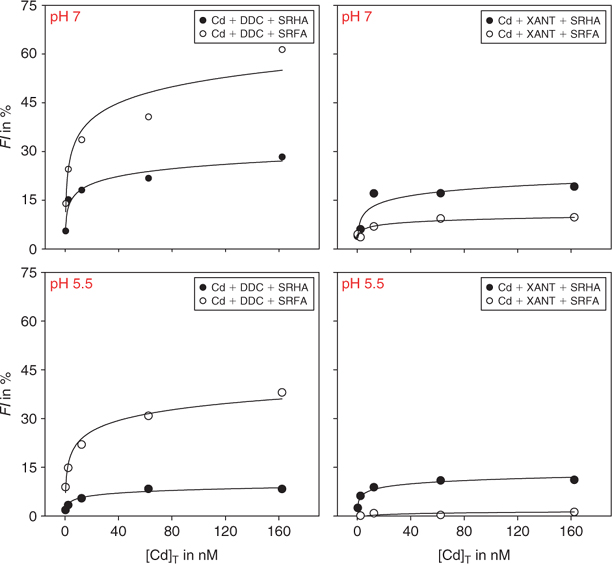
The titration of the HS-L matrix with Cd did not change the calculated speciation of Cd, i.e. Cd(DDC)02 and Cd(XANT)02 remained the dominant species (respectively 99.9 and 96.5%) in the sample. The titration did however lead to a marked enhancement of the fluorescence intensity index (FI > 0; see Fig. 5). To our knowledge, this is a first demonstration of such behaviour of Cd in systems containing humic substances and organic ligands.
|
At both pH values, and for both neutral CdL02 complexes, peaks A and B were strongly affected by the addition of Cd whereas peak C was relatively insensitive. Almost all cases exhibited a blue shift for the excitation and emission spectra of peak A, suggesting the implication of phenolic moieties in the association HS–CdL02 . At the low concentrations used in the present study, the neutral complexes CdL02 do not exhibit any fluorescence on their own, and thus the changes in the fluorescence spectra reflect interactions with the humic substances, not spectral interferences. Comparison of the spectra for the binary L-HS and ternary Cd-L-HS systems shows that the addition of cadmium enhanced the fluorescence intensities observed previously with the L-HS mixtures, regardless of whether or not the organic ligand L alone quenched the HS reference spectrum. Note that this comparison between the ternary system and the binary one (L-HS) is valid, given that the concentration of free Cd2+ is vanishingly small in all Cd-L-HS systems (i.e. too low to affect HS fluorescence).
The strength of the CdL02–HS interactions and the disproportionate effect of Cd at both pH values are quite remarkable, given that the added Cd concentration (0.38 to 162 nM) is two to five orders of magnitude lower than the concentrations of organic ligands, respectively. Similarly, the humic substance concentrations are much higher than that of the added Cd (~10 to 104 times higher, based on average molecular weights of 1828 and 3419 g mol–1 for SRFA and SRHA, respectively; calculated from Perdue and Ritchie[41]).
We initially considered two possible mechanisms for the interactions in the ternary Cd-L-HS systems. First, as has been suggested in the literature,[11,33] the cadmium could act as a bridge between organic ligands and humic substances, forming a ternary complex (Ln-Cd-HS). Second, given the lipophilicity of the neutral CdL02 complexes (as indicated by their extractability into organic solvents such as octanol) and their high thermodynamic stability, they could interact with the hydrophobic core of the humic substance molecules. If the first mechanism were operative, lowering the pH from 7.0 to 5.5 would increase the competition between the proton and Cd2+ for the HS and for the added organic ligand, leading to a decrease in the concentration of the ternary complex and an attenuation of the FI. In contrast, if variations of the FI were due to hydrophobic interactions between the HS and the neutral CdL02 complex, then the decrease from pH 7.0 to 5.5 should increase the hydrophobicity of the HS molecule, leading to a greater FI at the lower pH. Another hypothesis emerged from an analysis of the Dow values of the neutral complexes (present as more than 96% of the total Cd): for Cd(DDC)02, Dow ≈ 300 at both pH; for Cd(XANT)02, Dow ≈ 60 at both pH. This lipophilicity of the neutral complexes over the pH range 7.0 to 5.5 might well be sufficient to allow mechanisms 1 and 2 to act simultaneously, in which case the HS–CdL02 association would be less affected by a decrease of pH.
We modelled the experimental points in Fig. 5 by regression (on five measurements): FI = α ln[Cd]T + β. Interactions are clearly higher at circumneutral than acidic pH. Indeed, in almost all cases, the parameters α and β significantly decrease as the pH is lowered (P < 0.05; non-paired Student t test), an observation that supports the formation of ternary complexes between CdL02 and HS (mechanism 1). We also checked the potential involvement of hydrophobic bonds (mechanism 2) by calculating the theoretical partitioning of the neutral CdL02 complexes between the aqueous phase and the dissolved organic carbon phase (DOC), using the empirical equation developed by Schwarzenbach et al.:[42] log Kom = 0.82 × log Dow + 0.14, where Kom = organic matter–water partition coefficient. The results of this calculation, taking into account the Dow values for the two neutral complexes, indicated that less than 0.3% of the CdL02 would associate with the DOC via hydrophobic interactions. Phinney and Bruland performed a similar calculation for the Cu(DDC)20 complex and reported comparable results.[43] We conclude that hydrophobic interactions are not the primary factor responsible for the association of CdL02 with the humic substances, but that they may nevertheless contribute to the stabilisation of the ternary Ln-Cd-HS complex.
|
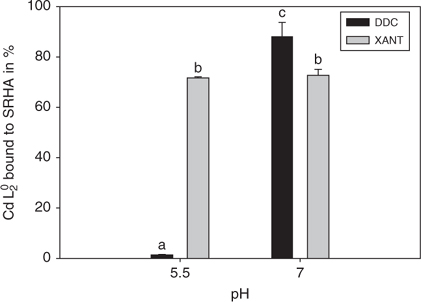
For the Cd-DDC-SRHA system, the changes in FI with pH agree with the results of the equilibrium dialysis experiments. In these latter experiments, 88 ± 6% of the Cd was present as a non-dialysable HS-CdLn complex at pH 7, compared with less than 2.0 ± 0.2% at pH 5.5 (Fig. 6). However, this parallel breaks down for the Cd-XANT-SRHA matrix: the FI decreases with pH, but the dialysis results indicate that Cd(XANT)02 associates in a similar manner with SRHA (~72%) at both pH values. It should be recognised that the two techniques (EEM and dialysis) probe the CdL02–HS interaction at different scales – dialysis experiments discriminate between dialysable and non-dialysable species whereas fluorescence shifts are interpreted as modifications of molecular conformations. Thus dialysis experiments are useful for quantifying the CdL02–HS association, whereas EEM is more suitable for investigating the nature of the interactions involved in this association.
Conclusion
In earlier work, it had been shown that the cadmium dithiocarbamate neutral complex (Cd(DDC)02) interacted with aquatic fulvic and humic acids. In the present study, we have confirmed this initial result and demonstrated that a similar interaction occurs with a second lipophilic complex, Cd(XANT)02. The nature of these interactions was probed with EEM fluorescence spectroscopy. By studying progressively more complete matrices (Cd-HS, L-HS, and finally Cd-L-HS), and by varying the pH (7.0 → 5.5), we demonstrated that the observed association between CdL02 and SRHA or SRFA likely involves the formation of ternary complexes, i.e. Ln-Cd-HS.[11] The slightly different patterns of association observed with the humic and fulvic acid fractions could be attributed to the differences in their carboxylic acid and phenolic contents, and their different pKa values, which influence the hydrophobicity of each fraction as well as their conformation as a function of pH. Based on the octanol–water partitioning constants of the two CdL02 complexes, hydrophobic bonds do not play a major role in stabilising the CdL02–HS association.
The present results are potentially important from an ecotoxicological perspective. Laboratory studies, carried out in the absence of natural organic matter, have consistently shown that neutral lipophilic metal complexes can cross biological membranes with ease, leading to enhanced metal uptake.[4,44] Turner and Williamson[45] extracted various river waters and treated sewage effluent with 1-octanol and detected measurable quantities of Cu, Pb and Zn in the octanol phase. They speculated that these presumably lipophilic forms might well be as important as the free metal ion activity in determining the bioavailability of the dissolved metals. However, the present study suggests that the lipophilic complexes present in natural waters will not be free, but will instead tend to bind to the ubiquitous fulvic and humic acids present in such systems. This binding would increase the effective size of the complexes and reduce their lipophilicity; both these effects will tend to render the Ln-M0-HS complexes less bioavailable.[10]
Acknowledgements
The present work was supported by grants from the Canadian Network of Toxicology Centres (Environment Canada) and from the Natural Sciences and Engineering Research Council of Canada (NSERC). Rob Cook (Louisiana State University) and Scott Smith (Wilfrid Laurier University) read draft versions of the manuscript and provided useful insights into the fluorescence behaviour of humic substances. The constructive comments from three anonymous referees are gratefully acknowledged. P. G. C. Campbell is supported by the Canada Research Chair Program.
[1]
S. Niyogi ,
C. M. Wood ,
Biotic ligand model, a flexible tool for developing site-specific water quality guidelines for metals.
Environ. Sci. Technol. 2004
, 38, 6177.
| Crossref | GoogleScholarGoogle Scholar | PubMed |

[2]
J. W. Gorsuch ,
C. R. Janssen ,
C. M. Lee ,
M. C. Reiley ,
Special issue: the biotic ligand model for metals – current research, future directions, regulatory implications.
Comp. Biochem. Physiol. 2002
, 133C, 1.
[3]
V. I. Slaveykova ,
K. J. Wilkinson ,
Predicting the bioavailability of metals and metal complexes: critical review of the biotic ligand model.
Environ. Chem. 2005
, 2, 9.
| Crossref | GoogleScholarGoogle Scholar |
[4]
J. T. Phinney ,
K. W. Bruland ,
Uptake of lipophilic organic Cu, Cd and Pb complexes in the coastal diatom, Thalassiosira weissflogii.
Environ. Sci. Technol. 1994
, 28, 1781.
| Crossref | GoogleScholarGoogle Scholar |
[5]
[6]
[7]
M. Haitzer ,
S. Höss ,
W. Traunspurger ,
C. Steinberg ,
Effects of dissolved organic matter (DOM) on the bioconcentration of organic chemicals in aquatic organisms – a review.
Chemosphere 1998
, 37, 1335.
| Crossref | GoogleScholarGoogle Scholar | PubMed |
[8]
P. G. C. Campbell ,
M. R. Twiss ,
K. J. Wilkinson ,
Accumulation of natural organic matter on the surfaces of living cells: implications for the interaction of toxic solutes with aquatic biota.
Can. J. Fish. Aquat. Sci. 1997
, 54, 2543.
| Crossref | GoogleScholarGoogle Scholar |
[9]
B. Vigneault ,
A. Percot ,
M. Lafleur ,
P. G. C. Campbell ,
Permeability changes in model and phytoplankton membranes in the presence of aquatic humic substances.
Environ. Sci. Technol. 2000
, 34, 3907.
| Crossref | GoogleScholarGoogle Scholar |
[10]
A. Boullemant ,
B. Vigneault ,
C. Fortin ,
P. G. C. Campbell ,
Uptake of neutral metal complexes by a green alga: influence of pH and humic substances.
Aust. J. Chem. 2004
, 57, 931.
| Crossref | GoogleScholarGoogle Scholar |
[11]
H. K. J. Powell ,
R. M. Town ,
Interaction of humic substances with hydrophobic metal complexes: a study by anodic stripping voltammetry and spectrophotometry.
Anal. Chim. Acta 1991
, 248, 95.
| Crossref | GoogleScholarGoogle Scholar |
[12]
R. R. Scharfe ,
V. S. Sastri ,
C. L. Chakrabarti ,
Stability of metal dithiocarbamate complexes.
Anal. Chem. 1973
, 45, 413.
| Crossref | GoogleScholarGoogle Scholar |
[13]
E. Bardez ,
I. Devol ,
B. Larrey ,
B. Valeur ,
Excited-state processes in 8-hydroxyquinoline: photoinduced tautomerization and solvation effects.
J. Phys. Chem. B 1997
, 101, 7786.
| Crossref | GoogleScholarGoogle Scholar |
[14]
H. M. V. M. Soares ,
P. C. F. L. Conde ,
A. A. N. Almeida ,
M. T. S. D. Vasconcelos ,
Evaluation of N-substituted aminosulfonic acid pH buffers with a morpholinic ring for cadmium and lead speciation studies by electroanalytical techniques.
Anal. Chim. Acta 1999
, 394, 325.
| Crossref | GoogleScholarGoogle Scholar |
[15]
H. M. V. M. Soares ,
P. C. F. L. Conde ,
Electrochemical investigations of the effect of N-substituted aminosulfonic acids with a piperazinic ring pH buffers on heavy metal processes which may have implications on speciation studies.
Anal. Chim. Acta 2000
, 421, 103.
| Crossref | GoogleScholarGoogle Scholar |
[16]
A. Finizio ,
M. Vighi ,
D. Sandroni ,
Determination of n-octanol/water partition coefficient (Kow) of pesticide. Critical review and comparison of methods.
Chemosphere 1997
, 34, 131.
| Crossref | GoogleScholarGoogle Scholar |
[17]
A. Paschke ,
P. L. Neitzel ,
W. Walther ,
G. Schüürmann ,
Octanol/water partition coefficient of selected herbicides: determination using shake-flask method and reverse-phase high-performance liquid chromatography.
J. Chem. Eng. Data 2004
, 49, 1639.
| Crossref | GoogleScholarGoogle Scholar |
[18]
C. A. Stedmon ,
S. Markager ,
R. Bro ,
Tracing dissolved organic matter in aquatic environments using a new approach to fluorescence spectroscopy.
Mar. Chem. 2003
, 82, 239.
| Crossref | GoogleScholarGoogle Scholar |
[19]
J. S. Tucker ,
V. L. Amszi ,
W. E. Acree ,
Primary and secondary inner filtering.
J. Chem. Educ. 1992
, 69, A8.
[20]
U. Zimmermann ,
T. Skrivanek ,
H.-G. Löhmannsröben ,
Fluorescence quenching of polycyclic aromatic compounds by humic substances. Part 1. Methodology for the determination of sorption coefficients.
J. Environ. Monit. 1999
, 1, 525.
| Crossref | GoogleScholarGoogle Scholar | PubMed |
[21]
D. M. McKnight ,
E. W. Boyer ,
P. K. Westerhoff ,
P. T. Doran ,
T. Kulbe ,
D. T. Andersen ,
Spectrofluorometric characterization of dissolved organic matter for indication of precursor organic material and aromaticity.
Limnol. Oceanogr. 2001
, 46, 38.
[22]
[23]
[24]
E. Tipping ,
Humic ion-binding model VI: an improved description of the interactions of protons and metal ions with humic substances.
Aquat. Geochem. 1998
, 4, 3.
| Crossref | GoogleScholarGoogle Scholar |
[25]
R. G. Zepp ,
W. M. Sheldon ,
M. A. Moran ,
Dissolved organic fluorophores in South-eastern US coastal waters: correction method for eliminating Rayleigh and Raman scattering peaks in excitation-emission matrices.
Mar. Chem. 2004
, 89, 15.
| Crossref | GoogleScholarGoogle Scholar |
[26]
J. J. Alberts ,
M. Takacs ,
Comparison of the natural fluorescence distribution among size fractions of terrestrial fulvic and humic acids and aquatic natural organic matter.
Org. Geochem. 2004
, 35, 1141.
| Crossref | GoogleScholarGoogle Scholar |
[27]
N. Patel-Sorrentino ,
S. Mounier ,
J. Y. Benaim ,
Excitation-emission fluorescence matrix to study pH influence on organic matter fluorescence in the Amazon Basin rivers.
Water Res. 2002
, 36, 2571.
| Crossref | GoogleScholarGoogle Scholar | PubMed |
[28]
M. J. Pullin ,
S. E. Cabaniss ,
Rank analysis of the pH-dependent synchronous fluorescence spectra of six standard humic substances.
Environ. Sci. Technol. 1995
, 29, 1460.
| Crossref | GoogleScholarGoogle Scholar |
[29]
M. M. Sierra ,
M. Giovanela ,
E. Parlanti ,
E. J. Soriano-Sierra ,
Fluorescence fingerprint of fulvic and humic acids from varied origins as viewed by single-scan and excitation/emission matrix techniques.
Chemosphere 2005
, 58, 715.
| Crossref | GoogleScholarGoogle Scholar | PubMed |
[30]
S. E. Cabaniss ,
Synchronous fluorescence spectra of metal–fulvic acid complexes.
Environ. Sci. Technol. 1992
, 26, 1133.
| Crossref | GoogleScholarGoogle Scholar |
[31]
R. M. Cory ,
D. M. McKnight ,
Fluorescence spectroscopy reveals ubiquitous presence of oxidized and reduced quinones in dissolved organic matter.
Environ. Sci. Technol. 2005
, 39, 8142.
| Crossref | GoogleScholarGoogle Scholar | PubMed |
[32]
K. M. Elkins ,
D. J. Nelson ,
Spectroscopic approaches to the study of the interaction of aluminum with humic substances.
Coord. Chem. Rev. 2002
, 228, 205.
| Crossref | GoogleScholarGoogle Scholar |
[33]
E. M. Larrivee ,
K. M. Elkins ,
S. E. Andrews ,
D. J. Nelson ,
Fluorescence characterization of the interaction of Al3+ and Pd2+ with Suwannee River Fulvic Acid in the absence and presence of the herbicide 2,4-dichlorophenoxyacetic acid.
J. Inorg. Biochem. 2003
, 97, 32.
| Crossref | GoogleScholarGoogle Scholar | PubMed |
[34]
[35]
M. Schilling ,
W. T. Cooper ,
Identification of copper binding sites in soil organic matter through chemical modifications and (CP)-C-13-MAS NMR Spectroscopy.
Environ. Sci. Technol. 2004
, 38, 5059.
| Crossref | GoogleScholarGoogle Scholar | PubMed |
[36]
C. Plaza ,
G. Brunetti ,
N. Senesi ,
A. Polo ,
Molecular and quantitative analysis of metal ion binding to humic acids from sewage sludge and sludge-amended soils by fluorescence spectroscopy.
Environ. Sci. Technol. 2006
, 40, 917.
| Crossref | GoogleScholarGoogle Scholar | PubMed |
[37]
M. Grassi ,
V. Daquino ,
Cd-113 NMR and fluorescence studies of multiple binding mechanisms of Cd(II) by the Suwannee River Fulvic Acid.
Ann. Chim. Rome 2005
, 95, 579.
| Crossref | GoogleScholarGoogle Scholar |
[38]
J. R. Lead ,
K. J. Wilkinson ,
E. Balnois ,
B. J. Cutak ,
C. K. Larive ,
S. Assemi ,
R. Beckett ,
Diffusion coefficients and polydispersities of the Suwannee River Fulvic Acid: comparison of fluorescence correlation spectroscopy, pulsed-field gradient nuclear magnetic resonance, and flow field-flow fractionation.
Environ. Sci. Technol. 2000
, 34, 3508.
| Crossref | GoogleScholarGoogle Scholar |
[39]
[40]
M. L. Pacheco ,
E. M. Peña-Méndez ,
J. Havel ,
Supramolecular interactions of humic acids with organic and inorganic xenobiotics studied by capillary electrophoresis.
Chemosphere 2003
, 51, 95.
| Crossref | GoogleScholarGoogle Scholar | PubMed |
[41]
E. M. Perdue ,
J. D. Ritchie ,
Dissolved organic matter in freshwaters.
Treatise on Geochemistry 2003
, 5, 273.
[42]
[43]
J. T. Phinney ,
K. W. Bruland ,
Effects of dithiocarbamate and 8-hydroxyquinoline additions on algal uptake of ambient copper and nickel in south San Francisco Bay water.
Estuaries 1997
, 20, 66.
| Crossref | GoogleScholarGoogle Scholar |
[44]
P. L. Croot ,
B. Karlson ,
J. T. Elteren ,
J. J. Kroon ,
Uptake of 64Cu–oxine by marine phytoplankton.
Environ. Sci. Technol. 1999
, 33, 3615.
| Crossref | GoogleScholarGoogle Scholar |
[45]
A. Turner ,
I. Williamson ,
Octanol–water partitioning of chemical constituents in river water and treated sewage effluent.
Water Res. 2005
, 39, 4325.
| Crossref | GoogleScholarGoogle Scholar | PubMed |
[46]
S. M. Macfie ,
Y. Tarmohamed ,
P. M. Welbourn ,
Effects of cadmium, cobalt, copper, and nickel on growth of the green alga Chlamydomonas reinhardtii: the influences of the cell wall and pH.
Arch. Environ. Contam. Toxicol. 1994
, 27, 454.
| Crossref | GoogleScholarGoogle Scholar |
[47]
J. Labuda ,
M. Skatulokova ,
M. Nmeth ,
S. Gergely ,
Formation and stability of diethyldithiocarbamate complexes.
Chem. Zvesti 1984
, 38, 597.
[48]
M. Block ,
Distribution of cadmium in an octanol–water system in the presence of xanthates and diethyldithiocarbamate.
Environ. Toxicol. Chem. 1991
, 10, 1267.
| Crossref | GoogleScholarGoogle Scholar |