

Air concentrations and particle–gas partitioning of polyfluoroalkyl compounds at a wastewater treatment plant
Lena Vierke A B , Lutz Ahrens A , Mahiba Shoeib A F , Eric J. Reiner C D , Rui Guo D C , Wolf-Ulrich Palm B , Ralf Ebinghaus E and Tom Harner AA Environment Canada, Science and Technology Branch, 4905 Dufferin Street, Toronto, ON, M3H 5T4, Canada.
B Leuphana University of Lüneburg, Institute for Environmental Chemistry, Scharnhorststrasse 1, D-21335 Lüneburg, Germany.
C Ontario Ministry of the Environment, 125 Resources Road, Toronto, ON, M9P 3V6, Canada.
D University of Toronto, Department of Chemistry, Toronto, ON, M5S 3H6, Canada.
E Helmholtz-Zentrum Geesthacht, Institute for Coastal Research, Max-Planck Strasse, 1, D-21502 Geesthacht, Germany.
F Corresponding author. Email: mahiba.shoeib@ec.gc.ca
Environmental Chemistry 8(4) 363-371 https://doi.org/10.1071/EN10133
Submitted: 6 December 2010 Accepted: 24 January 2011 Published: 19 August 2011
Journal Compilation © CSIRO Publishing 2011 Open Access CC BY-NC-ND
Environmental context. Polyfluoroalkyl compounds, widely used chemicals in consumer and industrial products, are global pollutants in the environment. Transport mechanisms and environmental pathways of these compounds, however, are not yet fully understood. We show that a wastewater treatment plant can be an important source for polyfluoroalkyl compounds to the atmosphere where they have the potential to be transported long distances.
Abstract. An air sampling campaign was conducted at a wastewater treatment plant (WWTP) to investigate air concentrations and particle–gas partitioning of polyfluoroalkyl compounds (PFCs). Samples were collected at an aeration tank and a secondary clarifier using both active high volume samplers and passive samplers comprising sorbent-impregnated polyurethane foam (SIP) disks. Water to air transport of PFCs was believed to be enhanced at the aeration tank owing to aerosol-mediated transport caused by surface turbulence induced by aeration. Mean air concentrations of target PFCs at the aeration tank were enriched relative to the secondary clarifier by factors of ~19, ~4 and ~3 for ∑fluorotelomer alcohols (FTOHs) (11 000 v. 590 pg m–3), ∑perfluorooctane sulfonamides & perfluorooctane sulfonamidoethanols (FOSAs & FOSEs) (120 v. 30 pg m–3) and ∑perfluoroalkyl carboxylates & perfluoroalkyl sulfonates (PFCAs & PFSAs) (4000 v. 1300 pg m–3) respectively. The particle associated fraction in the atmosphere increased with increasing chain length for PFCAs (from 60 to 100%) and PFSAs were predominantly bound to particles (~98%). Lower fractions on particles were found for FTOHs (~3%), FOSAs (~30%) and FOSEs (~40%). The comparison of the active and passive air sampling showed good agreement.
Additional keywords: atmosphere, passive air sampler, PFC, PFOA, PFOS, WWTP.
Introduction
Polyfluoroalkyl compounds (PFCs), such as perfluorooalkyl carboxylates (PFCAs) and perfluorooalkyl sulfonates (PFSAs), have been detected in a variety of environmental media and also in remote regions[1]; including rivers,[2] oceans,[3] the atmosphere,[4] wildlife,[1] and in humans.[5] PFCAs and PFSAs are persistent, bioaccumulative and toxic.[6–8] Fluorotelomer alcohols (FTOHs), perfluorooctane sulfonamides (FOSAs) and perfluorooctane sulfonamidoethanols (FOSEs) are precursors for PFCAs and PFSAs.[9–11] These precursors are volatile and can be transported in the atmosphere.[12–14]
There is still uncertainty about the origin of PFCs in the environment and the transport pathways of PFCAs and PFSAs are still under discussion. Wastewater treatment plants (WWTPs) are known to be point sources for PFCAs and PFSAs in rivers.[15,16] PFCs can be further transported via ocean currents to remote regions.[3] In terms of atmospheric pathways, the long-range transport of precursors can contribute to the occurrence of PFCs in remote regions.[17,18] However, the amounts from transport of PFCAs and PFSAs in ocean currents or from their precursor compounds in the atmosphere are not sufficient to fully explain the levels detected in remote regions.[13,17] Additionally, atmospheric PFCA and PFSA concentrations in urban areas cannot be explained by only considering the degradation of precursors.[19]
Recently, a laboratory experiment and a model have shown the transport of perfluorooctanoic acid (PFOA) in the gas-phase in its neutral form.[20,21] It was suggested that PFOA originated from aerosol-mediated transport from a water body into the atmosphere.[20] PFCAs and PFSAs have been detected in the particle-phase in the atmosphere; however, only a few studies have reported their presence in the gas-phase.[19,22]
The aim of this study was to generate more information on aerosol-mediated sources of PFCs by investigating the air concentrations and particle–gas partitioning of PFCs emitted at two locations in a WWTP – the aeration tank and the secondary clarifier. A secondary aim was to compare measurements conducted using the active high volume air sampler with time-integrated measurements using a sorbent-impregnated polyurethane foam (SIP) disk passive air sampler.
Experimental methods
Chemicals
The target analytes included 10 PFCAs (C4–C12, C14), 4 PFSAs (C4, C6, C8, C10), 3 FTOHs (6 : 2, 8 : 2, 10 : 2 FTOH), 3 FOSAs, 2 FOSEs, 1 PFOSEA and 19 mass-labelled internal standards (see Tables A1 and A2 in the Accessory publication, available at http://www.publish.csiro.au/?act=view_file&file_id=EN10133_AC.pdf).
Sampling
Sampling took place at a WWTP in Ontario, Canada, during spring 2010. At this sampling site two sampling locations were chosen: one at the aeration tank, where activated sludge is added to the wastewater to remove organic materials; and the other at the secondary clarifier, where the sludge is allowed to settle, to be separated from the water. The main difference between the two sampling sites is that air is blown into the wastewater at the aeration tank, to create an aerobic environment for the microbes. This generates a turbulent and bubbling surface at the aeration tank whereas the surface of the secondary clarifier is relatively calm.
High volume air samples (~140 m3 per sample) were collected for 24 h, twice per week over a period of 6 weeks at an aeration tank and a secondary clarifier at a WWTP. Glass fibre filters (GFFs) (Pall Corporation, Quebec, QC, Canada, Type A/E Glass 102-mm diameter baked at 250°C before sampling) were used to collect the particle-phase, whereas PUF/XAD/PUF cartridges (precleaned large PUF plug, Supelco, Oakville, ON, Canada, 7.6-cm length, 6-cm diameter, 15 g of XAD-2 (SupelcoTM-2), Supelco) were used for trapping gas-phase compounds. In addition, SIP disks were deployed in duplicate for 37 days during the same time period at both sampling sites to provide a time-integrated sample. To prepare SIP disks, precleaned PUF disks (diameter 14 cm, thickness 1.35 cm, surface area 365 cm2, mass 4.4 g, volume 207 cm3, density 0.0231 g cm–3, Tisch Environmental, Cleves, OH, USA) were coated by dipping in a hexane and ground Amberlite XAD-4 slurry (styrene-divenylbenzene, Supelco) and then drying, according to the method described in Shoeib et al.[23]
The effective air volume (Vair) for passive samples was calculated using[24]:
VSIP is the volume of the SIP disks (2.10 × 10⁻⁴ m3), d the deployment time (37 days), Dfilm the thickness of the SIP disks (5.67 × 10⁻³ m) and ka the air-side mass-transfer coefficient (108 m day–1) calculated as the ratio of the sampling rate and the area of the SIP disks (3.7 × 10⁻² m2). The sampling rate was determined during another study (r = 4 m3 day–1).[24] SIP–air partitioning coefficients (KSIP–air) and the slope of octanol–air partitioning coefficients (KOA) from the literature[23,25,26] were used for the determination of temperature dependent KSIP–air values (average temperature during sampling period 9°C). The sample volume for FTOHs, FOSAs and FOSEs ranged from 120 to 140 m3.
For PFCAs and PFSAs, an effective air volume of 150 m3 was calculated based on the duration of 37 days and a SIP disk sampling rate of 4 m3 day–1 according to Genualdi et al.[24]
Field blank samples for all sample media were collected by exposing them for 1 min at the sampling site and then treated them like real samples. Total suspended particles (TSPs) were determined gravimetrically by weighing the GFFs before and after sampling and dividing the mass by the air sample volumes. Furthermore air temperature was measured at the sampling sites.
Extraction and analysis
The extraction method and analysis was similar to methods used elsewhere.[23,24] All samples were spiked with mass-labelled internal standards before extraction. The PUF/XAD/PUF cartridges and the SIP-disks were extracted using Soxhlet apparatus with petroleum ether (6 h, 240 mL, ~20–40 cycles) for FTOHs, FOSAs and FOSEs and thereafter with methanol (10–14 h, 240 mL, ~50–70 cycles) for PFCAs and PFSAs. The GFFs were extracted by sonication using dichloromethane for FTOHs, FOSAs and FOSEs (three times using 12 mL for 20 min and then combining extracts) and methanol for PFCAs and PFSAs (five times using 12 mL for 20 min and then combining extracts). The two fractions for each sample media were treated separately. All fractions were concentrated by rotary evaporation (Büchi, Flawil, Switzerland) and nitrogen blow down. The methanol fractions were cleaned with EnviCarb.[27] The petroleum ether and dichloromethane fractions were applied to sodium sulfate columns for removing moisture. After clean up, 80% of the dichloromethane extract was combined with the corresponding methanol extract, because PFCAs and PFSAs were found to be partially extracted into dichloromethane. The methanol fractions were treated by adding 50% water and injections standards 13C8-PFOS and 13C8-PFOA, whereas Me2FOSA was added as the injection standard to the other fractions.
Gas chromatography mass spectrometry (GC-MS) in positive chemical ionisation mode (PCI) (Agilent Technologies, Mississauga, ON, Canada, 7890 A GC system) was used for analysis of FTOHs, FOSAs and FOSEs (except for PFOSA). The separation of target compounds was performed on a DB-WAX column (30 m, 0.25-mm inner diameter, 0.25-µm film, J&W Scientific, Folsom, CA, USA). The injection volume was 2 µL and using splitless injection (200°C). The oven temperature program is given in the Accessory publication (Table A3). Helium was used as carrier gas at a flow rate of 1.3 mL min–1. Methane was used as the reaction gas.
Instrumental analysis of PFCAs and PFSAs (including PFOSA) was performed using high pressure liquid chromatography (Agilent 1100 Series) tandem mass spectrometry (HPLC-MS/MS) (Applied Biosystems, Toronto, ON, Canada, 4000 QTRAP) in the electrospray negative ionisation mode at atmospheric pressure. For separation, a pre-column (C8, 4-mm length, 2-mm diameter, Phenomenex, Torrance, CA, USA) and a Luna column (C8 (2), 50-mm length, 2-mm diameter, 3-μm particle size, Phenomenex) was used. Methanol and water, each with 10-mM ammonium acetate, were used as the mobile phase. The flow was set to 0.25 µL min–1 and the gradient is given in the Accessory publication (Table A4). The injection volume was 25 µL.
Quantification was performed based on response factors of the target compounds and their corresponding internal standards. The ratio of both response factors was used for recovery correction. The calibration curves included eleven points for FTOHs (0.3–3800 ng mL–1), seven points for FOSAs and FOSEs (0.12–115 ng mL–1) and eight points for PFCAs and PFSAs (0.005–5.0 ng mL–1). Instrument detection limits (IDLs) were calculated by extrapolating instrument response in blank samples to a concentration that would give a S/N value of three. A further limit of detection (LOD) calculated as three times the standard deviation (s.d.) of the blanks was used. Concentrations below the blank levels and below the IDL were set to half of the LOD for statistical analysis. In cases where the substitution for a particular chemical was required for more than 25% of the data set, only the mean value was presented in Figs 1 and 2 as the other statistical parameters are subject to bias by substituting a constant value.[28] Compounds not detected above the IDL in any of the samples were excluded from further investigations.

|

|
Prior to extraction, small punches (0.7 cm2) of seven GFFs from each sampling site were analysed for organic carbon using a Thermal Optical Transmission box (Sunset Laboratory, Tigard, OR, USA). PFC concentrations for the relevant GFFs were corrected based on the punched area.
Results and discussion
Quality control
Concentrations in blank samples ranged from <IDL to 7 pg m–3 in PUF/XAD/PUF cartridges and GFFs and from <IDL to 10 pg m–3 in SIP disks. All results were corrected for blanks. Details of IDLs and the blank levels for individual compounds are given in Tables A5 and A6 in the Accessory publication.
LODs ranged from 0.4 to 13 pg m–3 for FTOHs, FOSAs and FOSEs and from 0.01 to 39 pg m–3 for PFCAs and PFSAs (see Table A6 in the Accessory publication).
Recoveries for internal standards of target PFCs in PUF/XAD/PUF cartridges ranged from 5.9 ± 1.8% for 13C-6 : 2 FTOH to 100 ± 18% for 13C-10 : 2 FTOH; from 72 ± 13% for d3-MeFOSA to 230 ± 37% for d9-EtFOSE and from 21 ±11% for 13C2-PFDoDA to 180 ± 96% for 13C2-PFBA. The low recoveries for 13C-6 : 2 FTOH are associated with the high volatility of this compound and the resulting evaporative losses during Soxhlet extraction and concentration. Signal enhancement caused by solvent or interfering compounds might be responsible for high recoveries, i.e. for d9-EtFOSE. For GFFs, the recoveries ranged from 9.4 ± 2.8% for 13C-6 : 2 FTOH to 150 ± 25% for d9-EtFOSE and from 36 ± 8.5% for 13C2-PFBA to 67 ± 16% for 13C2-PFHxA. For the SIP disks recoveries ranged from 6.4 ± 1.0% for 13C-6 : 2 FTOH to 310 ± 40% for 18O2-PFHxS. All samples (including blanks) were recovery corrected using appropriate factors based on recoveries presented above and summarised in Table A7. The poor recoveries for 6 : 2 FTOH cause greater uncertainty in the derived air concentration for this compound.
FTOH, FOSA and FOSE air concentrations
Gas- and particle-phase air concentrations for FTOH, FOSA and FOSE are shown in Fig. 1 and are summarised with results from passive samples in Table 1. Detailed results are in Tables A8–A11 in the Accessory publication. PFOSEA was not detected above the IDL in any sample and was therefore excluded from further investigations.

|
Gas-phase samples were dominated by FTOHs with a mean concentration of 11 000 pg m–3 at the aeration tank and 590 pg m–3 at the secondary clarifier. Mean ∑FOSA & FOSE concentrations were 43 pg m–3 at the aeration tank and 16 pg m–3 at the secondary clarifier. Conversely, ∑FTOH exhibited the lowest particle-phase concentrations (25 pg m–3 at the aeration tank and 1.9 pg m–3 at the secondary clarifier), whereas for ∑FOSA & FOSE particle-phase concentrations were higher at 69 and 11 pg m–3 respectively. The mean ∑FTOH concentrations at the aeration tank were 18 times higher for the gas-phase and 13 times higher for the particle-phase compared with the secondary clarifier (t-test, P < 0.001 and P < 0.005 respectively). Mean ∑FOSA & FOSE concentrations were approximately a factor of three to six higher at the aeration tank compared with the secondary clarifier (t-test, P < 0.001 for gas- and particle-phase respectively). These results point to the important role of the aeration process in emitting high concentrations of PFCs to the atmosphere.
Composition
The composition of FTOHs, FOSAs and FOSEs in each sample is shown in Figs A1 and A2 in the Accessory publication. The profile of FTOHs in the gas-phase was dominated by 6 : 2 FTOH (54%) > 8 : 2 FTOH (38%) > 10 : 2 FTOH (8%) and was similar at both sampling sites. In the particle-phase at the aeration tank, all of the FTOHs were detected (8 : 2 FTOH (47%) > 10 : 2 FTOH (35%) > 6 : 2 FTOH (18%)) whereas at the secondary clarifier only 10 : 2 FTOH was detected above the IDL. For FOSAs and FOSEs the gas-phase profile was different at the two sites. The aeration tank samples were dominated by MeFOSE (47%) and MeFOSA (27%), whereas the secondary clarifier samples were dominated by PFOSA (39%) and MeFOSA (24%). FOSAs and FOSEs in the particle-phase showed a similar pattern at the aeration tank and the secondary clarifier with dominant compounds being PFOSA (53 and 40% respectively), MeFOSE (27 and 38% respectively) and EtFOSE (~17% at both sites).
Comparisons with other measurements
It is interesting to compare the magnitude of air concentrations for the various PFCs measured at the WWTP to other studies. This comparison will give some sense of the importance of the WWTP as a point source to air. Air concentrations of FTOH in the urban area of Toronto (∑FTOH = 81 pg m–3 sum of particle and gas-phase[29]) were two orders of magnitude lower than at the aeration tank and one order of magnitude lower than at the secondary clarifier. Thus WWTPs seem to be an important point source for FTOHs. Differences were less drastic for other PFCs. For instance, FOSA and FOSE concentrations were approximately six times higher at the aeration tank compared with urban areas (∑FOSA & FOSE = 19 pg m–3 sum of particle and gas-phase[19,29]) and the FOSA & FOSE concentrations at the secondary clarifier were generally in the same range as in urban areas.[19,29] Ongoing studies at this WWTP are attempting to quantify the emission fluxes to air so that WWTPs as a whole can be assessed in terms of their contribution to the atmospheric burdens of PFCs.
PFCA and PFSA air concentrations
Gas- and particle-phase results for PFCA and PFSA in air are shown in Fig. 2 and further summarised in Table 1 and in Tables A8–A11 in the Accessory publication.
Gas-phase concentrations of PFCAs and PFSAs (∑PFCA & PFSA 70 pg m–3 at the aeration tank and 34 pg m–3 at the secondary clarifier) were one to three orders of magnitude lower compared with FTOHs; however, they were two times higher than FOSAs and FOSEs. In contrast, ∑PFCA & PFSA concentrations in the particle-phase were 500 and 100 times higher than the ∑FTOH and ∑FOSA & FOSE concentrations respectively. PFOS was the dominant compound in the particle-phase. PFOS concentrations (average 3600 pg m–3 at the aeration tank and 1000 pg m–3 at the secondary clarifier) were one to three orders of magnitude higher than concentrations of the other PFCs. It is interesting to note that mean ∑PFCA & PFSA concentrations were significantly higher at the aeration tank compared with the secondary clarifier (factor of 1–4, t-test P < 0.012 for the gas-phase, P < 0.003 for the particle-phase). In former studies investigating other WWTPs, higher PFC concentrations were reported in treated effluent in comparison to influent wastewater, though mass flow charts from Schultz et al. indicate similar concentrations in the aeration tank and secondary clarifier.[15,30] This indicates that the observed differences in air concentrations are most likely associated with enhanced mass transfer (water to air transfer) of PFCAs and PFSAs owing to the aeration process rather than to differences in wastewater concentrations of PFCAs and PFSAs between the aeration tank and secondary clarifier.
Composition
The composition of PFCAs and PFSAs in each sample is shown in Fig. A3 in the Accessory publication. The profile of PFCAs and PFSAs in the gas-phase was different at the two sampling sites. At the aeration tank, PFHxA was dominant (29%), followed by PFOA and PFBA (both ~19%). The contributions of the remaining compounds were 10% (PFPA) and lower. Samples from the secondary clarifier were dominated by PFBA (48%), followed by PFPA (15%) and PFOS (11%). The contributions of the remaining compounds were below 9%. These results indicate that the different treatment processes of the wastewater at the WWTP caused different air emission signatures for the PFCAs and PFSAs. However, in general, PFOS and the short chain PFCAs (C4–C8) were the dominant compounds in the gas-phase at both the aeration tank and the secondary clarifier, whereas the contribution of the longer chain PFCAs (C9–C14) was very low (<3%). PFOS was also dominant among the PFCAs and PFSAs in the particle-phase (~91% of ∑PFCA & PFSA) at both sites. The next dominant PFCA and PFSA after PFOS was PFOA (3% at the aeration tank and 5% at the secondary clarifier), followed by PFHxS, PFHxA and PFDA (each >0.5%). The dominance of PFOS and PFOA on atmospheric particles has been reported in the literature[19]; however, the dominance of PFOS as observed in this study was not previously observed or reported. The dominance of PFOS (and PFOA) in particles might reflect the pattern of PFCs used in industrial and consumer products.[31,32]
Comparisons with other measurements
Chemical ratios are sometimes used to compare or differentiate sources. In the current study the ratio of PFOS and PFOA, i.e. PFOS/PFOA, observed at the WWTP could be compared with other locations to gain some sense of whether the WWTP as a point source could be contributing substantially to the broader contamination of the atmosphere. The ratio PFOS/PFOA in the gas-phase from the WWTP (0.4–2.1) was in the same range as the ratio from an urban area (0.5),[19] which suggests a possible contribution of the WWTP to urban air or at least that the source for urban air is similar. However, for the particle-phase, PFOS/PFOA was more than 100 times higher at the WWTP (42–50) compared with an urban area (0.3).[19] This may indicate that the particle-phase signature at the WWTP is a localised or short-lived source.
Most literature reports of PFCAs and PFSAs focus on the particle-phase exclusively. For instance, Dreyer et al. reported ∑PFCA and ∑PFSA concentrations in the particle-phase in Germany of 1.0 and 1.3 pg m–3 respectively.[4,33] These concentrations are one to three orders of magnitude lower compared with concentrations at the WWTP in this study. In a study from New York State, PFCAs and PFSAs were measured in the gas and particle-phase.[19] These concentrations (i.e. ∑C6,C10 PFSA & C7–12 PFCA 8.0 and PFOS 2.3 pg m–3)[19] were also one to three orders of magnitude lower compared with the present study (210 and 3600 pg m–3 at the aeration tank and 110 and 1000 pg m–3 at the secondary clarifier).
In summary, the measured concentrations of PFSAs and PFCAs at the WWTP were greatly elevated compared with other studies, even for urban areas. This highlights the importance of WWTPs as point-source emitters of these compounds to the atmosphere.
Correlations of atmospheric concentrations with sampling parameters
The influence of various meteorological and particle parameters (e.g. ambient air temperature, TSP and particle OC content) on PFC air concentrations were investigated.
Air temperature, which ranged from –0.2 to 12.5°C during high volume sampling, showed a positive correlation for FOSEs and FOSAs in the gas phase, i.e. MeFOSA and MeFOSE (P < 0.05). This is likely owing to greater evaporation of these compounds at higher temperatures. However, other PFCs did not exhibit this correlation. It is likely that evaporation from wastewater is governed more by the temperature of the wastewater (versus the air temperature) which is much less subject to variability. A positive correlation of the PFC concentration with the air temperature was found previously[34]; however, owing to a weak correlation, it was assumed that other factors may have also had an influence.[33]
The OC contents of the particles from the two sites were not significantly different (4.0 ± 1.1% OC at the aeration tank, n = 7, and 3.3 ± 0.9% OC at the secondary clarifier, n = 7; t-test P = 0.2) and no correlation with atmospheric PFC concentrations were found. The TSP concentration was significantly higher at the aeration tank (120 ± 29 µg m–3, n = 12) in comparison to the secondary clarifier (75 ± 20 µg m–3, n = 12, t-test P < 0.001) but again no correlation with atmospheric PFC concentrations were found. The higher TSP concentration above the aeration tank is likely the result of aerosol generation and the release of wastewater particulates to air.
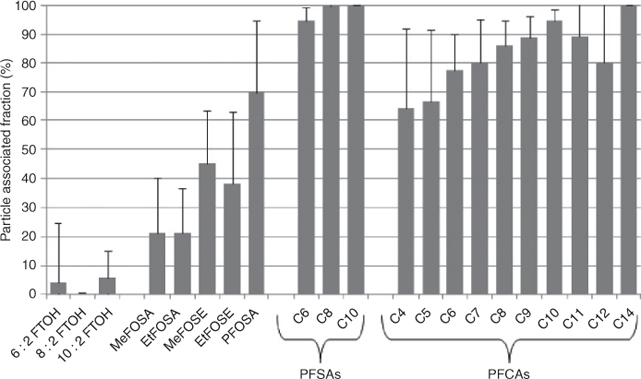
Particle–gas partitioning
The percent on particles for the various target PFCs is summarised in Fig. 3. This was calculated as the concentrations in the particle-phase (in picograms per cubic metre) divided by the sum of concentrations in the gas and particle-phase (in picograms per cubic metre) and multiplied by 100. There was no substantial difference in particle–gas partitioning of target compounds collected at the aeration tank versus the secondary clarifier and so average values are represented in Fig. 3.
|
Of the target PFCs, the FTOHs showed the smallest particle-phase percentages that were typically less than 10%. Particle bound fractions for FTOHs found during ship-based measurements for 8 : 2 FTOH and 10 : 2 FTOH were higher compared with results from the present study (up to 23%,[29] 26% for 8 : 2 FTOH and 15% for 10 : 2 FTOH[35]).
Particle-phase percentages increased for MeFOSA and EtFOSA (~19 and ~15% respectively) and were even higher for MeFOSE, EtFOSE and PFOSA (38–70%). Other studies showed lower particle-phase percentages from land-based measurements (i.e. MeFOSA & EtFOSA <10%, EtFOSE 14%[4]), whereas ship-based measurements were similar to the results for the WWTP (i.e. MeFOSA & EtFOSA ~15%,[4] MeFOSE 30%,[29] EtFOSE 57%[4]).
The PFSAs had the highest particle associated fractions with almost 100% bound on particles. PFCAs were also mainly particle-associated and this increased generally according to chain length as: PFBA (~64%) ≈ PFPA (~68%) < PFHxA (~78%) < PFHpA (~80%) < PFOA (~86%) ≈ PFNA (~88%) < PFDA (~95%) > PFUnDA (~89%) > PFDoDA (~80%) < PFTDA (~100%). This pattern is likely owing to the decrease in vapour pressure (which favours the condensed state) with increasing chain length for the neutral forms of PFCAs.[36,37] Only one study is available for comparison with these results.[19] Particle-phase percentages reported for New York State were 60% for PFHpA, 40% for PFOA and PFNA and 30% for PFDA, PFDoDA and PFOS.[19] Moreover, the shorter chain PFCA, PFHpA, had the highest particle-bound fractions and the longest chain PFCA, PFDA, had the lowest particle-phase fractions.[19] At this time, we have no explanation for these contradictory results.
Comparison of active v. passive sampling techniques
It is interesting to compare the gas-phase air concentrations from the intermittent high volume samples against the time-integrated concentrations derived using the passive samples. Differences can be expected for several reasons: (i) differences in the sampling time, i.e. the high volume samples were collected on two consecutive days each week and represented ~29% of the time that was sampled by the continuous and time-integrating passive samplers. Thus, high and low air concentration episodes that could offset the true time-integrated air concentrations might not have been captured by this 29% of the time window; (ii) although passive samplers better cover the entire duration of the study, there is greater uncertainty with these derived concentrations owing to uncertainties in the sampling rates; (iii) collection of particles on the SIP disks is known to occur[38] and this may result in an overestimate of the gas-phase concentration for compounds that are particle-associated (this issue is discussed further, below); and (iv) general analytical errors that contribute to uncertainties.
Despite these potential uncertainties and confounding factors, the agreement between gas-phase concentrations derived from high volume samples v. SIP disk passive air samples was fairly good as shown in Fig. 4 with detailed results presented in Table 1. The concentrations differed by a mean factor of 1.5 for FTOHs, 0.96 for FOSAs, 0.85 for FOSEs, 1.1 for PFHxS, 24 for PFOS and 0.8 for PFCAs.
|
Sampling artefacts
Previous laboratory investigations have shown that PFCAs may adsorb to filters (GFFs and quartz fibre filters (QFFs)) and therefore particle-phase concentrations derived from sampling techniques using GFFs and QFFs could be overestimated.[39] The results of the present study and the comparison of active versus passive samples provides some insight into this issue. PFCAs and PFSAs were found predominantly in the particle-phase. However, the presence of PFCAs in the gas-phase and the good agreement between gas-phase concentrations using high volume sampler and passive air sampler concentrations indicate that this sampling artefact has a relatively minor influence on the gas-phase concentrations. However, we acknowledge that the high concentrations of target compounds at the WWTP may not provide the best conditions for detecting this artefact. It may be more important at lower air concentrations.
Particle-phase sampling by the SIP disks is another ‘artefact’ that complicates the comparison of results from high volume samples and from SIP disks. It has been shown that the SIP disk sampling chamber allows ~10% of the ambient particles to be sampled and so the SIP disk is not just a gas-phase passive sampler.[38] The net effect is demonstrated well by the results for PFOS (see Fig. 4). In the high volume samples, the PFOS particle-phase air concentrations are more than two orders of magnitude larger than the gas-phase concentration. The air concentration derived from the SIP disk passive air samples, which represents mainly the gas-phase and ~10% of the particle-phase,[38] fall somewhere in between. In this case the 10% of ambient particles that are sampled by the SIP disk outweigh the gas-phase contribution. More studies are required to further elaborate and quantify particle-phase sampling by passive samplers and sorption artefact for filters.
Conclusion
This study demonstrates the importance of WWTPs as point sources of PFCs to the atmosphere. The aeration process in particular is shown to be a key emission process for both gas-phase and particle-associated PFCs. Aerosol-mediated transport is believed to account for the higher amounts of particle-associated PFCs in air near the aeration tank. This pathway is likely also to be important in open water bodies as aerosols are generated and released to air via sea spray and wave action. Passive and active samplers are shown to be complementary and comparable air sampling approaches for PFCs.
Acknowledgements
We thank the German Academic Exchange Service and the Chemicals Management Plan (Government of Canada) for partial funding. We greatly acknowledge Cathy Cheng for valuable help during sampling.
References
[1] C. M. Butt, U. Berger, R. Bossi, G. T. Tomy, Levels and trends of poly- and perfluorinated compounds in the arctic environment. Sci. Total Environ. 2010, 408, 2936.| Levels and trends of poly- and perfluorinated compounds in the arctic environment.Crossref | GoogleScholarGoogle Scholar | 1:CAS:528:DC%2BC3cXntV2isL0%3D&md5=fe6f4d4d1e1bcba7eb0d8a1736bf7e35CAS |
[2] M. S. McLachlan, K. E. Holmstrom, M. Reth, U. Berger, Riverine discharge of perfluorinated carboxylates from the European continent. Environ. Sci. Technol. 2007, 41, 7260.
| Riverine discharge of perfluorinated carboxylates from the European continent.Crossref | GoogleScholarGoogle Scholar | 1:CAS:528:DC%2BD2sXhtVyrurnL&md5=1c988260b1488900629a3c22a046a3ffCAS |
[3] L. Ahrens, J. L. Barber, Z. Xie, R. Ebinghaus, Longitudinal and latitudinal distribution of perfluoroalkyl compounds in the surface water of the Atlantic Ocean. Environ. Sci. Technol. 2009, 43, 3122.
| Longitudinal and latitudinal distribution of perfluoroalkyl compounds in the surface water of the Atlantic Ocean.Crossref | GoogleScholarGoogle Scholar | 1:CAS:528:DC%2BD1MXjvFalsb0%3D&md5=0577ff8869ac9a9ff85c8a3b5d2cc878CAS |
[4] A. Dreyer, I. Weinberg, C. Temme, R. Ebinghaus, Polyfluorinated compounds in the atmosphere of the Atlantic and Southern Oceans: evidence for a global distribution. Environ. Sci. Technol. 2009, 43, 6507.
| Polyfluorinated compounds in the atmosphere of the Atlantic and Southern Oceans: evidence for a global distribution.Crossref | GoogleScholarGoogle Scholar | 1:CAS:528:DC%2BD1MXptlSmsLc%3D&md5=46de05fe93f6d53b1f1f97732b79ecceCAS |
[5] M. Houde, J. W. Martin, R. J. Letcher, K. R. Solomon, D. C. G. Muir, Biological monitoring of polyfluoroalkyl substances: a review. Environ. Sci. Technol. 2006, 40, 3463.
| Biological monitoring of polyfluoroalkyl substances: a review.Crossref | GoogleScholarGoogle Scholar | 1:CAS:528:DC%2BD28XktVers7w%3D&md5=f4882d1064a287c19c118a9ecfaadc61CAS |
[6] J. M. Conder, R. A. W. W. de Hoke, M. H. Russell, R. C. Buck, Are PFCAs bioaccumulative? A critical review and comparison with regulatory criteria and persistent lipophilic compounds. Environ. Sci. Technol. 2008, 42, 995.
| Are PFCAs bioaccumulative? A critical review and comparison with regulatory criteria and persistent lipophilic compounds.Crossref | GoogleScholarGoogle Scholar | 1:CAS:528:DC%2BD1cXltFWmsw%3D%3D&md5=a5859b58e71eafefd64bade38f26a3c1CAS |
[7] C. Lau, K. Anitole, C. Hodes, D. P.-H. A. Lai, J. See, Perfluoroalkyl acids: a review of monitoring and toxicological findings. Toxicol. Sci. 2007, 99, 366.
| Perfluoroalkyl acids: a review of monitoring and toxicological findings.Crossref | GoogleScholarGoogle Scholar | 1:CAS:528:DC%2BD2sXhtFKru7%2FI&md5=688334776fe3d8be0b25ee6dc3769693CAS |
[8] D. Herzke, M. Schlabach, E. Mariussen, H. Uggerud, E. Heimstad, A literature survey on selected chemical compounds: literature survey of polyfluorinated organic compounds, phosphor containing flame retardants, 3-nitrobenzanthrone, organic tin compounds, platinum and silver 2007. Available at http://www.klif.no/publikasjoner/2238/ta2238.pdf [Verified 21 March 2011].
[9] D. A. Ellis, J. W. Martin, A. O. De Silva, S. A. Mabury, M. D. Hurley, M. P. S. Andersen, T. J. Wallington, Degradation of fluorotelomer alcohols: a likely atmospheric source of perfluorinated carboxylic acids. Environ. Sci. Technol. 2004, 38, 3316.
| Degradation of fluorotelomer alcohols: a likely atmospheric source of perfluorinated carboxylic acids.Crossref | GoogleScholarGoogle Scholar | 1:CAS:528:DC%2BD2cXjvVShsb0%3D&md5=1a2a8158f069618f177c7efa759abbccCAS |
[10] J. W. Martin, D. A. Ellis, S. A. Mabury, Atmospheric chemistry of perfluoroalkanesulfonamides: kinetic and product studies of the OH radical and Cl atom initiated oxidation of N-ethyl perfluorobutanesulfonamide. Environ. Sci. Technol. 2006, 40, 864.
| Atmospheric chemistry of perfluoroalkanesulfonamides: kinetic and product studies of the OH radical and Cl atom initiated oxidation of N-ethyl perfluorobutanesulfonamide.Crossref | GoogleScholarGoogle Scholar | 1:CAS:528:DC%2BD2MXhtlekurbM&md5=af7be02670c9dd4f3b823cf408ef1fb9CAS |
[11] J. D’eon, M. D. Hurley, T. J. Wallington, S. A. Mabury, Atmospheric chemistry of N-methyl perfluorobutane sulfonamidoethanol, C4F9SO2N(CH3)CH2CH2OH: kinetics and mechanism of reaction with OH. Environ. Sci. Technol. 2006, 40, 1862.
| Atmospheric chemistry of N-methyl perfluorobutane sulfonamidoethanol, C4F9SO2N(CH3)CH2CH2OH: kinetics and mechanism of reaction with OH.Crossref | GoogleScholarGoogle Scholar | 1:CAS:528:DC%2BD28XhtFKgtrs%3D&md5=690866f1e0eaf3e989e5799820c7fbafCAS |
[12] Y. D. Lei, F. Wania, D. Mathers, S. A. Mabury, Determination of vapor pressure, octanol–air, and water–air partition coefficients for polyfluorinated sulfonamide, sulfonamidoethanols, and telomer alcohols. J. Chem. Eng. Data 2004, 49, 1013.
| Determination of vapor pressure, octanol–air, and water–air partition coefficients for polyfluorinated sulfonamide, sulfonamidoethanols, and telomer alcohols.Crossref | GoogleScholarGoogle Scholar | 1:CAS:528:DC%2BD2cXktFCqtb0%3D&md5=435ed721ff2de59f55740150e6c9a6e5CAS |
[13] C. J. Young, V. I. Furdui, J. Franklin, R. M. Koerner, D. C. G. Muir, S. A. Mabury, Perfluorinated acids in Arctic snow: new evidence for atmospheric formation. Environ. Sci. Technol. 2007, 41, 3455.
| Perfluorinated acids in Arctic snow: new evidence for atmospheric formation.Crossref | GoogleScholarGoogle Scholar | 1:CAS:528:DC%2BD2sXjsVGrsLs%3D&md5=d5bc2c7b7722ba6f1a9e5c0664e43482CAS |
[14] A. Jahnke, U. Berger, R. Ebinghaus, C. Temme, Latitudinal gradient of airborne polyfluorinated alkyl substances in the marine atmosphere between Germany and South Africa (53°N–33°S). Environ. Sci. Technol. 2007, 41, 3055.
| Latitudinal gradient of airborne polyfluorinated alkyl substances in the marine atmosphere between Germany and South Africa (53°N–33°S).Crossref | GoogleScholarGoogle Scholar | 1:CAS:528:DC%2BD2sXjslWgsb0%3D&md5=dd81d1257116b93697e928261b85484cCAS |
[15] B. G. Loganathan, K. S. Sajwan, E. Sinclari, K. S. Kumar, K. Kannan, Perfluoroalkyl sulfonates and perfluorocarboxylates in two wastewater treatment facilities in Kentucky and Georgia. Water Res. 2007, 41, 4611.
| Perfluoroalkyl sulfonates and perfluorocarboxylates in two wastewater treatment facilities in Kentucky and Georgia.Crossref | GoogleScholarGoogle Scholar | 1:CAS:528:DC%2BD2sXhtlWnsLbK&md5=f04f8642b19f47261911aa7d7f22e8f5CAS |
[16] L. Ahrens, S. Felizeter, Z. Xie, R. Sturm, R. Ebinghaus, Polyfluorinated compounds in wastewater treatment plant effluents and surface waters along the River Elbe, Germany. Mar. Pollut. Bull. 2009, 58, 1326.
| Polyfluorinated compounds in wastewater treatment plant effluents and surface waters along the River Elbe, Germany.Crossref | GoogleScholarGoogle Scholar | 1:CAS:528:DC%2BD1MXhtVehtLrL&md5=774b545b772b5238cf6d37d97978ff31CAS |
[17] U. Schenker, M. Scheringer, M. Macleod, J. W. Martin, I. T. Cousins, K. Hungerbühler, Contribution of volatile precursor substances to the flux of perfluorooctanoate to the Arctic. Environ. Sci. Technol. 2008, 42, 3710.
| Contribution of volatile precursor substances to the flux of perfluorooctanoate to the Arctic.Crossref | GoogleScholarGoogle Scholar | 1:CAS:528:DC%2BD1cXks1Ont7k%3D&md5=0c810537d37242152a99af267ee97c07CAS |
[18] N. L. Stock, V. I. Furdui, D. C. G. Muir, S. A. Mabury, Perfluoroalkyl contaminants in the Canadian Arctic: evidence of atmospheric transport and local contamination. Environ. Sci. Technol. 2007, 41, 3529.
| Perfluoroalkyl contaminants in the Canadian Arctic: evidence of atmospheric transport and local contamination.Crossref | GoogleScholarGoogle Scholar | 1:CAS:528:DC%2BD2sXkt1OrsLY%3D&md5=47f6ada56c14e618484ff3141d8aa527CAS |
[19] S. K. Kim, K. Kannan, Perfluorinated acids in air, rain, snow, surface runoff, and lakes: relative importance of pathways to contamination of urban lakes. Environ. Sci. Technol. 2007, 41, 8328.
| Perfluorinated acids in air, rain, snow, surface runoff, and lakes: relative importance of pathways to contamination of urban lakes.Crossref | GoogleScholarGoogle Scholar | 1:CAS:528:DC%2BD2sXht12gsrbL&md5=731c781add6621ccc7b9d72f4f8c4a32CAS |
[20] C. J. McMurdo, D. A. Ellis, E. Webster, J. Butler, R. Christensen, L. K. Reid, Aerosol enrichment of the surfactant PFO and mediation of the water–air transport of gaseous PFOA. Environ. Sci. Technol. 2008, 42, 3969.
| Aerosol enrichment of the surfactant PFO and mediation of the water–air transport of gaseous PFOA.Crossref | GoogleScholarGoogle Scholar | 1:CAS:528:DC%2BD1cXkvFKhsrg%3D&md5=5662bb6cfadb5d342ee5401a03e8351dCAS |
[21] E. Webster, D. A. Ellis, L. K. Reid, Modeling the environmental fate of perfluorooctanoic acids and perfluorooctanoate: an investigation of the role of individual species partitioning. Environ. Chem. 2010, 29, 1466.
| Modeling the environmental fate of perfluorooctanoic acids and perfluorooctanoate: an investigation of the role of individual species partitioning.Crossref | GoogleScholarGoogle Scholar | 1:CAS:528:DC%2BC3cXpsFGjs7c%3D&md5=66ac16b8ee223905a4e4d7a4153ef9daCAS |
[22] C. A. Barton, M. A. Kaiser, M. H. Russell, Partitioning and removal of perfluorooctanoate during rain events: the importance of physical-chemical properties. J. Environ. Monit. 2007, 9, 839.
| Partitioning and removal of perfluorooctanoate during rain events: the importance of physical-chemical properties.Crossref | GoogleScholarGoogle Scholar | 1:CAS:528:DC%2BD2sXosVentb0%3D&md5=ead5d67ce82c81f11d0b495fe21b22f9CAS |
[23] M. Shoeib, T. Harner, S. C. Lee, D. Z. J. Lane, Sorbent-impregnated polyurethane foam disk for passive air sampling of volatile fluorinated chemicals. Anal. Chem. 2008, 80, 675.
| Sorbent-impregnated polyurethane foam disk for passive air sampling of volatile fluorinated chemicals.Crossref | GoogleScholarGoogle Scholar | 1:CAS:528:DC%2BD1cXisFShsg%3D%3D&md5=1379a0661d06d05160b91e4ff5dad9beCAS |
[24] S. Genualdi, S. C. Lee, M. Shoeib, A. Gawor, L. Ahrens, T. Harner, Global pilot study of legacy and emerging persistent organic pollutants using sorbent-impregnated polyurethane foam disk passive air samplers. Environ. Sci. Technol. 2010, 44, 5534.
| Global pilot study of legacy and emerging persistent organic pollutants using sorbent-impregnated polyurethane foam disk passive air samplers.Crossref | GoogleScholarGoogle Scholar | 1:CAS:528:DC%2BC3cXnvFGnt74%3D&md5=e747d1c98bf416ec631c2de38ad74553CAS |
[25] S. Thuens, A. Dreyer, R. Sturm, C. Temme, R. Ebinghaus, Determination of the octanol–air partition coefficients (KOA) of fluorotelomer alcohols. J. Chem. Eng. Data 2008, 53, 223.
| Determination of the octanol–air partition coefficients (KOA) of fluorotelomer alcohols.Crossref | GoogleScholarGoogle Scholar | 1:CAS:528:DC%2BD2sXhtlans7nN&md5=7f189bec3d8e7c364f231b16ec88bf5cCAS |
[26] A. Dreyer, V. Langer, R. Ebinghaus, Determination of octanol–air partition coefficients (KOA) of fluorotelomer acrylares, perfluoroalkyl sulfonamids, and perfluoroalkylsulfonamido ethanols. J. Chem. Eng. Data 2009, 54, 3022.
| Determination of octanol–air partition coefficients (KOA) of fluorotelomer acrylares, perfluoroalkyl sulfonamids, and perfluoroalkylsulfonamido ethanols.Crossref | GoogleScholarGoogle Scholar | 1:CAS:528:DC%2BD1MXht1Sqt7bF&md5=88b1c7731f67a1e6b18f18d280de54d2CAS |
[27] C. R. Powley, S. W. George, T. W. Ryan, R. C. Buck, Matrix effect-free analytical methods for determination of perfluorinated carboxylic acids in environmental matrixes. Anal. Chem. 2005, 77, 6353.
| Matrix effect-free analytical methods for determination of perfluorinated carboxylic acids in environmental matrixes.Crossref | GoogleScholarGoogle Scholar | 1:CAS:528:DC%2BD2MXps1erurk%3D&md5=a834e44fc7884ac680c45d2e65f0962aCAS |
[28] D. R. Helsel, M. T. Obvious, Better methods for interpreting non-detect data. Environ. Sci. Technol. 2005, 39, 419A.
| Better methods for interpreting non-detect data.Crossref | GoogleScholarGoogle Scholar | 1:CAS:528:DC%2BD2MXhtFWjsrbN&md5=c59dff72053665f526881169d2f5aafbCAS |
[29] M. Shoeib, T. Harner, P. Vlahos, Perfluorinated chemicals in the Arctic atmosphere. Environ. Sci. Technol. 2006, 40, 7577.
| Perfluorinated chemicals in the Arctic atmosphere.Crossref | GoogleScholarGoogle Scholar | 1:CAS:528:DC%2BD28Xht1SlsrzK&md5=a5e45f2168df38e4815e34d061c1b01aCAS |
[30] M. M. Schultz, C. P. Higgins, A. Huset, R. G. Luthy, D. F. Barofsky, J. A. Field, Fluorochemical mass flows in a municipal wastewater treatment facility. Environ. Sci. Technol. 2006, 40, 7350.
| Fluorochemical mass flows in a municipal wastewater treatment facility.Crossref | GoogleScholarGoogle Scholar | 1:CAS:528:DC%2BD28Xos1Sgtrw%3D&md5=cd2bf27eda9156caa5cc7a8110bf7a3dCAS |
[31] K. Prevedouros, I. T. Cousins, R. C. Buck, S. H. Korzeniowski, Sources, fate and transport of perfluorocarboxylates. Environ. Sci. Technol. 2006, 40, 32.
| Sources, fate and transport of perfluorocarboxylates.Crossref | GoogleScholarGoogle Scholar | 1:CAS:528:DC%2BD2MXht1Gru7zK&md5=14e91a9069cf17a00b47907f105e54b6CAS |
[32] A. G. Paul, K. C. Jones, A. Sweetman, A first global production, emission, and environmental inventory for perfluorooctane sulfonate. Environ. Sci. Technol. 2009, 43, 386.
| A first global production, emission, and environmental inventory for perfluorooctane sulfonate.Crossref | GoogleScholarGoogle Scholar | 1:CAS:528:DC%2BD1cXhsVyks7%2FJ&md5=63238d1759e406591a922fb0ed3a709cCAS |
[33] A. Dreyer, V. Matthias, C. Temme, R. Ebinghaus, Annual time series of air concentrations of polyfluorinated compounds. Environ. Sci. Technol. 2009, 43, 4029.
| Annual time series of air concentrations of polyfluorinated compounds.Crossref | GoogleScholarGoogle Scholar | 1:CAS:528:DC%2BD1MXltVKks7w%3D&md5=a7a4dc24a71a5b703c87fa3c722b80d1CAS |
[34] A. Jahnke, L. Ahrens, R. Ebinghaus, C. Temme, Urban versus remote air concentrations of fluorotelomer alcohols and other polyfluorinated alkyl substances in Germany. Environ. Sci. Technol. 2007, 41, 745.
| Urban versus remote air concentrations of fluorotelomer alcohols and other polyfluorinated alkyl substances in Germany.Crossref | GoogleScholarGoogle Scholar | 1:CAS:528:DC%2BD28XhtlektLzL&md5=452f5dfdf7ee90cf831c40b6ed543dbbCAS |
[35] M. Shoeib, P. Vlahos, T. Harner, A. Peters, M. Graustein, J. Narayan, Survey of polyfluorinated chemicals (PFCs) in the atmosphere over the northeast Atlantic Ocean. Atmos. Environ. 2010, 44, 2887.
| Survey of polyfluorinated chemicals (PFCs) in the atmosphere over the northeast Atlantic Ocean.Crossref | GoogleScholarGoogle Scholar | 1:CAS:528:DC%2BC3cXnvFOisrw%3D&md5=b36ed008b10dc79abe81f7f9cd217d8dCAS |
[36] M. A. Kaiser, B. S. Larsen, C.-P. C. Kao, R. C. Buck, Vapor pressures of perfluorooctanoic, -nonanoic, -decanoic, -undecanoic, and -dodecanoic acids. J. Chem. Eng. Data 2005, 50, 1841.
| Vapor pressures of perfluorooctanoic, -nonanoic, -decanoic, -undecanoic, and -dodecanoic acids.Crossref | GoogleScholarGoogle Scholar | 1:CAS:528:DC%2BD2MXovFWhtLk%3D&md5=e0fa1d460db053fe27e84b6c88fd7a2dCAS |
[37] S. Rayne, K. Forest, Perfluoroalkyl sulfonic and carboxylic acids: a critical review of physicochemical properties, levels and patterns in waters and wastewaters, and treatment methods. J. Environ. Sci. Heal. A 2009, 44, 1145.
| Perfluoroalkyl sulfonic and carboxylic acids: a critical review of physicochemical properties, levels and patterns in waters and wastewaters, and treatment methods.Crossref | GoogleScholarGoogle Scholar | 1:CAS:528:DC%2BD1MXht1SqurjJ&md5=99083028fb53a20b36a0de50dd4961b4CAS |
[38] J. Klánová, P. Eupr, J. Kohoutek, T. Harner, Assessing the influence of meteorological parameters on the performance of polyurethane foam-based passive air samplers. Environ. Sci. Technol. 2008, 42, 550.
| Assessing the influence of meteorological parameters on the performance of polyurethane foam-based passive air samplers.Crossref | GoogleScholarGoogle Scholar |
[39] H. P. H. Arp, K.-U. Goss, Irreversible sorption of trace concentrations of perfluorocarboxylic acids to fiber filters used for air sampling. Atmos. Environ. 2008, 42, 6869.
| Irreversible sorption of trace concentrations of perfluorocarboxylic acids to fiber filters used for air sampling.Crossref | GoogleScholarGoogle Scholar | 1:CAS:528:DC%2BD1cXhtFSqsbjL&md5=80d2de80b9fd006fd37f630c37b68151CAS |