

Mapping the distribution, biomass and tissue nutrient levels of a marine benthic cyanobacteria bloom (Lyngbya majuscula)
Kathleen S. Ahern A E , Colin R. Ahern B , Greg M. Savige C and James W. Udy A DA University of Queensland, Water Studies, School of Engineering, Brisbane, Qld 4072, Australia.
B Queensland Department of Natural Resource and Water, Indooroopilly, Brisbane, Qld 4068, Australia.
C Savige Fisheries, Bribie Island, Qld 4507, Australia.
D Southeast Queensland Water Corporation, 240 Margaret Street, Brisbane, Qld 4002, Australia.
E Corresponding author. Email: k.ahern1@uq.edu.au
Marine and Freshwater Research 58(10) 883-904 https://doi.org/10.1071/MF07065
Submitted: 2 April 2007 Accepted: 11 September 2007 Published: 30 October 2007
Abstract
Benthic cyanobacteria blooms, including those of the nitrogen-fixing species Lyngbya majuscula, appear to be becoming more numerous and widespread in marine habitats worldwide, and have negative impacts on the environment and human health. The progression of a L. majuscula bloom in south-east Queensland, Australia was mapped along with intensive biomass and tissue nutrient sampling every 10–14 days over the bloom’s 3.5-month duration in summer 2005–2006. Data-integrated GIS maps illustrated the changes in biomass and tissue nutrient pool of the L. majuscula through different growth phases (incipient, rapid expansion, plateau or peak and decline) of the bloom. At the peak, L. majuscula covered 509 ha and had a mean density of 115 gdw m–2, with the maximum density recorded 503 gdw m–2. The highest mean total carbon (29.4% C), nitrogen (3.5% N) and phosphorus (0.143% P) contents in L. majuscula tissue corresponded with the peak in biomass. Three-dimensional modelling calculated that at the peak, the bloom contained 5057 tww (510 tdw) of L. majuscula; 150 000 kg C; 18 000 kg N; 720 kg P; and 5200 kg Fe. This information gives an insight into L. majuscula bloom dynamics and ecophysiology and provides quantitative data for models.
Additional keywords: Australia, harmful algae, iron, modelling, Moreton Bay, nitrogen, phosphorus.
Introduction
Mixed assemblage mats dominated by filamentous nitrogen-fixing and non-nitrogen-fixing cyanobacteria, such as Microcoleus, Oscillatoria and Lyngbya species, are an important and highly productive benthic component of marine intertidal and subtidal habitats (Paerl and Millie 1996). However, their capacity for rapid growth and areal expansion in response to climatic and environmental stimuli (such as increased water temperature or nutrient inputs) can lead to the formation of extensive, mono-specific blooms of cyanobacterial mats that dominate the benthic community (e.g. Stielow and Ballantine 2003; Albert et al. 2005; Paul et al. 2005). These blooms appear to be becoming more numerous, widespread and persistent in some tropical and subtropical marine embayments, estuaries and reef environments worldwide and have many negative impacts on the environment and on human health (Paerl and Fulton 2006).
One such harmful alga capable of forming blooms is Lyngbya majuscula, a filamentous, non-heterocystous nitrogen-fixing cyanobacterium (family Oscillatoriaceae) (Diaz et al. 1990). L. majuscula is composed of fine, filamentous strands ~10–30 cm in length that form benthic mats either growing on the sediment or loosely attached to substrates such as seagrass, macroalgae, corals and rocky outcrops (Diaz et al. 1990; Stielow and Ballantine 2003; Albert et al. 2005). L. majuscula occurs from the intertidal zone to a depth of 30 m (Izumi and Moore 1987) and has a worldwide distribution in tropical and subtropical estuarine and coastal waters (O’Neil and Dennison 2005). Blooms of L. majuscula have been recorded in Australia, Curacao, Florida, Guam, Hawaii, Mozambique and the Philippines (Diaz et al. 1990; Dennison and Abal 1999). In Australia, blooms have also been identified at several locations along coastal Queensland including Fraser Island, the Keppel Islands, Hardy Reef, Hervey Bay, Hinchinbrook Island and Shoalwater Bay (Dennison et al. 1999; Albert et al. 2005), with the best documented blooms within Moreton Bay in south-east Queensland.
Deleterious impacts of L. majuscula blooms include overgrowth and smothering of intertidal and subtidal benthic communities (Stielow and Ballantine 2003; Watkinson et al. 2005), such as seagrass and coral communities in Florida, USA (Paul et al. 2005). Additionally, benthic mats often become detached from the sea-floor and can drift onshore forming a stench-creating, hazardous residue on foreshores that requires costly removal by local authorities (O’Neil and Dennison 2005). Blooms also have a debilitating impact on recreational and commercial seafood industries in Moreton Bay, with considerably lower fish harvests during bloom events (O’Neil and Dennison 2005). The toxic nature of L. majuscula (detailed in Osborne et al. 2001) poses a public health concern, with acute dermatitis following contact with L. majuscula and respiratory and asthma-like symptoms (predominantly after association with L. majuscula aerosols) reported by recreational water-users and fishermen in both Hawaii and Australia (Dennison et al. 1999; Osborne et al. 2007).
Several environmental variables may act synergistically to stimulate the formation of nuisance algal blooms in marine and estuarine environments. These include: physical factors (warmer water temperatures, vertical stratification of the water column, high irradiance and long daylength); biotic factors (grazers, bacterial synergism and symbionts); and chemical factors (nutrients, organic matter and trace element enrichment) (Paerl and Millie 1996). Although L. majuscula has been shown to be the preferred food for specialist invertebrates such as sea hares (e.g. Stylocheilus striatus and Bursatella leachii) (Capper et al. 2005), most cyanobacteria are rendered highly unpalatable to generalist herbivores by the presence of secondary metabolites (Pennings et al. 1996; Thacker et al. 1997). Therefore, Thacker and Paul (2001) proposed that bottom-up factors (such as an input of bioavailable nutrients) are more likely to control benthic cyanobacterial populations than top-down factors (e.g. herbivore grazing).
There is increasing evidence to suggest an association between an input of bioavailable nutrients from anthropogenic sources and the increased distribution and proliferation of L. majuscula blooms (Albert et al. 2005; Watkinson et al. 2005; Ahern et al. 2006b). Although the source and/or mechanism for delivery of nutrients may differ for blooms in different locations, an elevated supply of nutrients to coastal regions and watersheds adjacent to blooms has commonly been observed in Australia and worldwide. In the Caribbean, anthropogenic nutrient loads have been linked to L. majuscula (= Microcoleus lyngbyaceus) blooms in Puerto Rico (Diaz et al. 1990; Stielow and Ballantine 2003). In the low nutrient waters of Hardy Reef, on the Great Barrier Reef, Australia, localised L. majuscula blooms are thought to be stimulated by nutrients washing off a helicopter pad that acts as a roost site for seabirds (guano is high in organics, phosphorus and iron) (Albert et al. 2005). In south-east Queensland, the increased severity and frequency of L. majuscula blooms in northern Moreton Bay (Deception Bay) in the last decade have been linked to land-derived nutrients (particularly bioavailable iron, organics, phosphorus and nitrogen) in runoff and groundwater (Albert et al. 2005; Watkinson et al. 2005; Ahern et al. 2006b). Additionally, dissolved nutrients, particularly organically chelated iron and phosphorus, promote prolific growth of L. majuscula in both the laboratory and the field; therefore have the ability to strongly influence the intensity and severity of blooms in Moreton Bay (Ahern et al. 2007, in press).
Given the serious detrimental impacts of L. majuscula blooms in Moreton Bay and their link to short and/or long-term nutrient inputs (Dennison et al. 1999; Albert et al. 2005; Watkinson et al. 2005; Ahern et al. 2007), the Queensland Government has recently developed a new Harmful Algal Bloom Policy within the South-east Queensland Coastal Plan (EPA 2006). This policy requires development to avoid or minimise the release of ‘nutrients of concern’ to the coastal waters of Moreton Bay. To support this, Bayesian decision networks are being developed by a team of scientists working with the South-East Queensland Healthy Waterways Partnership (SEQHWP) to develop predictive models for L. majuscula blooms and their nutritional requirements. These will be used to assist in developing management strategies to limit or reduce the size and impacts of future blooms. Essential to such decision models is the measurement and modelling of biomass and the nutrient status of L. majuscula through the bloom cycle.
The present study followed the course of a summer bloom of L. majuscula in Deception Bay. Detailed field observations, extensive biomass sampling and a three-dimensional model were used to map the increase in areal extent, biomass and tissue nutrients as the bloom peaked and subsequently declined. Findings from the current study are compared with the limited historical data on previous blooms and other world literature on L. majuscula.
Materials and methods
Study area
Northern Deception Bay in south-east Queensland, Australia (Fig. 1), is a relatively shallow embayment, with vegetated tidal flats where summer blooms of L. majuscula appear to have increased in intensity and severity over the past decade (Dennison et al. 1999; Albert et al. 2005; Watkinson et al. 2005). The intertidal and subtidal shallow banks are predominately composed of fine sandy, silty sediments supporting mixed-species seagrass–algal beds. The beds are largely dominated by the seagrasses Zostera muelleri, Syringodium isoetifolium and Halophila ovalis. Smaller amounts of Halophila spinulosa and Halodule univernis are also present, as well as various species of macroalgae (Chlorophyta and Phaephyta) including Udotea flabellum, Caulerpa taxifolia and Hydroclathrus clathratus.

|
Northern Deception Bay is influenced by oceanic water on a semi-diurnal tidal cycle, with terrigenous input draining from both Pumicestone Channel to the north and Caboolture River to the south-west. Oceanic water dominates the site during a flood tide, with catchment water dominating during the ebb tide. Surrounding catchments have been extensively affected by human development, including rapid expansion of urban and rural/residential areas, livestock grazing, the removal of natural vegetation, extensive pine plantation forestry and smaller areas of horticulture, agriculture, sand and gravel extraction and intensive poultry farming.
Abiotic parameters
The study was conducted during late spring and summer (October 2005–February 2006). Total daily rainfall recorded at the Brisbane Airport (station number 040842; ~38 km from the study area) was provided by the Australian Bureau of Meteorology (ABM). Global Solar Exposure in the study area was also provided by the ABM, derived from satellite data and used to calculate daily surface light (MJ m–2 day–1).
Water temperature data was provided by the Queensland Environmental Protection Agency and recorded at an automated sampling station within the perimeter of the bloom (~2 m below mean sea level and 1.4 km from shoreline). However, this recording station had an equipment malfunction from 6 December to 30 December 2005. Therefore, during this period, data from the closest station (which belonged to Queensland Department of Primary Industries and Forestry) located at Caboolture River Mouth ~13 km from the study site, was used. In addition to the aforementioned data, water temperature, pH and electrical conductivity were also recorded using a calibrated, combined temperature, conductivity and pH meter (model WP-81, TPS Pty Ltd, Brisbane) at each site on each sampling event.
Water quality sampling was conducted at approximately monthly intervals (November 2005, December 2005 and January 2006) during the bloom period at low tide at three different locations. For dissolved nutrient and organic carbon analyses, sampled water was filtered through 0.45-µm membrane filters (Gelman Sartorius) into pre-rinsed 100-mL polyethylene bottles. Samples were immediately placed on ice and frozen on return to the laboratory before analysis. Soluble ammonium (NH4-N), nitrate and nitrite (NOx-N) and orthophosphate (PO4-P) were determined on a Foss STAR5000, Flow Injection Analysis Colorimeter (APHA/AWWA/WEF 2005). Dissolved Kjeldahl nitrogen and phosphorus were also determined by Flow Injection Analysis Colorimetry after Kjeldahl digestion. Dissolved organic carbon was determined using a Non-Dispersive Infra Red (NDIR) detection cell (APHA/AWWA/WEF 2005). For dissolved (0.45-µm membrane filtered) and total metal analysis, water was collected in pre-rinsed 250-mL polycarbonate bottles and fixed with 5 mL of 70% AR grade nitric acid (v/v). Metal contents were determined using Inductively Coupled Plasma Optical Emission Spectrometry (ICPOES) (Thermo Jarrell Ash Corporation, Franklin, MA) (APHA/AWWA/WEF 2005).
Sediment samples were collected at four sites across the study area on three separate occasions between November and January. At each site five replicate sediment cores were taken to a depth of 5 cm, using 60-mL cut-off syringe corers, then immediately placed on ice and frozen on return to the laboratory. Sediment samples were dried at 40–45°C for 3 days in a fan-forced oven and ground to <0.5 mm. Total carbon and nitrogen content were determined by combustion using an induction furnace (CNS-2000 Laboratory Equipment Corporation (Leco), St Joseph, MI, USA: Yeomans and Bremmer 1991). Organic carbon was also determined using combustion after pretreatment with sulfurous acid to remove carbonates before analysis. Inorganic carbon was determined by calculating the difference between total carbon and organic carbon. Total iron and phosphorus were determined using an ICPOES after a perchloric acid + nitric acid + hydrogen peroxide microwave (MLS-1200 MEGA, Milestone, Italy) digest. Extractable iron (0.005 M diethylenetriaminepentaacetic acid, DTPA) was measured on dried samples (Method 12A1: Rayment and Higginson 1992) using ICPOES and extractable phosphorus was determined by extraction with 0.5 M bicarbonate extractable phosphorus Method 9B2 (Rayment and Higginson 1992).
Biomass sampling and bloom extent
The progression of a L. majuscula bloom was investigated by mapping the areal extent and biomass over the duration of a bloom in late spring/summer (September 2005–February 2006). To ensure maximum visibility, sampling was timed to coincide with the period of lowest tide during daylight hours and hence was restricted to observation periods of 4–5 h on a limited number of days each month. In the days before sampling, the boundary of L. majuscula occurrence was mapped by boat using a global positioning system (GPS). On the day of sampling, the boundaries were confirmed and L. majuscula occurrence within the boundary was mapped according to Roelfsema et al. (2006) by GPS following a ‘zig zag’ path across the study area and stopping to sample approximately every 500–700 m, with 13–24 sites (Table 1) sampled each day (depending on weather, light and tidal conditions). On approaching a site, the boat was stopped and allowed to drift as observational estimates of L. majuscula cover were made using a viewing bucket or mask. A 20–50 m transect at each site was categorised as having L. majuscula cover of 0%, 1–10%, 11–40%, 41–70%, 71–100%, with the colour (black/brown to clear) and visible ‘health’ of the L. majuscula recorded. The following water quality parameters were also recorded: water temperature, electrical conductivity, pH, and water depth.

|
Five replicate samples of L. majuscula biomass were also collected along the 20–50 m transect at ~4–10 m intervals. Given the high spatial variability of L. majuscula over short distances, the mean of five replicates was used to provide a reliable measure of the average density at each sampling site. To measure biomass, a 0.38-m-wide fine rake was pulled over the sediment for a distance of 0.38 m (forming a sampling area of 0.144 m2) to harvest the L. majuscula. The advantage of this method was that it allowed five replicate samples of biomass to be taken at many sites in the limited time available around low tide. Manual sampling of L. majuscula within a quadrat (0.25 × 0.25 m quadrat, using snorkelling equipment) was also undertaken to determine the efficiency of the ‘rake’ method but was found to be much slower and impractical in low visibility (very common in Deception Bay) and/or windy weather conditions. The mean L. majuscula biomass collected using the ‘rake method’ was significantly correlated (R2 = 0.92; P < 0.0001; Fig. 2) with the mean biomass using the ‘quadrat method’ based on 5 replicates at 30 sites, conducted at 5 different sampling events to cover the wide range of biomass densities encountered. Given that the intercept of the regression line was not significantly (P < 0.05) different from zero, the regression was re calculated without the intercept. The rake method was found to be slightly lower (by 8%) than the biomass estimates made using the quadrat method and therefore, all rake biomass data was ‘adjusted upwards’ using the regression equation y = 1.08x (g m–2).
|
At the time of collection, the L. majuscula samples were washed in seawater to remove sediment, placed in plastic bags and stored on ice in a cooler box for immediate transport to the laboratory. Samples were thoroughly washed again in seawater to remove any remaining sand and fine sediment, and all visible non-L. majuscula material, such as seagrass and algae, was carefully removed using tweezers, after which the samples were thoroughly washed again with filtered seawater. Although this procedure could not guarantee complete removal of all marine biota, algae or bacteria that commonly occur in the natural environment within the matrix of L. majuscula filaments, any remaining material was likely to be insignificant on a weight basis. After squeezing excess water from the biomass and careful blotting on absorbent paper towel, wet weight (±0.1 g) was measured. The blotted wet weight values were converted to oven dry weight (60–65°C) using a moisture factor (separately determined on 25 sub-samples) and biomass results were reported as gdw m–2.
Tissue nutrient analysis
After weighing, L. majuscula samples were sub-sampled, immediately frozen and stored for tissue nutrient analysis. Selected samples (Table 1) were digested in a microwave digestion apparatus (Multiwave 3000, Anton Parr, Austria) using nitric acid (HNO3). Tissue phosphorus and iron were then determined on the digested solution using an ICPOES.
On the same samples selected for phosphorus and iron analyses, another sub-sample was analysed for total carbon and nitrogen. Sub-samples of L. majuscula (~10 g wet weight) were oven-dried (60–65°C) and tissue total carbon and nitrogen content analysed by combustion on an induction furnace (CNS-2000 Leco, St Joseph, Michigan, USA: Yeomans and Bremmer 1991).
To test for possible contribution of inorganic carbonates to the total carbon results, 40 samples, representative of the range of total carbon concentrations encountered and the period of the bloom, were selected for determination of inorganic carbon content using a loss on ignition (LOI) technique. Platinum crucibles were pre-ignited to 1100°C, cooled in a desiccator and weighed (±0.0001 g). Pre-dried (65°C) L. majuscula samples (~1–2 g) were added and accurately weighed (±0.0001 g). The crucibles with samples were then heated to 180°C for 24 h to remove remaining moisture. The crucibles and samples were removed, cooled in a desiccator and weighed (±0.0001 g). The crucibles with samples were then ignited to 550°C for 4 h in a furnace to remove carbonaceous and nitrogenous material. The crucibles and samples were removed, cooled in a desiccator and weighed (±0.0001 g). The crucibles and samples were then returned to a furnace and reignited to 1100°C for 4 h. The crucibles and samples were removed, cooled in a desiccator and weighed (±0.0001 g). The loss of weight from 550°C to 1100°C was assumed to be a result of carbon dioxide, from carbonate or bicarbonate, being released. A simple calculation was applied to convert this to inorganic carbon. This loss on ignition between 550°C and 1100°C method gives a maximum result for inorganic carbon, as it includes any other material not volatilised at 550°C but volatilised at 1100°C. Organic carbon was then calculated for the 40 samples by subtracting inorganic carbon (determined by LOI) from total carbon.
A highly significant linear regression equation was calculated between organic carbon and total carbon for the 40 samples (Fig. 3): Organic carbon = 0.955·total carbon − 0.983 (R2 = 0.996; P < 0.0001).
|
Although our carbon and C : N, C : P and C : Fe ratios are based on total carbon, they can be multiplied by 0.955 (using the above regression) if comparison is required with carbon or ratio data that has been expressed on a ‘carbonate free’ basis, such as used by Atkinson and Smith (1983).
Data analysis
Statistical analysis was performed using Statistica software. Prior to analysis by a linear model, residuals were examined to ensure variances of the dependent variables were homogeneous and followed a normal distribution. If any of these assumptions were not met, the data was transformed and then rechecked for normality and variance homogeneity.
For L. majuscula biomass, the effect of sampling event (n = 10) and site were both tested using a nested analysis of variance (ANOVA). As five replicate biomass samples were collected at each site (n = 13–24 sites, depending on sampling event), sites were nested within sampling events (Table 1). A Fisher’s least significant difference (l.s.d.) test (using Snedecor’s F statistic) was run to compare differences between sampling events.
For L. majuscula tissue nutrient content (%C, %N, %P and %Fe) and atomic ratios (C : N, N : P, C : P and C : Fe), the effect of sampling time was tested using a one-way ANOVA on the mean tissue nutrient value for each sampling site and a Fisher’s least significant difference (l.s.d.) test (using Snedecor’s F statistic) used to compare significance differences between sampling events. This design (using the mean tissue content or mean ratio per site), rather than a design that statistically incorporated the individual replicates for each site (as was used to analyse the biomass data), was applied because of the unequal number of tissue nutrient samples analysed per site (Table 1). The unequal number of tissue nutrient samples per site was unavoidable because some replicates and some sites had little or no measurable biomass, particularly in the earlier and later stages of the bloom, and so they could not be analysed for tissue nutrient content. Additionally, where biomass samples were small, bulking of replicates was necessary to obtain sufficient sample for laboratory analysis.
GIS mapping and 3-D modelling
The boundaries of L. majuscula were measured using a GPS and digitised to produce maps using ArcInfo software. Using a three-dimensional (3-D) model in ArcInfo, the total biomass (tonnes) of L. majuscula was calculated for each sampling event. In the biomass model, the mean biomass density (g m–2 from 5 replicates) at each sampling site was treated as the Z axis, whereas the location of the site was treated as the X and Y axes. The mapped outer boundary of L. majuscula growth was treated as continuous points with a value of zero for the Z axis. In calculating total biomass, the model creates continuous surfaces and contours between points in three dimensions. For display purposes, contour intervals of biomass density were selected and assigned a colour, grading from white (<10 gdw m–2) to red (>300 g m–2).
To calculate the total nutrients in the L. majuscula for each sampling event, the biomass density for each sample was multiplied by the relevant tissue nutrient content to give g m–2 (C, N, P, and Fe) and the mean (5 reps) for each site location was used as the Z axis in the three-dimensional model. The mapped outer boundary was treated as zero for the Z axis and the total nutrients were modelled using continuous surfaces and contours between points in three dimensions. For display purposes in the nutrient maps, contour intervals of nutrient density (g m–2 ranges) were selected and assigned a colour, grading from white for lowest density through to red for the highest density.
Results
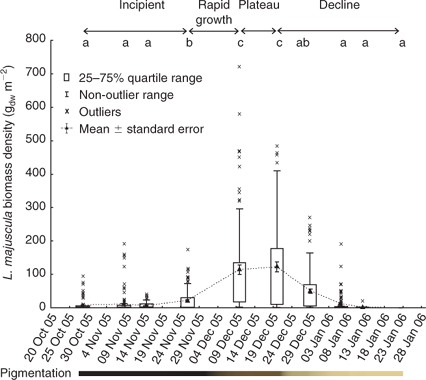
At Deception Bay in 2005–2006, L. majuscula appeared to cycle through a series of distinct growth phases (termed ‘incipient’, ‘rapid growth’, ‘plateau’ or ‘peak’ and ‘declining’ phases in the present study: Figs 4, 6). L. majuscula areal extent and biomass increased steeply during the rapid growth phase, during which the total carbon, nitrogen, phosphorus and iron contents of the L. majuscula tissue were also high. At the plateau or peak of the bloom, the total biomass was calculated at 4760–5060 tww, with a mean biomass density of 97–123 gdw m–2. The biomass and nutrient contents then rapidly decreased during the declining phase.
|
Lyngbya majuscula biomass density
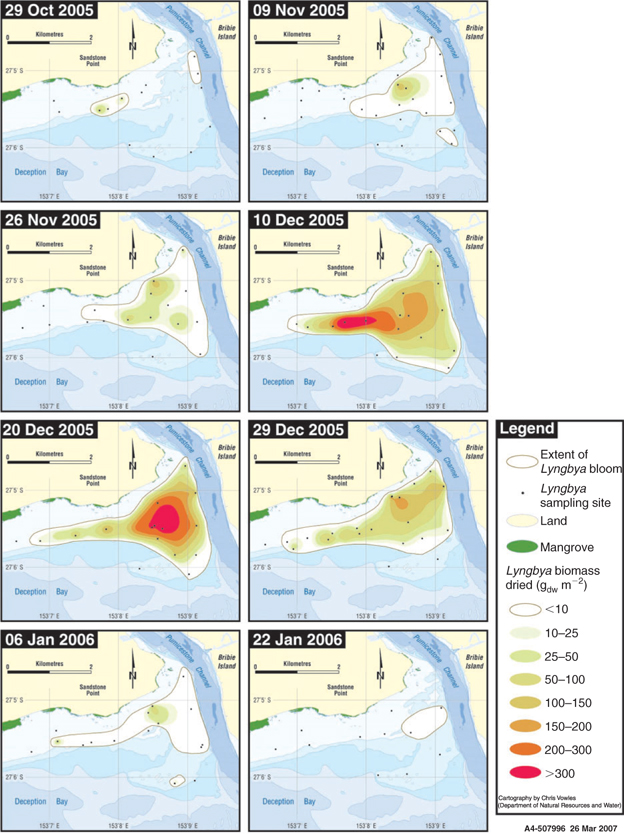
Both the time of sampling (event) and the location (site) had a highly significant impact on L. majuscula biomass (event F9,157 = 228; P < 0.001 and site F9,157 = 17.0; P < 0.001). A sequence of maps showing areal extent and biomass density across Deception Bay for 8 of the 10 samplings is shown in Fig. 5.
|
Incipient phase
No L. majuscula biomass was detected in the early spring of 2005, with the first detectable growth observed on 29 October 2005. At this time, L. majuscula was observed over an area of 49 ha (Table 2, Fig. 5), with a mean event biomass density of 7.9 gdw m–2 and individual site means ranging from 1.5 to 61 gdw m–2 (Fig. 4). The L. majuscula filaments were commonly observed growing as a thin film on the sediment (Fig. 6a) and over the leaves of seagrasses Zostera muelleri and Syringodium isoetifolium (Fig. 6b). At several sites, small, dark brown to black tufts had formed (up to ~5 cm high) below the seagrass canopy (Fig. 6c) but coverage was commonly less than 10%.

|
Growth increased over the latter part of this phase, in that over the next month (29 October–26 November 2005), the area expanded almost 10-fold to cover 329 ha (Table 2, Fig. 5) and the event mean density significantly (P < 0.001) increased (~3 fold) from 7.9 to 22.0 gdw m–2 (Fig. 4). During this time, the dense, dark brown/black L. majuscula clumps increased in size to form benthic mats sometimes covering up to 40% of the benthos (Fig. 6d).
Rapid growth phase
Over the following 14 days L. majuscula underwent a period of rapid growth. The L. majuscula area increased (Table 2, Fig. 5) from 329 ha (26 November) to peak at 529 ha (10 December), while event mean density (Fig. 4) increased over 5-fold (P < 0.001) to reach 97 gdw m–2. Over the period of very rapid growth, the L. majuscula tufts continued to expand and overtop the seagrass–algae (Fig. 6d). The colour of the L. majuscula lightened from the very dark brown to black colour during the incipient phase, to a lighter brown colour during the rapid growth phases (Fig. 4).
Plateau phase
During the plateau phase (10–20 December), the bloom reached its maximum areal extent (529–441 ha; Table 2; Fig. 5) and biomass density (97–123 gdw m–2; Fig. 4). However, different areas within the main bloom perimeter were observed to expand, peak and/or decline at different rates (Fig. 5). For example, on 10 December, high densities (>300 gdw m–2) were recorded in the eastern part of the bloom, but in the following 10 days biomass density in this area decreased (<150 gdw m–2), whereas densities in the more north-western area increased substantially (>300 gdw m–2) (Fig. 5).
During the plateau phase, L. majuscula often covered up to 100% of the benthos, with mats up to 15 cm high (Fig. 6e). On hot, sunny, calm days (particularly observed during sampling on 10 December 2005), oxygen bubbles formed in the L. majuscula mats, causing them to float to the surface and form large rafts (Fig. 6f). These rafts often accumulated on adjacent shorelines (Fig. 6g), necessitating removal by local authorities.

|
Declining phase
After the plateau phase, the biomass density underwent a significant (P < 0.001) and rapid decrease, with the event mean density on 29 December (50 gdw m–2) being less than half that of the previous sampling event (20 December 2005: 123 gdw m–2) (Fig. 4). This was accompanied by further lightening in pigmentation, with most of the L. majuscula losing its brown pigmentation to become a very light brown to cream colour (Fig. 4). Despite the rapid reduction in biomass, the areal extent of the bloom decreased only slightly from 441 to 417 ha (Table 2, Fig. 5).
Over the following 8 days (from 29 December 2005 to 6 January 2006) the L. majuscula continued to rapidly decrease. Specifically, the areal extent decreased from 417 to 257 ha (Table 2; Fig. 5) and the event mean density decreased 3-fold from 50 to 12 gdw m–2 (P < 0.001; Fig. 4). By 22 January, the area had further decreased (5-fold) to 57 ha (Table 2, Fig. 5) and event mean density declined to 0.4 gdw m–2 (Fig. 4). By 5 February 2006, there were no visible signs of L. majuscula present in the area. During the declining phase, the L. majuscula tufts were clear or white in colour, commonly attached to seagrass leaves as thin wisps and often covered in copepods (e.g. Metis sp.). Additionally, large decomposing masses of L. majuscula on the sea-floor, measuring up to 0.5 m high and 1.5 m in diameter that were clear, white, yellow or black in colour, were common in the area (Fig. 6h).
Tissue nutrient content
The event mean total carbon, nitrogen and phosphorus contents (Fig. 7) of L. majuscula tissue for the Deception Bay bloom in 2005–2006 were relatively constant during the incipient and rapid growth phases. The maximum nutrient contents corresponded with the beginning (10 December for total carbon and nitrogen) or end (20 December for phosphorus) of the plateau phase. The total carbon and nitrogen content began to decrease during the plateau phase (after 10 December), but the phosphorus content did not start to decrease until the declining phase (after 20 December). Tissue contents decreased slowly at first, then dramatically as biomass decreased and started decaying and disintegrating. The atomic ratios of the L. majuscula tissue (Fig. 8) showed that during the declining phase of the bloom, tissue nitrogen is lost faster than total carbon, phosphorus and iron.
|
|
Total carbon, nitrogen, phosphorus and iron content
There was a highly significant effect of sampling time on the total carbon (F9,98 = 329; P < 0.001), total nitrogen (F9,98 = 35.2; P < 0.001) and total phosphorus (F9,98 = 10.1; P < 0.001) content of the L. majuscula tissue. However, there was no significant difference between sampling events for total iron (F9,98 = 1.1; P = 0.35).
The mean total carbon content (Fig. 7a) increased during the incipient and rapid growth phases, from 26.8% C (29 October) to reach a maximum of 29.4% C on 10 December. During the plateau phase, the event mean total carbon content significantly (P < 0.05) decreased to 25.1% C by 20 December. This decrease continued with each sampling event during the declining phase to reach 24.4% C on 29 December (P > 0.05), 21.2% C by 6 January (P > 0.05), 11.1% C on 12 January (P < 0.001) and 9.4% C on 22 January 2006 (P > 0.05). The L. majuscula from the last sampling event (9.4% C) had less than a third of the mean total carbon content of the maximum (29.4% C) when the L. majuscula was dark brown to black in colour.
The mean total nitrogen content (Fig. 7b) increased slightly (but non-significantly; P > 0.05) during the incipient and rapid growth phases from 3.2% N on 29 October 2005 to a maximum of 3.5% N on 10 December 2005 (Fig. 7b). In the plateau phase, the event mean nitrogen content declined significantly (P < 0.01) to 2.8% N on 20 December. This decrease continued with consecutive sampling events during the declining phase, having significantly dropped to 2.3% N on 29 December (P < 0.01), 1.8% N on 6 January (P < 0.01), 0.8% N on 12 January (P < 0.001) and 0.6% N on 22 January 2006 (P > 0.05). L. majuscula from the last sampling event (0.6% N) had less than a fifth of the mean nitrogen content of the maximum (3.5% N) when the L. majuscula was dark brown to black in colour.
The mean total phosphorus content of L. majuscula remained relatively constant (~0.11% P) during the incipient phase (Fig. 7c). As biomass increased dramatically during the high growth phase (26 November–10 December), the phosphorus content also significantly (P < 0.05) increased from 0.115% P to 0.136% P. During the plateau phase, the event mean phosphorus content continued to increase slightly (but not significantly; P > 0.05), to reach a maximum of 0.143% P on the 20 December 2005. The mean phosphorus content significantly (P < 0.001) decreased with decreasing biomass to 0.110% P on the 29 December. This decrease continued between the 6 January and 12 January (0.074% P; P < 0.001) and further dropped to 0.043% P by 22 January (P < 0.05). L. majuscula from the last sampling event (0.043% P) was one third of the maximum phosphorus content (0.143% P).
The mean total iron content of L. majuscula (Fig. 7d) followed a similar pattern to that of phosphorus over the bloom cycle, but there was no significant difference between sampling events. This was a result of the wider range of values within each sampling event (indicated by the much larger standard errors for iron than the other nutrients; Fig. 7) and smaller temporal variability (i.e. there was only a 2-fold difference between the minimum and maximum iron contents). The mean iron content gradually increased from 0.95% Fe on 29 October 2005 to peak at 1.1% on 20 December 2005 during the plateau phase. After this date, iron content generally decreased during the declining phase to 0.68% Fe by 22 January 2006.
Atomic ratios
There was a highly significant effect of sampling time on the mean atomic C : N ratio (F9,98 = 38.2; P < 0.001), N : P ratio (F9,98 = 13.4; P < 0.001), C : P ratio (F9,98 = 4.5; P < 0.001) and C : Fe ratio (F9,98 = 5.4; P < 0.001) of L. majuscula tissue.
The event mean C : N ratio (Fig. 8a) remained stable, fluctuating only slightly between 9.9 and 10.5 during the incipient, rapid growth and plateau phases. As biomass decreased (declining phase), the event mean C : N ratio significantly increased to 12.7 on 29 December (P < 0.001), 15.0 on 6 January (P < 0.001), 16.4 on 12 January (P = 0.05) and 18.4 by 22 January 2006 (P < 0.05). This showed that as L. majuscula biomass decreases, the nitrogen in the L. majuscula tissue was lost faster than the total carbon. A contributing aspect to the higher C: N ratios from the latter part of the decline phase may have been that any small amounts of carbonate present are likely to have degraded slower than the organic carbon material.
The event mean N : P ratio (Fig. 8b) was relatively constant (66–72) during the incipient phase with a slight but not significant (P > 0.05) decrease during the rapid growth stage to 60. There was a significant decrease in the N : P ratio during the plateau phase from 60 to 45 (10 December to 20 December) when event biomass density was highest. After the 29 December in the declining phase, the N : P ratio significantly (P < 0.05) decreased with decreasing biomass to 34 on 6 January 2006, and 26 on 12 January 2006. This showed that as L. majuscula biomass decreases, the nitrogen in the L. majuscula tissue was lost faster than the phosphorus.
The event mean C : P ratio (Fig. 8c) was relatively constant during the incipient phase (635–690). From the beginning of the rapid growth phase (26 November), there was a trend (though variable) for the C : P ratios to decrease over time. However, this was not as pronounced as the N : P trend (Fig. 8b), owing to larger variability in the C : P ratios, especially during the earlier (29 October 2005) and later samplings (12 and 22 January 2006) when sample sizes were smaller. There was a significant (P < 0.001) difference between the maximum mean C : P ratio of 690 on the 15 November and the lowest mean C : P ratio of 415 on 12 January 2006.
The event mean C : Fe ratio (Fig. 8d) was relatively constant during most of the incipient phase (136–150), but had increased to a maximum ratio of 188 by the beginning of the rapid growth phase on 26 November. Following this date, there was a general decrease in the ratio during the rapid growth and plateau phases as biomass density increased. The C : Fe ratio continued to substantially decrease during the declining phase to a minimum of 66.
The atomic ratios for the L. majuscula tissue (Fig. 8) collectively showed that during the declining phase of the bloom, tissue nitrogen is lost relatively faster than total carbon, phosphorus and iron. The loss of tissue total carbon is of the same order as phosphorus (or a little faster), while iron loss from the tissue is slower than the other three elements. That is, the order of loss is N > C ≥ P > Fe, which probably reflects the relative biodegradability of these nutrients in the marine environment.
Total biomass and nutrients
The total L. majuscula biomass (both wet weight and oven-dried) for the 10 sampling events in 2005–2006 (Table 2) was calculated using a three-dimensional model. At the beginning of the L. majuscula appearance on 29 October 2005, the total biomass was calculated at 40 tww. Over the next month (incipient phase), the total biomass generally increased to reach 535 tww on 26 November. After this, there was an almost 10-fold increase in total biomass corresponding with the rapid growth phase, with the highest total biomass (5057 tww) present on 10 December. During the plateau phase, the total biomass dropped slightly (6%) to 4760 tww on 20 December, probably as a result of the corresponding decrease in areal extent (Table 2). Following this, the total biomass continued to decline; it more than halved (1983 t ww) in the 9 days from 20 December to 29 December, crashed to 139 t ww by 6 January 2006 and had almost disappeared (2 tww) by 22 January.
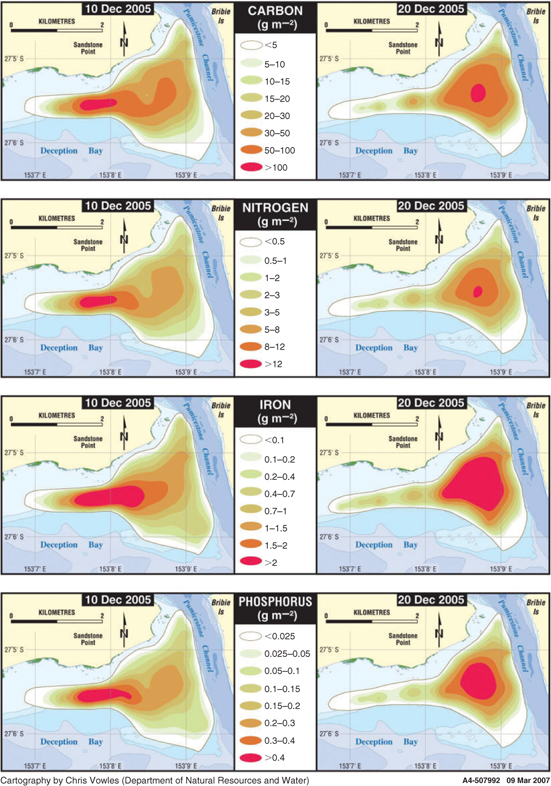
The total nutrients in the L. majuscula biomass for 10 sampling events (Table 2) were calculated using a similar three-dimensional model as for biomass. Temporal patterns in total carbon, nitrogen, phosphorus and iron were largely dictated by the biomass and therefore followed a similar pattern to the total biomass (Table 2). Other factors such as the change in tissue nutrient content over the phases of the bloom (Fig. 7) and the total area impacted (Table 2), also contributed to the observed patterns in total nutrient content. The maximum total carbon (150 000 kg), nitrogen (18 000 kg) and phosphorus (720 kg) corresponded to the maximum total biomass on 10 December (Table 2). However, the maximum total iron content (5200 kg) was not reached until 20 December, and the mean iron content also did not peak until 20 December (Fig. 7d). Figure 9 shows the variation in nutrient density for the four main nutrients (total carbon, nitrogen, phosphorus and iron) for the two samplings in the plateau phase (10 and 20 December). The maximum density shift from the south-eastern part of the bloom on 10 December to the north-western part by 20 December could be seen in all nutrients, but was particularly noticeable for iron.
|
Abiotic environmental conditions
Over the period 22 October–6 February 2006 (summer months), minimum air temperatures were 14–25°C and maximum air temperatures 25–35°C. Water temperatures (Fig. 10a) at the permanent monitoring station on the deeper edge of study area generally increased from 23.5°C (October) to 30.8°C (end of December). However, during sampling we found that temperatures in the shallower waters were often 0.5–2.0°C higher, especially on calm, hot and sunny days. The maximum water temperature recorded during sampling was 32.4°C in ~0.4 m of water at low tide, where L. majuscula covered 100% of the seagrass and had a site mean biomass of 503 gdw m–2 (10 December 2006).
|
The region received 86 mm of rain over 4 days (14–17 October 2006) in the two weeks before the first observed occurrence of L. majuscula on 29 October 2006. Although there were no large runoff events in the following three months, a total of 450 mm of rain was received in small events. Rainfall events (total of 156 mm) were observed at the end of the incipient phase and in the early stages of the rapid growth phase (24 November–3 December), and during the declining phase in January (Fig. 10c). Periods of prolonged high-incident light were recorded in mid November, early December, mid to late December and mid January (Fig. 10b).
During the period monitored, the dissolved nitrogen and iron concentrations of the seawater at the study site (collected at low tide on three separate occasions at up to three different sites within study area) were below the detection limit of the laboratory methods used: NH4-N < 0.007 mg L–1, NOx-N < 0.002 mg L–1 and iron < 0.05 mg L–1. The concentration range of other nutrients included PO4-P < 0.003–0.01 mg L–1; dissolved organic carbon < 1–4 mg L–1; molybdenum 0.05–0.09 mg L–1; Kjeldahl nitrogen 0.26 to 0.43 mg L–1 and Kjeldahl phosphorus < 0.01–0.07 mg L–1.
The range of the means (±s.e.) for total carbon, nitrogen, phosphorus and iron content of the sediment at four sites across the study area (sampled on 3–4 occasions at each site) were: total carbon 0.18 ± 0.009 to 0.37 ± 0.066% C (comprising inorganic carbon 0.030 ± 0.000 to 0.033 ± 0.002% C and organic carbon 0.16 ± 0.010 to 0.34 ± 0.027% C), total nitrogen < 0.03 to 0.05 ± 0.003% N, total phosphorus 0.003 ± 0.0002 to 0.007 ± 0.0009% P and total iron 0.23 ± 0.05 to 0.07 ± 0.009% Fe. The extractable phosphorus and iron values of sediment varied as follows: extractable phosphorus 10.9 ± 1.00 to 13.4 ± 0.51 mg kg–1 P and extractable iron 21.2 ± 1.38 to 51.5 ± 5.42 mg kg–1 Fe.
Discussion
The results of the current study showed that L. majuscula can spread and generate massive amounts of biomass very rapidly. At the peak of the bloom, 529 ha of the seagrass–algae beds in Deception Bay (2005–2006) were partially or totally covered by L. majuscula. At this time a total of 5057 t of L. majuscula biomass was calculated to be present within this area, containing an estimated 150 000 kg of carbon, 18 000 kg of nitrogen, 720 kg of phosphorus and 5200 kg of iron. Such quantities of nutrients, and the sometimes toxic L. majuscula material, have considerable unfavourable environmental, economic, health and social consequences.
Areal extent and biomass
During the 2005–2006 bloom at Deception Bay, L. majuscula expanded from two small areas (Fig. 5) on 29 October (totalling 49 ha and mean density of 7.9 gdw m–2), to cover 529 ha by 10 December with a mean density across the bloom of 97 gdw m–2 and a maximum density of 503 gdw m–2 recorded in the eastern area. This was calculated to have a total biomass of 5057 t. During the fourteen-day rapid growth phase (from 26 November to 10 December) the area increased by an average of 12.6 ha day–1 and the total biomass increased 10-fold (535–5057 t, at an average rate of 302 t day–1). The biomass density and areal extent recorded at the peak of the 2005–2006 bloom are less than, but within a similar order of magnitude as, the data recorded by Watkinson et al. (2005) for a bloom at Deception Bay in 1999–2000. At the peak of the 1999–2000 bloom (5 March 2000), the areal extent was 1.5 times (800 ha) that of the current study, whereas the mean biomass (210 gdw m–2) and highest individual site biomass (1181 gdw m–2) were 1.7 and 2.4 times higher (Watkinson et al. 2005). L. majuscula biomass has not been measured during blooms in other years at Deception Bay so no other data were available for comparison. However, a L. majuscula density up to 600 gdw m–2 was recorded on shallow seagrass beds in Puerto Rico during 1998–2000 (Stielow and Ballantine 2003), suggesting that blooms the size of the 2005–2006 Deception Bay episode occur elsewhere in the world.
The overriding growth pattern in this study mirrored that described by O’Neil and Dennison (2005). Albert et al. (2005) and Watkinson et al. (2005), whereby the L. majuscula initially established itself, expanded rapidly, peaked and then rapidly declined. However, the current study found that there was considerable complexity in the spatial and temporal patterns within the main bloom area. First, minor expansion and/or contraction of areas were sometimes observed between sampling events. For example, between 9 and 15 November, instead of increasing with time, the area and biomass density decreased and hence total biomass declined from 240 to 100 t. In the early stages of L. majuscula growth, this possibly reflects changes to the environmental conditions affecting benthic light, water temperature, nutrient availability (slowing growth) and/or the ability of L. majuscula to remain attached to the benthos during rough weather (leading to biomass being washed away).
Additionally, different areas within the main bloom were observed to expand, peak and/or begin declining at different rates, particularly where high biomass densities occurred. This suggests that environmental conditions are variable across the bloom area. For example, on 10 December, high densities (>300 gdw m–2) were recorded in the eastern part of the bloom (Fig. 5), but densities in this region had decreased by 20 December. The appreciable decrease of L. majuscula biomass was likely a result of rafting, as dense mats of L. majuscula were observed lifting away from the sediment and forming rafts in this area during sampling on 10 December. This sampling date was followed by consecutive days of hot, sunny weather resulting in higher light and water temperatures (Fig. 10a, b), which are conducive to high rates of photosynthesis (with the formation of oxygen bubbles) and subsequent rafting. In contrast, the L. majuscula density in the western area increased between 10 and 20 December. Possible explanations for this include: different L. majuscula maturity stages between the south-eastern and north-western areas; an input of nutrients from the nearby Pumicestone Channel allowing greater biomass production in this area, or localised favourable environmental conditions promoting rapid growth. For example, it has been observed that following rainfall, the north-western area often experiences an input of nutrients and low water clarity from the adjacent Pumicestone Passage, but when the waters clear, benthic light penetration improves substantially, providing conditions conducive to rapid growth. Catchment modelling shows that phosphorus, nitrogen, iron and suspended materials are transported to the bloom area from Pumicestone Channel, particularly to the north-western area of the bloom, following runoff rainfall events (A. McAlister, pers. comm.). Fluctuations of L. majuscula biomass attributed to weather have also been observed by Stielow and Ballantine (2003) for inshore seagrass habitats of Puerto Rico.
The calculated total biomass in Table 2 is likely to be a conservative estimate owing to the large amount of L. majuscula lost from the sampling area through floating rafts (especially during the plateau phase). On hot and calm days, L. majuscula has been observed to float to the water surface (as a result of oxygen bubbles becoming trapped within the filament matrix from high rates of photosynthesis under high light conditions) and form large floating rafts that disperse with prevailing winds and currents onto surrounding shorelines (O’Neil and Dennison 2005; Watkinson et al. 2005). As this often corresponds with L. majuscula being at its rapid growth or plateau phases, these rafts can be very extensive. In severe bloom years at Deception Bay (e.g. 1996–1997, 1997–1998, 1999–2000), fishermen have observed floating rafts ‘the size of a tennis court’ (i.e. ~500 m–2) (Buchanan Heritage Services 2003). Although this phenomenon has been described in several studies in Moreton Bay (Dennison et al. 1999) and witnessed by researchers and locals working and recreating in the area (Buchanan Heritage Services 2003), the amount of biomass lost in floating rafts and washed elsewhere has not been measured. The loss of L. majuscula biomass through floating rafts and rapid regrowth is likely to have led to biomass loss between sampling events. L. majuscula has been observed to grow rapidly and return to its original biomass within a week when the biomass was lost to rafts. Thus, the calculated total tonnage of L. majuscula at the bloom peak in the present study (5057 t) is certain to be an underestimate of the total biomass produced during the current bloom. This factor is an important consideration given that the total biomass values calculated in the present study are expected to be used for calibration of models developed to aid understanding and prediction of L. majuscula bloom occurrences in Deception Bay.
Tissue nutrient content and changes
At the plateau of the bloom, the biomass was calculated to contain 150 000 kg of carbon, 18 000 kg of nitrogen, 720 kg of phosphorus and 5200 kg of iron. During the rapid growth phase (from 26 November to 10 December), the average daily nutrient increase was 8867 kg C day–1, 1067 kg N day–1, 44 kg P day–1 and 387 kg Fe day–1. The tissue nutrient values (23.3% C, 2.0% N and 0.99% Fe) recorded in the 1999–2000 bloom (Watkinson et al. 2005) are comparable to the range of total carbon (25.1–29.4% C; 23–27.1% C adjusted for carbonate), nitrogen (2.8–3.5% N) and iron (0.87–1.1% Fe) contents encountered in the current study before decay (Fig. 7a, b, c). However, phosphorus contents recorded by Watkinson et al. (2005) in the 1999–2000 bloom (0.32% P) were more than double that recorded in the current study (0.11–0.14% P). Although phosphorus is traditionally regarded as a macronutrient and iron a trace element, the iron contents of the L. majuscula tissue were much higher than the phosphorus contents, suggesting high iron requirements of L. majuscula.
Several factors are likely to influence the nutrient content of L. majuscula, including the availability of nutrients and the phase and/or health of the bloom. Increased inputs of nutrients resulted in higher L. majuscula tissue nutrient contents in a field enrichment experiment in Deception Bay, with up to 28.4% C and 3.4% N recorded in the [N+P+FeEDTA] nutrient treatment (Ahern et al. in press). Even higher nitrogen values (up to 4% N) were recorded in nutrient treatments [P+FeEDTA] during another field experiment in the higher light environment of eastern Moreton Bay, suggesting that nitrogen-fixation is an important source of nitrogen for L. majuscula (Ahern et al. 2007). Additionally, results of the present study show the stage of the bloom affects nutrient content, as there was a distinct temporal pattern in total carbon, nitrogen and phosphorus contents (Fig. 7a, b, c) over the bloom cycle. High values were recorded during the incipient and rapid growth stages of the bloom, when L. majuscula was black/dark brown in colour and showed no signs of decay. During the plateau phase, the total carbon and nitrogen contents started to decrease as the biomass density reached a maximum, whereas phosphorus and iron increased to maximum values. However, during the declining phase, all tissue nutrient contents decreased, usually rapidly as decay set in (Fig. 7a, b, c). This was likely to be a result of cell lysis caused by high rates of natural cell death and/or viral infection (Ohki 1999; Berman-Frank et al. 2004). The drop in total carbon, nitrogen and phosphorus content was reflected in visual symptoms such as chlorosis (a loss of accessory phycobilin pigments). Additionally, during the declining phase of the bloom, the nutrients were lost at different rates from the L. majuscula tissue (i.e. N > C ≥ P > Fe), which may reflect differences in the relative biodegradability of these nutrients in the marine environment, or the location of the nutrients within the cell (e.g. cell or cell wall). Nitrogen, which was lost fastest, is highly biodegradabile and, given that the Deception Bay area has been documented as a nitrogen-limited system (O’Donohue and Dennison 1997; Udy and Dennison 1997), other organisms are likely to quickly utilise any nitrogen released as the L. majuscula biomass decays.
Although very limited data are available on the stoichiometry or range of elemental ratios for L. majuscula and other benthic marine nitrogen-fixing cyanobacteria, comparison to critical values developed for phytoplankton (Redfield et al. 1963; Hecky et al. 1993), freshwater periphyton (Kahlert 1998) and marine microalgae (Hillebrand and Sommer 1999) can provide some insight into the physiology and nutritional status of L. majuscula. The C : N ratio of L. majuscula in the current study was relatively consistent (9.8–10.5; 9.4–10 adjusted for carbonate) and had very low standard errors during the incipient, rapid growth and plateau phases of the bloom (Fig. 8a). These ratios were at the higher end of the optimum range (5–10) for marine microalgae (Hillebrand and Sommer 1999) and much higher than the Redfield stoichiometry (6.6) for unicellular phytoplankton (Redfield et al. 1963), or for the optimum ratio (8.8) for freshwater periphyton (Kahlert 1998). The higher C : N ratios of L. majuscula recorded in the current study are consistent with data from previous studies in Deception Bay: 9.8–10.4 in 2005–2006 (Ahern et al. in press) and 12.8 in 1999–2000 (Watkinson et al. 2005) and in eastern Moreton Bay (8.8–9.4; Ahern et al. 2007). L. majuscula sampled from other locations around the world also had C : N values higher than the Redfield ratio, with ratios of 8.0 and 9.4 (which included adjustment for carbonate) recorded for L. majuscula from Enewetak and Hawaii respectively (Atkinson and Smith 1983) (Table 4). Although background data on nutrient content and ratios for L. majuscula are limited, data to date suggest that the higher C : N ratios recorded in the current study are within the norm for L. majuscula during active growth. A possible reason for the high C : N ratios observed in L. majuscula is the presence of a thick cell wall (Atkinson and Smith 1983), suggesting that structural high-cellulose-content carbohydrates are accounting for a higher proportion of cell mass in L. majuscula cells (Geider and La Roche 2002).
The range of N : P ratios (26–72; Fig. 8b) in the current study are similar to ratios (46–51) reported from Deception Bay in 2005–2006 (Ahern et al. in press) but are higher than the ratio (14) reported for Deception Bay in 1999–2000 (Watkinson et al. 2005) and the Eastern Banks (16.4–22.4) (Ahern et al. 2007). The N : P ratios reported in the present study, particularly during the incipient, rapid growth and plateau phases (47–72), were substantially higher than the various optimum N : P ranges published in the literature, including optimum ratios for unicellular phytoplankton (16) (Redfield et al. 1963), freshwater periphyton (18) (Hecky et al. 1993), medium ratio (30) for benthic plants (Atkinson and Smith 1983) and the optimum range (13–22) for benthic microalgae (Hillebrand and Sommer 1999). The higher N : P ratios recorded in the present study are not unusual for nitrogen-fixing species, which have often been documented as having higher N : P stoichiometry than non-diazotrophic species (Table 4). For example, the marine nitrogen-fixing cyanobacterium Trichodesmium has N : P ratios ranging from 42 to 125 (Letelier and Karl 1996), which is more comparable to ratios found in the present study. One obvious explanation for higher N : P ratios in nitrogen-fixing species is that autotrophs are able to fix nitrogen from the atmosphere, potentially allowing accumulation of nutrient reserves (Geider and La Roche 2002). Another reason hypothesised by Klausmeier et al. (2004) is that the energetically costly process of nitrogen-fixation leads to less carbon being incorporated per unit of light energy absorbed. This leads to an increase in allocation to light-harvesting proteins and chloroplasts that are rich in nitrogen and poor in phosphorus, and a decrease in allocation to assembly machinery (ribosomes) which have an N : P ratio closer to the Redfield ratio. Therefore, Klausmeier et al. (2004) hypothesised that autotrophs have higher N : P ratios because they need more light harvesting machinery to power nitrogen-fixation at the expense of phosphorus-rich assembly machinery. Another contributing factor to the high N : P ratios in the present study may be the fact that L. majuscula growth in Deception Bay (during this bloom) was demonstrated to be phosphorus limited by in situ nutrient addition experiments (Ahern et al. in press).
The high C : P and N : P ratios of L. majuscula in the current study support the contention experienced in earlier studies (Elmetri and Bell 2004; Albert et al. 2005; Ahern et al. in press) that L. majuscula growth rates in Deception Bay are influenced by phosphorus availability. The C : P ratios (415–691; 396–660 adjusted for carbonate) and N : P ratios (26–72) in the present study (Fig. 8b, c), are within the commonly quoted ranges for phosphorus limitation of benthic marine microalgae (C : P > 180 and N : P > 22; Hillebrand and Sommer 1999), freshwater periphyton (C : P > 369 and N : P > 32; Kahlert 1998) and severe phosphorus limitation of phytoplankton (C : P > 258, N : P > 22) (Hecky et al. 1993). Thus, the high C : P ratios (combined with high N : P ratios and low phosphorus contents) of L. majuscula in the present study strongly support phosphorus limitation of L. majuscula in Deception Bay. Phosphorus has been shown to stimulate filament growth (Elmetri and Bell 2004; Ahern et al. 2007), biomass growth (Ahern et al. 2007) and nitrogen-fixation rates (Elmetri and Bell 2004; O’Neil et al. 2004) of L. majuscula in the laboratory and to substantially increase biomass in field experiments at two locations in Moreton Bay: Eastern Banks (Ahern et al. 2007) and Deception Bay (Ahern et al. in press).
In the current study, the atomic C : Fe ratios (119–188; 114–180 adjusted for carbonate) for L. majuscula before decay (Fig. 8d) were similar to the C : Fe ratios reported for L. majuscula in other studies in Deception Bay: 99.4 in 1999–2000 (Watkinson et al. 2005) and 131–148 in 2005–2006 (Ahern et al. in press). All these values were within the range or slightly higher than the C : Fe ratios for the marine diazotrophs cyanoabacterium Trichodesmuim (commonly C : Fe ratios between 20–125 in culture) (La Roche and Breitbarth 2005). However, L. majuscula in Eastern Moreton Bay had much higher C : Fe ratios (252–262) than the L. majuscula from Deception Bay (which is geographically closer to iron and organic sources than Eastern Moreton Bay) and more within the range recorded for non-diazotrophs such as diatoms (143–1000) (Sunda and Huntsman 1997). L. majuscula laboratory bioassay responses to added iron (Gross and Martin 1996; Ahern et al. 2006a, 2007) and field experiments at the Eastern Banks (Ahern et al. 2007) and Deception Bay (Ahern et al. in press), together with high C : Fe ratios in the current study, suggest that iron (together with phosphorus) limit biomass production in Moreton Bay.
Comparison of bloom to other years
Table 3 was compiled from all available historical records and interviews with local fisherman in order to compare findings of the current study to L. majuscula blooms in previous years at Deception Bay. There has been considerable variability in the extent, timing and duration of L. majuscula blooms in Deception Bay.

|

|
Different growth phases during the bloom
Annual ephemeral blooms of L. majuscula in Deception Bay appear to cycle through a series of distinct growth phases (Albert et al. 2005; O’Neil and Dennison 2005) and were recorded and described in detail in the present study (Fig. 6). O’Neil and Dennison (2005) suggest that blooms appear to originate from the sediment, where microscopic cells (hormogonia) may be able to persist. In the present study, L. majuscula was first observed growing as a thin benthic mat closely associated with the sediment (Fig. 6a) and also attached to leaves of the seagrasses Zostera muelleri and Syringodium isoetifolium (Fig. 6b). Growth continued to form dark-brown/black tufts at the base of the seagrass and macroalgae canopy (Fig. 6c), which eventually expanded to form benthic mats (Fig. 6d). In some locations, especially at the peak of the bloom, the mats covered up to 100% of the benthos (Fig. 6e), blanketing the benthic community and causing anoxic conditions (Watkinson et al. 2005). In one of the most severe blooms at Deception Bay in 1997–1998, L. majuscula was reported to cover more than 50% of the benthos for six months of the year (Buchanan Heritage Services 2003). As observed in the current study and described by O’Neil and Dennison (2005) and Albert et al. (2005), the L. majuscula and other tangled benthos can detach from the sediments forming floating rafts (Fig. 6f) that disperse onto surrounding shorelines (Fig. 6g), requiring costly removal by local government.
After the period of massive growth and areal expansion in the current study, the L. majuscula biomass underwent a rapid collapse (Table 2, Figs 4, 5), losing its brown pigmentation (accessory phycobilin pigments, particularly phycoerythrin) to become a very light brown/cream colour (Figs 4, 6). The L. majuscula was present as thin wisps attached epiphytically to the tops of the seagrass leaves or accumulated into large decomposing masses (Fig. 6h). Similar observations, such as chlorosis, lack of photosynthesis and the colonisation of L. majuscula by heterotrophic bacteria, were described during the decline of the bloom at Deception Bay in 1999–2000 (Hewson et al. 2001; Watkinson et al. 2005). There was also a substantial and significant decline in the total carbon, nitrogen and phosphorus content of the L. majuscula tissue (and to a lesser extent iron) observed in the current study associated with the decline and biomass collapse (Fig. 7).
Duration and timing of blooms
In the current study, L. majuscula was present for 3.5 months, which is comparable to some years but shorter than the duration of many blooms in Deception Bay over the last decade (Table 3). In one of the severe blooms in 1997–1998, L. majuscula was observed to persist for ~10 months (Table 3). Over the last decade, blooms of L. majuscula have typically started in late spring or summer (November–January) (Table 3; O’Neil and Dennison 2005) as was the case in the current study when L. majuscula growth was first detected in late October. It is well documented that freshwater, estuarine and coastal cyanobacteria blooms are most common when warm, calm and stratified conditions occur after rainfall events add nutrients (see review in Paerl 1988). Furthermore, Watkinson et al. (2005) observed the onset of L. majuscula growth at Deception Bay in the 1999–2000 bloom to occur after a rainfall event that was followed by periods of high temperature and benthic light. In the current study, a rainfall event (86 mm of rain in 4 days in mid-October) preceded the first observed growth of L. majuscula in late October, with higher water temperatures and light (Fig. 10a, b) occurring during the incipient phases in November. After an initial period of establishment, L. majuscula biomass generally expands rapidly over a 2–3-month period (Albert et al. 2005) and commonly reaches high biomass in summer (December–February) (Table 3). Occasionally the bloom extends into March or even April (Table 3).
The rapid decay of L. majuscula biomass observed in the current study (Table 2, Fig. 4), has commonly been reported in Deception Bay over the last decade (Albert et al. 2005; O’Neil and Dennison 2005). The extensive bloom at Deception Bay in 1999–2000 was documented to have collapsed within 7 days (Hewson et al. 2001; Watkinson et al. 2005). Hewson et al. (2001) suggests that the rapid decline of blooms in Deception Bay may be associated with a virus specific to L. majuscula. Additionally, specialist herbivores such as seahares (e.g. Stylaccylius sp.), consume large amounts of L. majuscula in short periods of time (Capper et al. 2005). Copepods (Metis sp.), which were observed in large numbers during the declining phase in the current study, are also likely to contribute to the rapid decline (Lawn 2002). White heterotrophic bacteria, probably Beggiatoa spp. as found by Hewson et al. (2001) in the 1999–2000 bloom, were also observed growing on the surface of the decaying masses in the current study, and are likely to exacerbate rapid decay (Hewson et al. 2001).
Environmental and social impacts
Although the duration of the current bloom (3.5 months) was not as long as some of the previous blooms, the repeated reduction in light to seagrass habitats during the summer months each year is likely to impact on the health of the seagrass meadows (Abal and Dennison 1996) and may have contributed to the observed decline in the health of seagrass beds in Northern Deception Bay over recent years (Buchanan Heritage Services 2003). Any effect of L. majuscula blooms on the health and fitness of the remaining Deception Bay seagrass beds is of considerable concern as these beds are the only appreciable coastal seagrass beds in Moreton Bay north of the Brisbane River (~30 km to the south). Additionally, when L. majuscula is present over large areas it becomes difficult for sea turtles and dugongs to avoid consuming it when grazing on seagrass, leading to malnutrition and associated problems (Arthur et al. 2006b). The unintentional consumption of toxic L. majuscula is detrimental to the health of both turtles and dugongs and has been linked to tumours (Fibropapilloma) causing death (Arthur et al. 2006a).
The actual mass of ‘L. majuscula-associated material’ smothering the benthos or washing ashore is usually much larger than the mass of cleaned and sorted L. majuscula that was calculated in the current study, because its hair-like structure traps substantial amounts of seagrass, algae and other marine plants, together with sand and silt. When rafts form, onshore winds or tidal currents can cause substantial material to wash onto beaches (Dennison et al. 1999). The resultant smell and toxic aerosols emanating from drying and rotting L. majuscula is a concern to residents, tourists and local governments. This, together with the sometimes toxic effects of L. majuscula on bathers (Osborne et al. 2001), causes the closure of beaches (commonly in holiday season) causing economic impact on local businesses. Each year extensive and costly clean-up operations on beaches are undertaken with the cost of removing L. majuscula from some of the worst-affected beaches in 2003–2007 exceeding AUD725 000 (Caboolture City Council unpubl. data).
Nitrogen input, through nitrogen fixation followed by death and decay of the large cyanobacterial biomass, may also have a significant localised effect on nutrient cycling and trophodynamics in Deception Bay (O’Neil and Dennison 2005). High rates of nitrogen-fixation (0.09–1.24 µM g–1 h–1) have been recorded for L. majuscula from Deception Bay (O’Neil et al. 2004). The ability of L. majuscula to fix nitrogen appears to be important for rapid bloom formation (Ahern et al. 2007, in press), particularly as nitrogen has been documented to limit phytoplankton, seagrass and macroalgae growth in Deception Bay (O’Donohue and Dennison 1997; Udy and Dennison 1997). During the peak periods of the 1999–2000 bloom in Deception Bay, nitrogen input through nitrogen-fixation was calculated at 1.14 mg N m–2 h–1 (O’Neil et al. 2004). Thus, the addition of fixed nitrogen into a naturally low nitrogen system as the bloom decays may alter the species balance of the local environment. In Moreton Bay, management strategies in recent years have focussed on reducing nitrogen loadings to the Bay (particularly from point sources), to improve water quality. For example, over the period 1997–2005, AUD300 million was spent by state/local governments and major industries with the objective of reducing effluent discharges into Moreton Bay waterways, upgrading sewage treatment plants and wastewater recycling projects, with the aim of achieving a major reduction of nitrogen loads into Moreton Bay. Thus, blooms of nitrogen-fixing L. majuscula act against these expensive management initiatives to lower nitrogen levels within Moreton Bay.
Implications for management
Nuisance blooms of benthic cyanobacteria, including L. majuscula, appear to be becoming more widespread and abundant in some tropical and subtropical environments across the world (Diaz et al. 1990; Dennison and Abal 1999). In Moreton Bay, south-east Queensland blooms of L. majuscula appear to have been larger and more frequent in the present decade (1996–2006) compared with previous decades (Table 3; Buchanan Heritage Services 2003). In the current study, a bloom of L. majuscula covered 529 ha of the Deception Bay seagrass–algae beds and was conservatively estimated to contain more than 5057 t of L. majuscula. The current bloom was smaller than some blooms in Deception Bay over the last decade. For example, in the 1999–2000 bloom (Watkinson et al. 2005), L. majuscula covered 50% more area and had 70% higher mean biomass density than the current study, likely resulting in a total biomass at least double (~10 000 t) that of the current study. Blooms in the 1996 to 1999 period were also large (Table 3). Anecdotal evidence from fisherman suggest that the biomass density during these years was similar to or greater than the 1999–2000 bloom, so total biomass is likely to have been even greater during these years.
Current scientific knowledge strongly suggests that the size and extent of L. majuscula blooms in Moreton Bay are linked to short and/or long-term nutrient inputs, coinciding with favourable weather, light and water conditions. Field studies in eastern Moreton Bay (Ahern et al. 2007) and Deception Bay (Ahern et al. in press), have shown that adding key nutrients (iron, phosphorus and nitrogen) into the water column can strongly influence the intensity and severity of blooms. An in situ enrichment experiment (Ahern et al. in press), conducted within the current study area and at a similar time (November–December 2005), demonstrated that there was a highly significant and substantial difference in the final biomass between the control (54 gdw m–2 and <5% cover) and the combined nutrient treatment (982 gdw m–2 and 100% cover). The biomass density of the nutrient treatment was comparable to the maximum density (1181 gdw m–2) recorded during the more severe bloom of 1999–2000 (Watkinson et al. 2005). Thus, nutrients can increase the severity of a L. majuscula bloom (if other environmental conditions are favourable for growth), suggesting that if nutrient inputs continue to increase then blooms are likely to be larger and the impacts more severe in future years.
The precautionary principle would suggest that activities in the catchment should be carefully managed to limit or reduce the supply and transport of nutrients of concern to waterways and coastal waters where they may increase the severity and intensity of L. majuscula blooms. A new Harmful Algal Bloom Policy in the South-east Queensland Regional Coastal Management Plan (EPA 2006) has recently been adopted requiring development to avoid or minimise the release of ‘nutrients of concern’ to the coastal waters of Moreton Bay. Findings from the current study provide further evidence to support industry and community adoption of this policy, and will contribute data into models and management practices aimed at limiting the export of key nutrients shown to increase L. majuscula growth.
Conclusion
The results of modelling and extensive biomass sampling in Deception Bay show that L. majuscula can spread and generate massive biomass at a rapid rate, given favourable environmental conditions. At the peak, the L. majuscula bloom covered 529 ha and had an overall mean density of 97 gdw m–2, and a maximum mean density at one site of 503 gdw m–2. The peak of the bloom conservatively contained 5057 t of L. majuscula. The map sequence and individual site data show that L. majuscula biomass density peaks and wanes at different times and locations within the bloom area.
During the incipient and rapid growth phases of the bloom, the total carbon, nitrogen, phosphorus and iron content of L. majuscula tissue generally increased or remained relatively constant until the peak of the bloom. The tissue total carbon, nitrogen and phosphorus contents rapidly and significantly reduced as the bloom declined and disintegrated. The lower nutrient content of the tissue as the biomass decreased was also reflected in visual symptoms such as chlorosis and the onset of obvious decay. The peak of the bloom contained 150 000 kg C; 18 000 kg N; 720 kg P and 5200 kg Fe. The nutrient maps for the two peak sampling dates (10 and 20 December 2005) showed that nutrient densities peak at different times and locations, with their pattern being dominated by the biomass density.
There are environmental concerns over the shading/smothering effects of L. majuscula on seagrass and other biota, together with nutrient relocation and additional atmospheric nitrogen input into a nitrogen limited system. Other research in Moreton Bay has shown that the addition of nutrients can result in significant L. majuscula biomass increases. Therefore, management practices need to limit short and long-term nutrient input into Moreton Bay, otherwise larger, more destructive blooms are likely to occur.
Acknowledgements
The first author is in receipt of a University of Queensland (UQ) scholarship and Queensland Government Smart State funding. Some financial assistance was provided by South East Queensland Healthy Waterways Partnership. We acknowledge C. Vowles of Queensland Department of Natural Resources and Water (NRW) for providing dedicated GIS support, calculating areas of L. majuscula and conducting three dimensional modelling of total biomass and nutrients. G. Wobke, D. Lyons, S. Mork, L. McCullum and staff from Natural Resources Sciences Chemistry Centre, NRW undertook L. majuscula tissue, sediment and water analyses. V. Ahern assisted with cleaning, sorting and weighing L. majuscula. For helpful comments on the manuscript we acknowledge A. McElnea, B. Powell, V. Eldershaw (NRW), A. Watkinson (UQ) and P. and M. Ganley. For general support or assistance we also thank J. Savige (Savige Fisheries), M. Tanner (Commercial Fisherman), G. Shaw (Griffith University), C. Lovelock (UQ) and N. Moore (Queensland Environmental Protection Agency (EPA)). The authors acknowledge the EPA, Water Sciences Unit and Queensland Bureau of Meteorology for providing the environmental data, Queensland Department of Primary Industries and Fisheries for water temperature data and Maritime Safety Queensland for bathymetry data.
Abal, E. , and Dennison, W. C. (1996). Seagrass depth range and water quality in Moreton Bay, Queensland. Marine and Freshwater Research 47, 763–771.
| Crossref | GoogleScholarGoogle Scholar |
Arthur, K. , Shaw, G. , Limpus, C. , and Udy, J. W. (2006a). A review of the potential role of tumour-promoting compunds produced by Lyngbya majuscula in marine turtle fibropapillomatosis. African Journal of Marine Science 2, 441–446.
Capper, A. , Tibbetts, I. R. , O’Neil, J. M. , and Shaw, G. R. (2005). The fate of Lyngbya majuscula toxins in three potential consumers. Journal of Chemical Ecology 31, 1595–1606.
| Crossref | GoogleScholarGoogle Scholar | PubMed |
Dennison, W. C. , O’Neil, J. M. , Duffy, E. J. , Oliver, P. E. , and Shaw, G. R. (1999). Blooms of the cyanobacterium Lyngbya majuscula in coastal waters of Queensland, Australia. Bulletin de l’Institut Oceanographique 19, 265–272.
Geider, R. J. , and La Roche, J. L. (2002). Redfield revisited: variability of C : N : P in marine microalgae and its biochemical basis. European Journal of Phycology 37, 1–17.
| Crossref | GoogleScholarGoogle Scholar |
Letelier, R. M. , and Karl, D. M. (1996). Role of Trichodesmium spp. in the productivity of the subtropical North Pacific Ocean. Marine Ecology Progress Series 133, 263–273.
| Crossref | GoogleScholarGoogle Scholar |
Ohki, K. (1999). A possible role of temperate phage in the regulation of Trichodesmium biomass. Bulletin de L’Institut Oceanographique 19, 287–292.
Paerl, H. W. , and Millie, D. F. (1996). Physiological ecology of toxic aquatic cyanobacteria. Phycologia 35, 160–167.
Roelfsema, C. M. , Phinn, S. R. , Dennison, W. C. , Dekker, A. G. , and Brando, V. E. (2006). Monitoring toxic cyanobacteria Lyngbya majuscula (Gomont) in Moreton Bay, Australia by integrating satellite image data and field mapping. Harmful Algae 5, 45–56.
| Crossref | GoogleScholarGoogle Scholar |

Sanudo-Wilhelmy, S. A. , Kustka, A. B. , Gobler, C. J. , Hutchins, D. A. , Yang, M. , Lwiza, K. , Burns, J. , Capone, D. G. , Raven, J. A. , and Carpenter, E. J. (2001). Phosphorus limitation of nitrogen fixation by Trichodesmium in the central Atlantic Ocean. Nature 41, 66–69.
| Crossref | GoogleScholarGoogle Scholar |
Stielow, S. , and Ballantine, D. L. (2003). Benthic cyanobacterial, Microcoleus lyngbyaceus, blooms in shallow, inshore Puerto Rican seagrass habitats, Caribbean Sea. Harmful Algae 2, 127–133.
Sunda, W. , and Huntsman, S. (1997). Interrelated influence of iron, light and cell size on marine phytoplankton growth. Nature 390, 389–392.
| Crossref | GoogleScholarGoogle Scholar |
Thacker, R. , and Paul, V. (2001). Are benthic cyanobacteria indicators of nutrient enrichment? Relationships between cyanobacterial abundance and environmental factors on the reef flats of Guam. Bulletin of Marine Science 69, 497–508.
Thacker, R. W. , Nagle, D. G. , and Paul, V. J. (1997). Effects of repeated exposures to marine cyanobacterial secondary metabolites on feeding by juvenile rabbitfish and parrotfish. Marine Ecology Progress Series 147, 21–29.
| Crossref | GoogleScholarGoogle Scholar |
Udy, J. W. , and Dennison, W. C. (1997). Growth and physiological responses of three seagrass species to elevated sediment nutrients in Moreton Bay, Australia. Journal of Experimental Marine Biology and Ecology 217, 253–277.
| Crossref | GoogleScholarGoogle Scholar |
Watkinson, A. , O’Neil, J. M. , and Dennison, W. C. (2005). Ecophysiology of the marine cyanobacterium Lyngbya majuscula (Oscillatoriacea). Harmful Algae 4, 697–715.
| Crossref | GoogleScholarGoogle Scholar |
Yeomans, J. C. , and Bremmer, J. M. (1991). Carbon and nitrogen analysis of soils by automated combustion techniques. Communications in Soil Science and Plant Analysis 22, 834–850.