

Warm-phase ENSO events modulate the continental freshwater input and the trophic state of sediments in a large South American estuary
F. García-Rodríguez A B , E. Brugnoli A , P. Muniz A , N. Venturini A , L. Burone A , M. Hutton A , M. Rodríguez A , A. Pita A , N. Kandratavicius A , L. Pérez A and J. Verocai AA Sección Oceanografía y Ecología Marina, Facultad de Ciencias, UdelaR, Iguá 4225, Montevideo (11400), Uruguay.
B Corresponding author. Email: felipegr@fcien.edu.uy
Marine and Freshwater Research 65(1) 1-11 https://doi.org/10.1071/MF13077
Submitted: 23 March 2013 Accepted: 28 May 2013 Published: 20 September 2013
Abstract
We studied the changes in geochemical variables in the middle section of Río de la Plata estuary during the 2009–2010 El Niño–Southern Oscillation (ENSO) event. Protein, organic matter, chlorophyll-a and phaeopigment content of surface sediments were significantly correlated with the increased continental freshwater input associated with high total monthly rainfall. During the warm-phase ENSO event, river flow was 5-fold larger than average historical levels, which led to a steady decrease in salinity values and the highest levels of geochemical variables. The evidence presented herein suggests that warm-phase ENSO events increase the trophic state of the sediments because of the increased freshwater input. Thus, our findings may be useful to anticipate potential eutrophication episodes in the study area.
Additional keywords: eutrophication, rainfall, river flow, estuaries, Uruguay.
Introduction
Information on background or modified trophic states is essential to understand the structure and function of aquatic systems. This concept was first introduced by Naumann (1919), to predict the phytoplankton biomass distribution in relation to nutrient concentration in lakes. He defined ‘oligotrophy’ as a state characterised by high transparency and low nutrient concentration, and ‘eutrophy’ as low transparency and high nutrient concentration. Since then, many researchers around the world have utilised and improved this concept by including other geochemical data than nutrients and by considering biological information as well (Scheffer 2009).
Eutrophication in estuaries has also been historically quantified following the classical freshwater nutrient approach (Cloern 2001; Bricker et al. 2003). However, the assessment of estuarine trophic states is more complex than in freshwater systems, because of salinity fluctuations associated with freshwater inputs. In this sense, although nutrients are the primary cause of eutrophication (Pinckney et al. 2001; Paerl 2006), there are also many other factors that determine the trophic classification of estuarine systems, such as anoxic conditions, presence of macrophytes, suspended solids and human impacts (Bricker et al. 2003; Scavia and Bricker 2006). Increases in inorganic nutrient concentration and algal biomass in the water column are usually used as indicators of the trophic state of estuarine ecosystems (Cloern 2001; Bricker et al. 2003, 2008). However, only a fraction of the total organic matter produced in the overlying water column reaches the sediment below. To compensate for this, the percentage of organic carbon on the bottom has been used as an alternative approach to assess the trophic status of sediments (Nixon 1995; Cloern 2001).
Particulate organic carbon resultant from phytoplankton primary production is the primary organic carbon in estuarine sediments; however, in human-impacted areas, additional organic carbon sources in the sediment have been detected (Muniz et al. 2002). Thus, in human-impacted regions, the organic carbon content may be inadequate for detecting the effects of sediment eutrophication (Dell’Anno et al. 2002; Pusceddu et al. 2009). The trophic state of the water column may differ from that of the sediments, because sediments integrate both spatial and temporal variability in phytoplankton production, instead of just reflecting conditions at the sampling time (Pusceddu et al. 2009). In addition, complex interactions of anthropogenic and climatic factors determine the magnitude of eutrophication. From a watershed perspective, nutrient-input reductions are the main option for alleviating the symptoms of eutrophication (Paerl 2006). Therefore, trophic assessments should help identify the principal factors leading to eutrophication and whether they are attributable to humans or reflect natural variation.
We assessed the eutrophication trends of the sediments in the coastal zone off Montevideo in the middle section of the Río de la Plata estuary, during the 2009–2010 ENSO event. We used several geochemical variables to trace changes in trophic conditions, and attributed them to human impacts (i.e. industry, urban collecting effluents, harbour activities), and also to the variability derived from the increased rainfall levels and associated river flow. Seasonal sampling was carried out from March 2009 to February 2011 with the following parameters determined: chlorophyll, phaeopigment, organic matter and protein content, dissolved oxygen, temperature and salinity. These parameters were then related to documented total monthly rainfall and associated changes in river flow.
Description of the study area
La Plata Basin
The Río de la Plata basin (Fig. 1), the second largest drainage basin in South America (4 144 000 km2), encompasses areas of south-eastern Bolivia, southern and central Brazil, Paraguay, most of Uruguay and northern Argentina. The main rivers of the La Plata basin are the Paraná, Paraguay and Uruguay (Fig. 1), which carry an estimated amount of 57 × 106 m3 year–1 of silt into the Río de la Plata. The modern suspension freight is ~80 × 106 t year–1, consisting of 75% coarse to medium silt, 15% fine silt and 10% clay (Giberto et al. 2004).

|
The mean annual flow of Río de la Plata is ~23 000 m3 s–1 (Farminán et al. 1999), which modulates the salinity distribution gradient of the inner continental shelf (Piola et al. 2000). The subtropical convergence area is broadly located over the shelf break and offshore between 32°S and 40°S and results from the mixing between the warm Brazil Current and the cold Malvinas Current flow (Calliari et al. 2009). Highly energetic mixing results in complex frontal systems and hydrographic structures such as eddies and meanders. The fluvial–estuarine waters are characterised by a high suspended particulate matter (SPM) loading, nitrogen : phosphorous ratios >25, moderate chlorophyll-a concentrations and the occurrence of cyanobacteria blooms (Nagy et al. 2002). Seaward of the salinity front, where both SPM and nutrient concentrations are lower and chlorophyll-a values higher, primary production is higher than respiration (Nagy et al. 2002; Calliari et al. 2009). Permanent stratification controls nutrient, organic matter and oxygen dynamics leading to biological stress and hypoxia below the halocline (Nagy et al. 2002) and assessment of the regional and overall ranking of trophic conditions indicates that the Río de la Plata is moderately eutrophic (Nagy et al. 2002).
Montevideo Bay and coastal zone
The Montevideo coastal zone (34°50′–34°56′S and 56°05′–56°25′W), located in the middle section of the Uruguayan river bank (Fig. 1), is classified as a coastal plain tidal river with a semi-enclosed shelf sea at the mouth. Salinity, halocline depth and vertical mixing vary with astronomic tidal oscillation on an hourly basis, while axial winds influence water height and salinity on a daily basis (Nagy et al. 1997). It is a very important recreational area, especially during the summer, as hundreds of thousands of people visit the beaches.
Montevideo Bay is ~10 km2. It harbours the National Oil Co., a thermoelectric plant and the harbour itself. Two main streams flow into it, the Miguelete and the Pantanoso. These streams contain wastes from many different industries, urban centres and from a large number of sewerage pipes. Modern sediments consist mainly of silt and clay fractions (Ayup 1986; Venturini et al. 2012). Predominant winds are NE and W–SW, which are very important in driving water circulation at shallow depths (Moresco and Dol 1996), which is mainly clock-wise.
Since around 2000, several research projects have been undertaken in the area (Gómez-Erache et al. 2001; Danulat et al. 2002; Muniz et al. 2002, 2004a; 2004b; Burone et al. 2006, 2011; Brugnoli et al. 2007; García-Rodríguez et al. 2010, 2011; Venturini et al. 2012). The inner part of Montevideo Bay has higher sediment heterogeneity, higher organic load and lower oxygen content than the outer part (i.e. Punta Carretas and Punta Yeguas) (Fig. 1). The inner part of Montevideo Bay is polluted with Cr, Pb and petroleum hydrocarbons, while the other zones show moderate pollution levels. Danulat et al. (2002) defined the Montevideo Harbour as a hypertrophic system, which receives considerable nutrients and organic loads. The water quality of Montevideo Bay is highly deteriorated because of several point and non-point sources and harbour activities that are a consequence of the historical development of the city (Gómez-Erache et al. 2001; García-Rodríguez et al. 2010).
Materials and methods
Thirty-six stations were sampled seasonally (n = 8) from March 2009 to February 2011 (Fig. 1). The sampling strategy was originally devised to assess the environmental quality of Montevideo coastal zone, before the construction of a sanitation system in its western sector, which will discharge the sewerage in the region of Punta Yeguas (see Fig. 1). Monitoring stations were located within Montevideo Bay, in the coastal zone, 200 m and 2000 m away from the shore, and labelled as ‘Z’ and ‘L’ respectively. In addition, two cross-shaped transects were located in Punta Carretas, where the collecting effluent pipeline currently discharges the sewerage, and in Punta Yeguas, where the future collecting effluent pipeline will discharge the sewage.
Bottom water temperature, salinity and dissolved oxygen were determined using a YSI multi-parameter device. Surface sediments were collected with a van Veen grab (three independent sampling units) for the analysis of protein content, photosynthetic pigments and organic matter. Samples were immediately placed in pre-combusted aluminum containers and stored frozen (–20°C) in the dark until laboratory analysis. Photosynthetic pigments were analysed within 24 h following Lorenzen (1967) and modified by Sünback (1983) for sediment samples. Proteins were measured within a week after sampling. Organic matter was determined by weight loss on ignition at 550°C (Heiri et al. 2001). Total protein (PRT) content was conducted following extraction with NaOH (0.5 M, 4 h) following the procedure of Hartree (1972) as modified by Rice (1982) to compensate for phenol interference. Blanks for each analysis were performed with pre-combusted sediments at 450–480°C for 4 h. PRT concentrations were expressed as bovine serum albumin (BSA) equivalents. All analyses were carried out in triplicate. River flow data were kindly provided by project GEF/URU-G07/32 (Bidegain et al. 2009) and SOHMA (Servicio de Oceanografía, Hidrografía y Meteorología de la Armada, Uruguay). Total monthly rainfall topographic maps were kindly provided by Unidad de Agroclima y Sistemas de Información of the Instituto Nacional de Investigación Agropecuaria (INIA), Uruguay. Topographic maps for the whole country were elaborated using the kriging method, which is a geostatistical gridding method to draw contour maps. Free rainfall maps are available from the website http://www.inia.org.uy/gras/agroclima/ppt_mapas/2009.html.
Multivariate exploratory data analysis was performed with the computer program CANOCO for windows ver. 4.5 (ter Braak and Šmilauer 1998). A Detrended Correpondence Analysis (DCA) was run for sediment and bottom water variables, whereby the resulting ordination diagram showed the main trends of the database. Then, a gradient analysis was performed in order to depict the environmental gradient (i.e. isolines) within the ordination diagram.
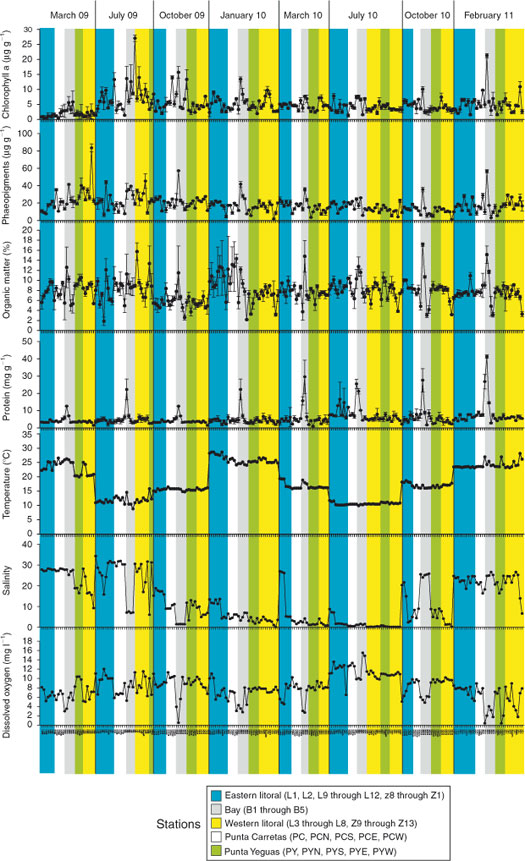
To test for differences between sampling sessions and stations, we performed several ANOSIM analyses. First, to test the hypothesis that warm ENSO events would enhance the trophic state, we performed an ANOSIM test for each sampling exercise as a group. We repeated this analyses three times; first for all the environmental variables together, then only bottom water variables and finally for sediment variables. The next step was to check for spatial differences, for the five different station groups as depicted with different colours in Fig. 1. Five groups were defined, i.e. Group 1 = Eastern littoral (L1, L2, L9 through L12, Z5, Z4, Z1), Group 2 = Punta Carretas (PC, PCN, PCS, PCE, PCW), Group 3 = Bay (B1 through B5), Group 4 = Western litoral (L3 through L8, Z9 through Z13), Group 5 = Punta Yeguas (PY, PYN, PYS, PYE, PYW). We first performed an ANOSIM for all stations together for all sampling sessions. Then, we performed ANOSIM analyses for each of the five groups separately, for all surveys. With such analyses, we aimed to test the potential effects of the warm ENSO event for the whole study area, and for the five different station groups separately.
In addition, the temporal variability for the whole study area was assessed by means of second-stage MDS ordination (Somerfield and Clarke 1995), on a total of eight ranked matrices of similarities among samples. By means of this technique, the rank correlations calculated between pairs of similar matrices become the data-element of a second matching matrix, which was then used as an input matrix for the second-stage MDS ordination. In this ordination diagram, the relative distances between the symbols resemble their similarity, whereby samples that are located close to each other, are similar, while those located far apart, are dissimilar (Olsgard et al. 1998).
ANOSIM was performed with the computer program Primer v. 6 (Clarke and Gorley 2006), while ANOVA and correlation analyses were performed with PAST (Hammer et al. 2001). DCA was performed with CANOCO, while the gradient analysis was performed with CANODRAW for windows (ter Braak and Šmilauer 1998).
Results
Maps of Uruguay with the topographic distribution of total monthly rainfall for the whole country are presented in Fig. 2. The highest rainfall values were observed between November 2009 and May 2010. Consequently, the river flow of both Uruguay River and Río de la Plata Estuary increased significantly after November 2009. A strong correlation between Uruguay River and Río de la Plata Estuary flow on log-transformed data was observed (r2 = 0.7), even though the river flow of Río de la Plata was significantly higher than that of the Uruguay River (ANOVA, F = 26.9, P < 0.001, see Fig. 2).

|
The geochemical data for the sediment surface and the salinity, temperature and dissolved oxygen for the bottom water are presented in Fig. 3. Most of chlorophyll-a values were lower than 5 and higher than 1 µg g–1. As a general trend, the highest chlorophyll-a values were observed in Montevideo Bay. Pheopigment contents were higher than chlorophyll-a (i.e. most of them ranging between 10 and 20 µg g–1, and also higher values were observed in Montevideo Bay, although the highest value was observed in the western littoral (station L7, March 2009; shown in yellow in Fig. 3). Most organic matter values ranged between 6 and 10%, but the general trend observed for both chlorophyll-a and pheopigment data (i.e. higher values in Montevideo Bay) was also registered. Protein values ranged between 2 and 6 mg g–1, but the highest values were always observed in the Bay (Fig. 3). Temperature data showed a clear seasonal trend, with the lowest values in winter, middle in spring/autumn and highest in summer (Fig. 3). Salinity values ranged from 30 in July 2009 to 0 in July 2010 (Fig. 3). The lowest values were observed from January to July 2010. Dissolved oxygen ranged between 6 and 12 mg L–1. The lowest dissolved oxygen values were always recorded in Montevideo Bay.
|
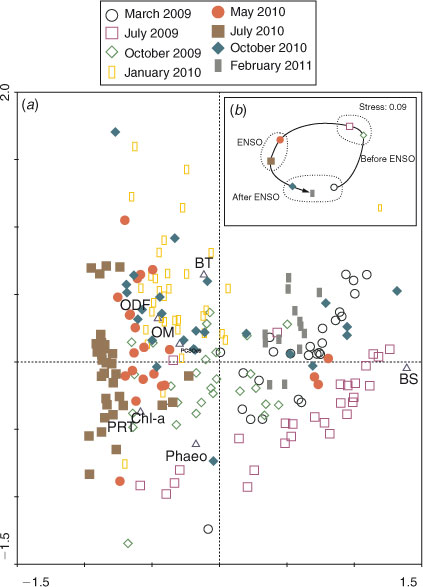
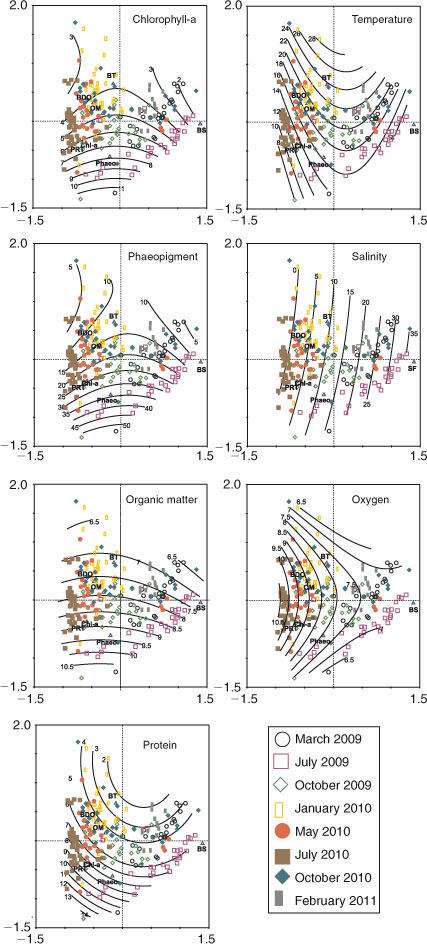
We performed a DCA to analyse the multivariate relationships of environmental variables for both space and time (Fig. 4). The different symbols on the DCA ordination diagram represent different sampling sessions. The first two axes accounted together for 67% of the variance. Most of the stations located on the right quadrants of the ordination diagram (Fig. 4a) corresponded to March 2009, July 2009, October 2009 and February 2011, and were positively related to salinity. This fact is demonstrated in Fig. 5, where salinity isolines are plotted, and the highest values were observed on the right quadrants of the diagram. On the opposite side, those stations that exhibited the lowest salinity values were located on the left quadrants of the ordination diagram, and corresponded to January 2010, May 2010, July 2012 and October 2010. The gradient plotted for salinity within the ordination diagram, was also performed for the rest of the variables. In this sense, protein, chlorophyll-a, pheopigment and organic matter showed a similar trend, with the highest values in the bottom left quadrant of the diagram, and the lowest values within the top right quadrant. Dissolved oxygen displayed an inverse trend to that of salinity, with the highest values within the left quadrants of the ordination diagram, and the lowest within the right quadrants. Finally, temperature showed the highest values in the top quadrants and the lowest in the bottom quadrants. The second stage non-metric multidimensional scaling (NMDS) ordination diagram (Fig. 4b) corroborates the abovementioned pattern, but also shows the temporal evolution of the system as depicted by the arrow in Fig. 4b. In addition, the NMDS ordination diagram indicates that there are three similar groups of sampling sessions that are indicated with dotted circles in Fig. 4b.
|
|
Because we detected an important environmental multivariate gradient, we performed several ANOSIM tests to check for significant differences (Tables 1, 2) in sediment and bottom water variables. In the case of temporal analyses, we defined eight groups, corresponding to each one of the sampling surveys (Table 1). This test was performed for all variables together (Table 1A), for bottom water variables (Table 1B) and for sediment variables (Table 1C). We detected significant differences in most pairwise comparisons, except for a few cases, which are reported in Table 1A, B and C. That is, when comparing all environmental variables together, we detected significant differences between all pairwise comparisons (Table 1). For bottom water variables, non-significant differences were observed between March 2009 and February 2012 (Table 1B), whereas for sediment variables, non-significant differences were detected between July 2009 and May 2010, January 2012 and May 2010, May 2010 and February 2011 and July 2010 and February 2011.
|
|
For spatial analyses, we defined five groups, corresponding to each one of the station groups shown in Figs 1 and 2 (see Table 2). Table 2A and B shows the pairwise temporal comparisons for all stations together and for each of the groups separately. In most cases, we detected significant temporal differences (Table 2A and B). Spatial analyses for all sampling sessions did not yield significant differences for the pairwise comparisons (March 2009–July 2009, July 2009–March 2012 and January 2010–March 2010). For Montevideo Bay, we detected the highest number of cases of non-significant differences (see Table 1B). For the station groups corresponding to the eastern/western littoral, Punta Carretas and Punta Yeguas, significant differences were only observed in a few cases that occurred between October 2009–January/March 2010 and February 2011 (see Table 1B).
Discussion
We provide good correlative evidence that trophic-state variability within the study area depends both on human activity and natural factors, such as the ENSO event. These factors appear to exert a differential influence. While the anthropogenic impacts are hierarchically more important in determining the spatial trophic gradient, the ENSO effects are more evident on the temporal scale. In consequence, the trophic conditions of Montevideo Bay appear to be most affected by anthropogenic factors whereas those of the adjacent coastal zone more influenced by the ENSO event, because of the increased river flow of Paraná and Uruguay rivers.
The spatial distribution pattern of sediment geochemical variables in the study area closely agrees with previous assessments (Burone et al. 2006; Brugnoli et al. 2007; García-Rodríguez et al. 2011; Muniz et al. 2011, 2004a, 2004b; Venturini et al. 2012, 2004). That is, Montevideo Bay is a polluted system that displays higher values of sediment geochemical variables than those of the coastal zone. Historical values of chlorophyll-a, pheopigments, organic matter and protein content, showed values significantly higher in the bay than in the coastal zone. Heavy metals also showed the same trend observed for organic variables (Muniz et al. 2004a, 2004b; García-Rodríguez et al. 2011; Venturini et al. 2012, 2004). This is because Montevideo Bay is a semi-enclosed system, close to both contamination and eutrophication sources, i.e. townships, leather tanneries, food industry, absence of sanitation, petrol refinery, thermoelectric facility and harbour activities (García-Rodríguez et al. 2010; Burone et al. 2011). As a consequence, the concentration of domestic and industrial contaminants is significantly higher in the bay than in the adjacent coastal zone, as contaminant levels display a sharp decrease just off Montevideo Bay. Such a trend was clearly displayed in the DCA ordination diagram, as most of the stations of Montevideo Bay were positioned within the bottom left quadrant of the diagram (Fig. 4A), where the highest values of geochemical variables were detected (Fig. 5). This trend is in close agreement with Danulat et al. (2002), who classified the bay as hypertrophic and the adjacent coastal areas as eutrophic. Moreover, the bottom waters of Montevideo Bay are usually either anoxic or hypoxic, while those of adjacent coastal zone are usually well oxygenated (Danulat et al. 2002; Burone et al. 2006; Brugnoli et al. 2007; Muniz et al. 2011, 2004a, 2004b; García-Rodríguez et al. 2011; Venturini et al. 2012, 2004 ).
Temporal variations in rainfall rates from March 2009 to February 2011 do not fit within the normal pattern for the study area, as the end of spring and summer are considered the dry seasons because total precipitation values are commonly low (Bidegain et al. 2005). The observed anomaly, from the end of November 2009 to May 2010, was expressed as an increase in precipitation because of the onset of an ENSO event. According to Barreiro (2009), such a pattern of increased rainfall is expected for the warm phase of ENSO events during spring in south-eastern South America. The regional increase in rainfall led to a sharp increase in the river flow of both Río Uruguay and Río de la Plata (i.e. by 500%), which were positively well correlated, but also the river flow of Río de la Plata, which was significantly higher relative to that of Río Uruguay. Therefore, the large freshwater input from the Uruguay (and Paraná) River into de Río de la Plata, explains the steady decrease in salinity for the Río de la Plata from October 2009 to July 2010 (Fig. 3). In this sense, we detected temporal statistical differences in salinity levels at various stations, which were reflected in the DCA ordination diagram that showed a very clear trend corresponding to the ENSO event (i.e. in our case January 2012, May 2010 and July 2012). Therefore, our data suggest that there is a very close link between ENSO, increase in rainfall and associated freshwater input, together with a subsequent decrease in salinity levels of Río de la Plata. In addition, the increased continental input during summer 2010 resulted in warmer water temperatures than those observed before and after the ENSO. For example, the average water temperatures recorded during the month of January 2010 (28°C) at the height of the El Niño event compared with February 2011 (25°C) after the El Niño event. Furthermore, the continental freshwater input exhibited a higher temperature than mean historical summer values (i.e. close 25°C, Guerrero et al. 1997).
An inverse relationship between salinity and trophic state was clearly inferred. Maximum values of protein, organic matter, chlorophyll-a and pheopigment concentration were associated to freshwater conditions. The latter suggests that warm-phase ENSO events play a major role in regulating the continental freshwater input into the middle estuary, which would ultimately explain part of the interannual variability in the sediment geochemical conditions. Such interannual variability was less evident in Montevideo Bay because of the influence of human activities. However, since warm-phase ENSO events lead to increases in rainfall (Barreiro 2009), one might expect, and perhaps anticipate, future eutrophication episodes to occur during ENSO in the Río de la Plata due to concomitant increases in the river flow feeding the Río de la Plata. Regional freshwater input comes from a 4 144 000 km2 basin (Fig. 1), where agriculture, forestry, cattle and sheep grazing, pulp industry, hydroelectric dams and urban centres also contribute to intensify the eutrophication process (Bonachea et al. 2010). Such eutrophication trends are well documented and understood for the water column of Río de la Plata (FREPLATA 2004; Licursi et al. 2006) although the trophic response of the sediment to the continental freshwater inputs during warm ENSO episodes has not received the same attention. Therefore, the information presented in this paper is relevant to improve our understanding of the possible links between ENSO events and sediment eutrophication.
Final remarks
We analysed the trophic gradient in an estuarine metropolitan area with well documented spatial trophic changes related to human impacts. Sampling stations of Montevideo Bay located close to the domestic and industrial contamination sources exhibit hypertrophic conditions whereas those located in the coastal zone are eutrophic. During ENSO events, the inter-annual variability in sediment geochemistry is controlled by the high rainfall rates, huge increases in the river flow, and therefore the increased continental freshwater input into the estuarine zone.
Acknowledgements
This project was funded by Intendencia de Montevideo (IM), Administración Nacional del Puerto (ANP), CISC-Program ‘Contratación de Científicos Provenientes del Exterior’, ANII-SNI and PEDECIBA. The Uruguayan Navy (Prefectura Nacional Naval) is acknowledged for helping in the field work. Total monthly rainfall data were kindly provided by Agustín Giménez and Guadalupe Tiscornia, Unidad de Agroclima y Sistemas de Información, Instituto Nacional de Investigación Agropecuaria (INIA) Uruguay. River flow data were kindly provided by project GEF/URU-G07/32. Michael Ellwood and two anonymous reviewers provided us helpful comments that improved this paper. This paper is dedicated to Graciela García-Rodríguez on her mothers’ day.
References
Ayup, R. N. (1986). Comportamento dos sedimentos em suspensão no Río de la Plata exterior e proximidades. Pesquisas Sección B Ciências Naturais (Porto Alegre) 18, 39–68.Barreiro, M. (2009). Influence of ENSO and the South Atlantic Ocean on climate predictability over Southeastern South America. Climate Dynamics , .
| Influence of ENSO and the South Atlantic Ocean on climate predictability over Southeastern South America.Crossref | GoogleScholarGoogle Scholar |
Bidegain, M., Caffera, R. M., Pshennikov, V., Lagomarsino, J., and Nagy, G. J. E.A. (2005). Tendencias climáticas, hidrológicas y oceanográficas en el Río de la Plata y costa Uruguaya. In ‘El Cambio Climático en el Río de la Plata, Vol. 14’. (Eds V. Barros, A. Menéndez and G. J. Nagy.) pp. 137–143. (CIMA-UBA: Buenos Aires.)
Bidegain, M., de los Santos, B., de los Campos, T., de los Santos, M., Pshennikov, V., and Verocai, J. D. N., and Severov, D. (2009). Escenarios de cambio climático y del nivel medio del mar en áreas costeras del Uruguay. Reporte de la Facultad de Ciencias al Proyecto GEF-Implementación Medidas de Adaptación al Cambio Climático en Áreas Costeras del Uruguay (ACCC), Unidad de Cambio Climático (UCC), MVOTMA, Uruguay. Available at www.cambioclimatico.gub.uy
Bonachea, J., Bruschi, V. M., Hurtado, M. A., Forte, L. M., da Silva, R., Etcheverry, M., Cavallotto, J. L., Dantas, M. F., Pejon, O. J., Zuquette, L. Z., Bezerra, M. A. O., Remondo, J., Rivas, V., Gómez-Arozamena, J., Fernández, G., and Cendrero, A. (2010). Natural and human forcing in recent geomorphic change; case studies in the Rio de la Plata basin. The Science of the Total Environment 408, 2674–2695.
| Natural and human forcing in recent geomorphic change; case studies in the Rio de la Plata basin.Crossref | GoogleScholarGoogle Scholar | 1:CAS:528:DC%2BC3cXlsFaqsbo%3D&md5=6e6841d31365ed656de3665d97089fd5CAS | 20381129PubMed |
Bricker, S. B., Ferreira, J. G., and Simas, T. (2003). An integrated methodology for assessment of estuarine trophic status. Ecological Modelling 169, 39–60.
| An integrated methodology for assessment of estuarine trophic status.Crossref | GoogleScholarGoogle Scholar | 1:CAS:528:DC%2BD3sXotlWksbk%3D&md5=34b422033da692237f0fc4403c773f9aCAS |
Bricker, S. B., Longstaff, B., Dennison, W., Jones, A., Boicourt, K., Wicks, C., and Woerner, J. (2008). Effects of nutrient enrichment in the nation’s estuaries: a decade of change. Harmful Algae 8, 21–32.
| Effects of nutrient enrichment in the nation’s estuaries: a decade of change.Crossref | GoogleScholarGoogle Scholar | 1:CAS:528:DC%2BD1MXpvFGiuw%3D%3D&md5=7086661fd9fbbac3997ef4f567d7efadCAS |
Brugnoli, E., Muniz, P., Venturini, N., and Burone, L.( 2007). Environmental perturbation and coastal benthic biodiversity in Uruguay. In ‘Progress in Environmental Research’. (Ed. I. C. Willis.) Chapter 2, pp. 75–126. (Nova Publisher: New York.)
Burone, L., Michaelovitch de Mahiques, M., Lopes Figueira, R. C., García-Rodriguez, F., Sprechmann, P., Alvarez, Y., Muniz, P., Brugnoli, E., Venturini, N., de Mello e Sousa, S. E., and Centurión, V. (2011). Evolución paleoambiental de la Bahía de Montevideo (Uruguay) – bases para el establecimiento de un modelo ambiental. In El. Holoceno en la zona costera del Uruguay. Ed F. García-Rodríguez, 197–227, CSIC-UdelaR, Facultad de Ciencias, Montevideo.
Burone, L., Venturini, N., Sprechmann, P., Valente, P., and Muniz, P. (2006). Foraminiferal responses to polluted sediments in the Montevideo Coastal Zone, Uruguay. Marine Pollution Bulletin 52, 61–73.
| Foraminiferal responses to polluted sediments in the Montevideo Coastal Zone, Uruguay.Crossref | GoogleScholarGoogle Scholar | 1:CAS:528:DC%2BD28XptVehsw%3D%3D&md5=464c9f91cea2df6076876a74231485c1CAS | 16194551PubMed |
Calliari, D., Brugnoli, E., Ferrari, G., and Vizziano, D. (2009). Phytoplankton distribution and production along a wide enviromental gradient in the South-West Atlantic off Uruguay. Hidrobiologia 620, 47–61.
| Phytoplankton distribution and production along a wide enviromental gradient in the South-West Atlantic off Uruguay.Crossref | GoogleScholarGoogle Scholar | 1:CAS:528:DC%2BD1cXhsFCis7jK&md5=d124e4848a0125fa1b0ca59b09bc7fd4CAS |
Clarke, K. R., and Gorley, R. N. (2006). PRIMER v6: User manual/Tutorial, PRIMER-E: Plymouth.
Cloern, J. E. (2001). Our evolving conceptual model of the coastal eutrophication problem. Marine Ecology Progress Series 210, 223–253.
| Our evolving conceptual model of the coastal eutrophication problem.Crossref | GoogleScholarGoogle Scholar | 1:CAS:528:DC%2BD3MXisV2hsrw%3D&md5=6bf039937e238083a405229c395de7c7CAS |
Danulat, E., Muniz, P., García-Alonso, J., and Yannicelli, B. (2002). First assessment of the highlycontaminated harbour of Montevideo, Uruguay. Marine Pollution Bulletin 44, 554–565.
| First assessment of the highlycontaminated harbour of Montevideo, Uruguay.Crossref | GoogleScholarGoogle Scholar | 1:CAS:528:DC%2BD38XktFOmsrw%3D&md5=9855deab5c2e1e531dc923846f46f834CAS | 12146839PubMed |
Dell’Anno, A., Mei, M. L., Pusceddu, A., and Danovaro, R. (2002). Assessing the trophic state and eutrophication of coastal marine systems: a new approach based on the biochemical composition of sediment organic matter. Marine Pollution Bulletin 44, 611–622.
| Assessing the trophic state and eutrophication of coastal marine systems: a new approach based on the biochemical composition of sediment organic matter.Crossref | GoogleScholarGoogle Scholar | 1:CAS:528:DC%2BD38XlsVKgt7s%3D&md5=650807f166bbf942c32f50af36ed45bbCAS | 12222884PubMed |
Framiñan, M. B., Etala, M. P., Acha, E. M., Guerrero, R. A., Lasta, C. A., and Brown, O. B. (1999). Physical characteristics and processes of the Río de la Plata estuary. In ‘Estuaries of South America, Their Geomorphology and Dynamics’, (Eds G. M. Perillo, M. C. Piccolo and M. Pino-Quivira.) pp. 161–191. (Springer-Verlag: Berlin.)
FREPLATA. (2004). Análisis Diagnóstico Transfronterizo del Río de la Plata y su Frente Marítimo. Documento Técnico. Proyecto Protección Ambiental del Río de la Plata y su Frente Marítimo. Proyecto PNUD/GEF/RLA/99/G31.
García-Rodríguez, F., Hutton, M., Brugnoli, E., Venturini, N., del Puerto, L., Inda, H., Bracco, R., Burone, L., and Muniz, P. (2010). Assessing the effect of natural variability and human impacts on the environmental quality of a coastal metropolitan area (Montevideo Bay, Uruguay). Pan American Journal of Aquatic Sciences. 5, 90–99.
García-Rodríguez, F., del Puerto, L., Venturini, N., Pita, A. L., Brugnoli, E., Burone, L., and Muniz, P. (2011). Diatoms, protein and carbohydrate sediment content as proxies for coastal eutrophication in Montevideo, Río de la Plata estuary, Uruguay. Brazilian Journal of Oceanography 54, 293–310.
Giberto, D. A., Bermec, C. A., Acha, E. M., and Mianzan, H. (2004). Large-scale spatial patterns of benthic assemblages in the SW Atlantic: the Rio de la Plata estuary and adjacent shelf waters. Estuarine, Coastal and Shelf Science 61, 1–13.
| Large-scale spatial patterns of benthic assemblages in the SW Atlantic: the Rio de la Plata estuary and adjacent shelf waters.Crossref | GoogleScholarGoogle Scholar | 1:CAS:528:DC%2BD2cXnt1ags7Y%3D&md5=5f3254d207b777cb02456c2aa4fa377fCAS |
Gómez-Erache, M., Vizziano, D., Muniz, P., and Nagy, G. J. (2001). The Health of the Río de la Plata system: Northern Coast, Uruguay. In ‘Opportunity and Challenges for Protecting, Restoring and Enhancing Coastal habitats in the Bay of Fundy. Proceedings of the 4th Bay of Fundy Science Worshops, Saint John, New Brunswick. Environment Canada, Atlantic Region. Occasional Report N° 17’. (Eds T. Chopin and P. G. Wells.) pp. 17–35. (Environment Canada: Darmouth, Nova Scotia.)
Guerrero, R. A., Lasta, C. A., Acha, E. M., Mianzan, H. W., and Framiñan, M. A. (1997). Hydrographic atlas of the Río de la Plata. Comisión Administradora del Río de la Plata, Buenos Aires, Montevideo.
Hammer, Ø., Harper, D. A. T., and Ryan, P. D. (2001). PAST: Paleontological Statistics Software Package for Education and Data Analysis. Palaeontologia Electronica 4(1): 9pp. http://palaeo-electronica.org/2001_1/past/issue1_01.htm
Hartree, E. F. (1972). Determination of proteins: a modification of the Lowry method that give a linear photometric response. Analytical Biochemistry 48, 422–427.
| Determination of proteins: a modification of the Lowry method that give a linear photometric response.Crossref | GoogleScholarGoogle Scholar | 1:CAS:528:DyaE38XksVGjur0%3D&md5=4ac5cfedf3a4354e2d23d8347549aa7fCAS | 4115981PubMed |
Heiri, O., Lotter, A. F., and Lemcke, G. (2001). Loss on ignition as a method for estimating organic and carbonate content: reproducibility and comparability of the results. Journal of Paleolimnology 25, 101–110.
| Loss on ignition as a method for estimating organic and carbonate content: reproducibility and comparability of the results.Crossref | GoogleScholarGoogle Scholar |
Licursi, M., Sierra, M. V., and Gómez, N. (2006). Diatom assemblages from a turbid coastal plain estuary: Río de la Plata (South America). Journal of Marine Systems 62, 35–45.
| Diatom assemblages from a turbid coastal plain estuary: Río de la Plata (South America).Crossref | GoogleScholarGoogle Scholar |
Lorenzen, C. J. (1967). Determination of chlorophyll and pheopigments: Spectrophotometric equations. Limnology and Oceanography 12, 343–346.
| Determination of chlorophyll and pheopigments: Spectrophotometric equations.Crossref | GoogleScholarGoogle Scholar | 1:CAS:528:DyaF1cXovFOqsQ%3D%3D&md5=8b2b152c886c5a4b2f5630adec75d91bCAS |
Moresco, H., and Dol, I. (1996). Metales en sedimentos de la Bahía de Montevideo. Revista de la Asociacion de Ciencias Naturales del Litoral 27, 1–5.
Muniz, P., Venturini, N., and Martínez, A. (2002). Physico-chemical and pollutans of the benthic environment of the Montevideo Coastal Zone, Uruguay. Marine Pollution Bulletin 44, 962–968.
| Physico-chemical and pollutans of the benthic environment of the Montevideo Coastal Zone, Uruguay.Crossref | GoogleScholarGoogle Scholar | 1:CAS:528:DC%2BD38XmvVWntr8%3D&md5=e7dec7a4ed6016faf3549356502a618eCAS | 12405221PubMed |
Muniz, P., Venturini, N., and Gómez-Erache, M. (2004a). Spatial distribution of chromium and lead in sediments from coastal areas of the Río de la Plata estuary (Montevideo, Uruguay). Brazilian Journal of Biology 64, 103–116.
| Spatial distribution of chromium and lead in sediments from coastal areas of the Río de la Plata estuary (Montevideo, Uruguay).Crossref | GoogleScholarGoogle Scholar | 1:STN:280:DC%2BD2c3psV2nsw%3D%3D&md5=95c04bc94a059a3bdd62f7681d2342baCAS |
Muniz, P., Danulat, E., Yannicelli, B., García-Alonso, J., Medina, G., and Bícego, M. (2004b). Assessment of contamination by hydrocarbons and heavy metals in sediments of Montevideo Harbour (Uruguay). Environment International 29, 1019–1028.
| Assessment of contamination by hydrocarbons and heavy metals in sediments of Montevideo Harbour (Uruguay).Crossref | GoogleScholarGoogle Scholar | 1:CAS:528:DC%2BD3sXptVSqt7g%3D&md5=079134e3df67fa37540522e8347d42e5CAS | 14680884PubMed |
Muniz, P., Venturini, N., Hutton, M., Kandratavicius, N., Pita, A., Brugnoli, E., Burone, L., and García-Rodríguez, F. (2011). Ecosystem health of Montevideo coastal zone: a multi approach using some different benthic indicators. Journal of Sea Research 65, 38–50.
| Ecosystem health of Montevideo coastal zone: a multi approach using some different benthic indicators.Crossref | GoogleScholarGoogle Scholar |
Nagy, G. J. C., Martínez, M., Caffera, M. R., Pedrosa, G., Forbes, E. A., Perdomo, A. C., López Laborde, J. (1997). The Hydrological and Climatic setting of the Rio de la Plata. Chapter 2. In ‘The Rio de la Plata. An Environmental Overview. An EcoPlata Project Background Report’. (Eds P. G. Wells and G. R. Daborn.) pp. 17–68. (Dalhousie University: Halifax, Nova Scotia.)
Nagy, G. J., Gomez-Erache, M., Lopez, C. H., and Perdomo, A. C. (2002). Distribution patterns of nutrients and symptoms of eutrophication in the Rio de la Plata River Estuary System. Hydrobiologia 475/476, 125–139.
| Distribution patterns of nutrients and symptoms of eutrophication in the Rio de la Plata River Estuary System.Crossref | GoogleScholarGoogle Scholar | 1:CAS:528:DC%2BD38Xntlygtb4%3D&md5=be18911589f3f62b55dee2431d737ce0CAS |
Naumann, E. (1919). Nagra synpunkter angaende limnoplanktons ökologi medsärskild hänsyn til fytoplankton. Svensk Botanisk Tidskrift 13, 129–163.
Nixon, S. W. (1995). Coastal marine eutrophication: a definition, social causes, and future concerns. Ophelia 41, 199–219.
Olsgard, F., Somerfield, P. J., and Carr, M. R. (1998). Relationships between taxonomic resolution, macrobenthic community patterns and disturbance. Marine Ecology Progress Series 172, 25–36.
| Relationships between taxonomic resolution, macrobenthic community patterns and disturbance.Crossref | GoogleScholarGoogle Scholar |
Paerl, H. W. (2006). Assessing and managing nutrient-enhanced eutrophication in estuarine and coastal waters: interactive effects of human and climatic perturbations. Ecological Engineering 26, 40–54.
| Assessing and managing nutrient-enhanced eutrophication in estuarine and coastal waters: interactive effects of human and climatic perturbations.Crossref | GoogleScholarGoogle Scholar |
Pinckney, J. L., Paerl, H. W., Tester, P., and Richardson, T. L. (2001). The role of nutrient loading and eutrophication in estuarine ecology. Environmental Health Perspectives 109, 699–706.
| 1:CAS:528:DC%2BD3MXotl2lurY%3D&md5=7bd3ab31368633909cb64ada7d124e29CAS | 11677178PubMed |
Piola, A. R., Campos, E. J. D., Möller, O. O., and Martinez, C. (2000). The subtropical shelf front off eastern South America. Journal of Geophysical Research 105, 6565–6578.
| The subtropical shelf front off eastern South America.Crossref | GoogleScholarGoogle Scholar |
Pusceddu, A., Dell’Anno, A., Fabiano, M., and Danovaro, R. (2009). Quantity and bioavailability of sediment organic matter as signatures of benthic trophic status. Marine Ecology Progress Series 375, 41–52.
| Quantity and bioavailability of sediment organic matter as signatures of benthic trophic status.Crossref | GoogleScholarGoogle Scholar | 1:CAS:528:DC%2BD1MXjslagu7Y%3D&md5=40309d1904ae72f94143ba849e366107CAS |
Rice, D. L. (1982). The detritus nitrogen problem: new observations and perspectives from organic geochemistry. Marine Ecology Progress Series 9, 153–162.
| The detritus nitrogen problem: new observations and perspectives from organic geochemistry.Crossref | GoogleScholarGoogle Scholar | 1:CAS:528:DyaL38XlsVers7c%3D&md5=4f06473aa271b8663e2d6df0860049a8CAS |
Scavia, D., and Bricker, S. B. (2006). Coastal eutrophication assessment in the United States. Biogeochemistry 79, 187–208.
| Coastal eutrophication assessment in the United States.Crossref | GoogleScholarGoogle Scholar |
Scheffer, M. (2009). ‘Critical Transitions in Nature and Society.’ (Princeton University Press: Princeton, NJ, USA.)
Somerfield, P. J., and Clarke, K. R. (1995). Taxonomic levels, in marine community studies, revisited. Marine Ecology Progress Series 127, 113–119.
| Taxonomic levels, in marine community studies, revisited.Crossref | GoogleScholarGoogle Scholar |
Sünback, K. (1983). Microphytobenthos on sand in shallow brackish water, Öresund Sweeden. Primary production, chlorophyll a content and species composition (Diatoms) in relation to some ecological factors. Doctoral Thesis. Department of Systematic Botany, University of Lund, Sweeden. LUNDS/(NBBS-1006).
ter Braak, C. F. J., and Šmilauer, P. (1998). CANOCO Reference Manual and User’s Guide to CANOCO for Windows: Software for Canonical Community Ordination (version 4). Microcomputer Power, Ithaca, New York.
Venturini, N., Muniz, P., and Rodriguez, M. (2004). Macrobenthic subtidal communities in relation to sediment pollution: a test of the applicability of the phylum-level meta-analysis approach in a southeastern coastal region of South America. Marine Biology 144, 119–126.
| Macrobenthic subtidal communities in relation to sediment pollution: a test of the applicability of the phylum-level meta-analysis approach in a southeastern coastal region of South America.Crossref | GoogleScholarGoogle Scholar | 1:CAS:528:DC%2BD3sXpvVKqsr4%3D&md5=82fcd226a9cf851632569538a44d067dCAS |
Venturini, N., Pita, A. L., Brugnoli, E., García-Rodríguez, F., Burone, L., Kandratavicius, L., Hutton, H., and Muniz, P. (2012). Benthic trophic status of sediments in a metropolitan area (Rio de la Plata estuary): Linkages with natural and human pressures. Estuarine, Coastal and Shelf Science 112, 139–152.
| Benthic trophic status of sediments in a metropolitan area (Rio de la Plata estuary): Linkages with natural and human pressures. Estuarine, Coastal and Shelf ScienceCrossref | GoogleScholarGoogle Scholar | 1:CAS:528:DC%2BC38XhsVartrzE&md5=08042815f6e586f47b7331b2e457c68eCAS |