

The social and economic dimensions of one of the world’s longest-operating shark fisheries
Matias Braccini A * , Maddison Watt B , Clinton Syers B , Nick Blay B , Matthew Navarro C and Michael Burton C
A
B
C
Abstract
Social and economic information is limited for coastal commercial and recreational fisheries, particularly shark fisheries, which are perceived as unsustainable and as targeting sharks for fins.
To characterise the social and economic dimensions of one of the world’s few long-standing sustainable shark fisheries.
We reviewed historic data and surveyed stakeholders to understand the economic and social dimensions of the shark fishery currently operating in Western Australia.
Since the fishery’s historic peak, there has been a substantial reduction in the number of operating vessels and ports due to management intervention. For the vessels that have remained, catches and catch rates increased through time. Fishers sold only flesh and fins, whereas processors also sold cartilage. Revenue mostly originates from the domestic sale of flesh, not fins. This fishery provides additional social and economic returns through the employment of an average of 102 people per annum, the supply of local fresh seafood to communities and the expenditure of most of operational costs in local government areas. In addition, the average annual market value through the supply chain was A$32.6 × 10⁶ (US$20.9 × 10⁶).
Our study is the first step towards a more comprehensive valuation of the societal contribution of sustainable shark fisheries.
This novel information has a range of applications, from developing social and economic objectives in fisheries harvest strategies to empowering government agencies when making decisions on natural resource management.
Keywords: elasmobranchs, environmental, management, perceptions, socio-economics, sustainability, trade, Western Australia.
Introduction
Globally, commercial fishing provides critical benefits for people, including provision of food and income (Stephenson et al. 2018), with ~15 million fishers being directly involved in commercial fishing and, more generally, almost 60 million people being involved in the primary sectors of fisheries and aquaculture (Food and Agriculture Organization of the United Nations 2020). The management of commercial fisheries has traditionally focussed on collection and analysis of biological data to inform adjustment of catch-and-effort in pursuit of objectives such as resource sustainability (Fulton 2021). However, successful fisheries management requires more than the periodic collection of biological and fisheries data to adjust catch-and-effort levels; it requires an understanding of the human dimensions. Managing fisheries also involves managing people (Larkin 1988) and there is a growing consensus to move fisheries to higher stock abundance, with a greater economic profitability, lower impacts on marine ecosystems and improved social sustainability (Hilborn 2007). This requires understanding the social and economic dimensions of a fishery because these drive fishers’ motivations to fish (Hilborn 2007). In particular, social and economic information allows assessing the contribution of a fishery in terms of social objectives such as maintaining livelihoods, employment and food security, and economic objectives such as maximising profitability and economic efficiency (Anonymous 1995), which, in turn, underpins the achievement of Sustainable development goal (SDG) 14, in particular with regards to monitoring the economic and social contribution of marine resources to national and local economies. In addition, the value of a fishery goes beyond the value of the retained catch as fisheries play a key role in coastal communities, from supplying fresh fish and generating direct income for local residents to stimulating other sectors through demand for fishing inputs (Pascoe et al. 2016).
Overfishing has resulted in more than one-third of shark species currently being threatened with extinction according to the International Union for Conservation of Nature (IUCN) (Dulvy et al. 2021). This is due to sharks’ low biological productivity (i.e. low fecundity, high longevity, slow growth), an increased demand for shark fins, flesh and other products, and limited management (Dulvy et al. 2017). Sharks are taken in a range of industrial, artisanal and recreational fisheries either as bycatch (incidental catch) or as target species (Oliver et al. 2015). Most targeted shark fisheries have been short-lived, particularly when poorly or not managed, typically showing a rapid increase in catches, followed by substantial declines (Walker 1998). For example, a Californian drift-net fishery targeted at common thresher shark (Alopias vulpinus) commenced in 1977, peaked in 1982 and, by 1987, declined to <20% of its peak as a result of stock declines (Bedford 1987). More recently, the global abundance of oceanic sharks has declined by >70% since 1970, because of an 18-fold increase in fishing pressure (Pacoureau et al. 2021). However, there are a few examples of shark fisheries that have been operating for several decades, where considerable management effort has been invested to ensure sustainability (e.g. Simpfendorfer and Dulvy 2017; Braccini et al. 2020).
The temperate demersal gillnet and demersal longline fisheries (TDGDLF), comprising the West Coast Demersal Gillnet and Demersal Longline Fishery (WCDGDLF) and Southern Demersal Gillnet and Demersal Longline Fishery (SDGDLF), operate in the continental-shelf waters of Western Australia (WA) between 26°S and the WA–South Australian border (129°E) (Fig. 1). Most operators employ demersal gillnets and power-hauled reels to target sharks, mostly gummy sharks (Mustelus antarcticus), dusky sharks (Carcharhinus obscurus), whiskery sharks (Furgaleus macki) and sandbar sharks (Carcharhinus plumbeus), with demersal longline also permitted, but currently not widely used. Sharks have been commercially harvested in southern WA since the 1940s, with the fishery gradually expanding and peaking in the late 1980s and early 1990s (Simpfendorfer and Donohue 1998). Unregulated effort led to unsustainable catches; hence, a range of management measures has been introduced since the late-1980s to reduce effort and, consequently, catches (Braccini et al. 2021a). Catch-and-effort data are reported in statutory fishery returns collated by the Department of Primary Industries and Regional Development (DPIRD) and a range of biological and abundance data has been generated through several strategic research projects. These scientific data streams are used in stock assessments to provide management advice (e.g. Simpfendorfer et al. 1999; Braccini et al. 2021a). As a result, the catch-and-effort systems and the biological knowledge for the main target species are well established. However, there is limited information on the social and economic aspects of the TDGDLF.
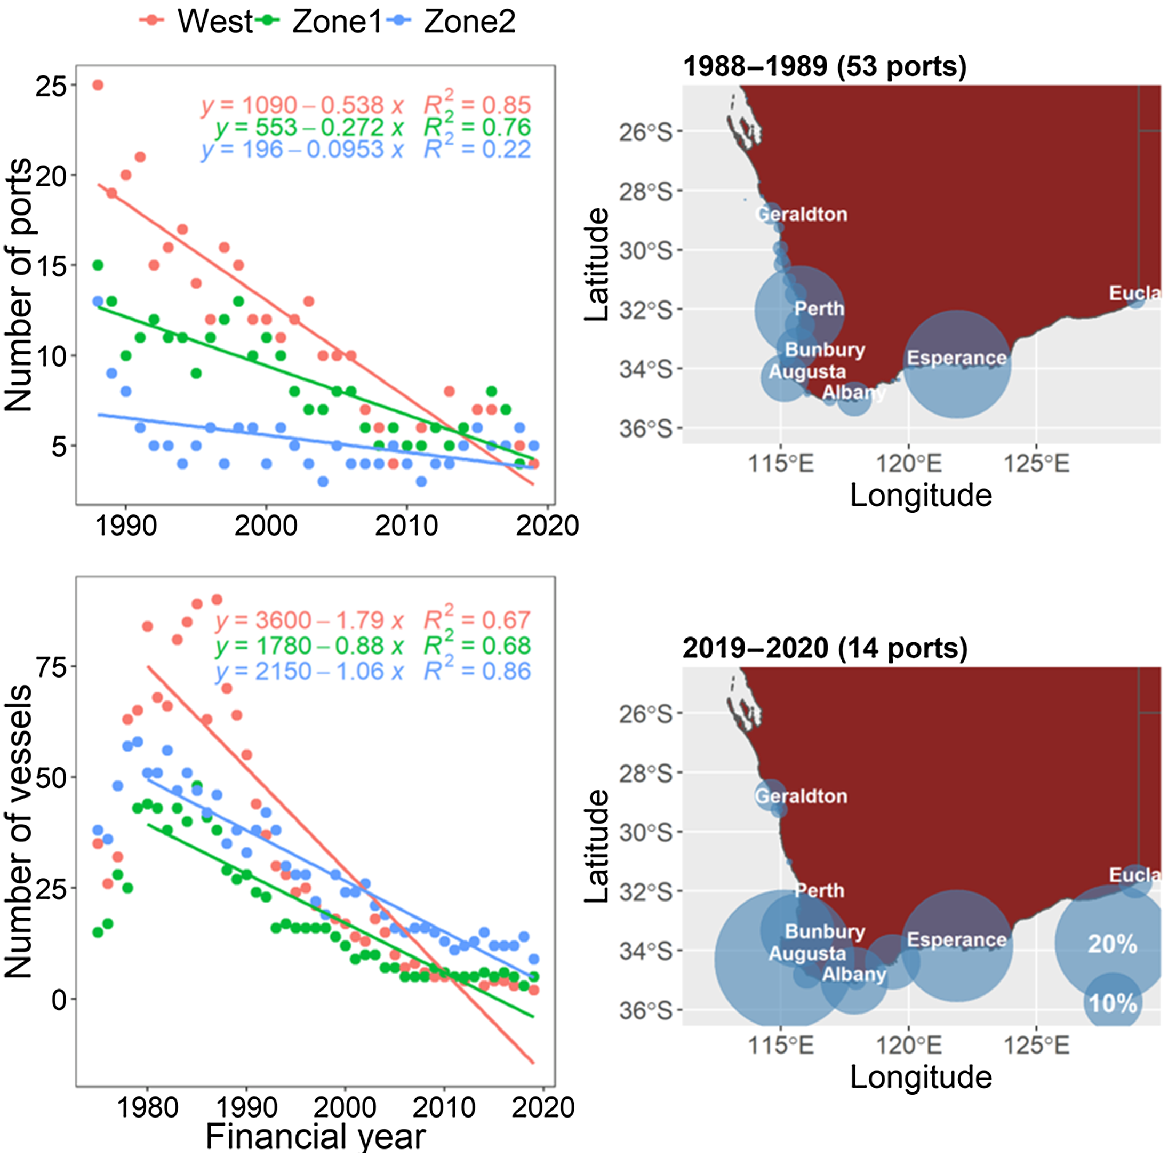
Annual number of departure ports and vessels by fishing zone with a linear trend line (left column). (NB, for departure port, information is only available since 1988). Also shown is a map of the proportion of trips undertaken by departure port in 1988–1989 (historic peak in effort) and 2019–2020 (right column).
The social and economic dimensions of shark fisheries underpin the complex trade in shark products; understanding these dimensions is essential for the long-term sustainability of shark populations (Department of Agriculture, Fisheries and Forestry 2012; Jorgensen et al. 2022). Given the lack of information on the socio-economics of TDGDLF, the objectives of the current study were to characterise the social and economic dimensions of this fishery and its supply chain to quantify the contribution of the fishery to the regional economy. By addressing these gaps, this study improves our understanding of the multiple dimensions that make up a commercial shark fishery, from generating information to design adequate succession plans and management measures through the supply chain, to valuing the role of the TDGDLF within WA’s coastal communities.
Methods
Temporal changes in ports and vessels
Data on catch-and-effort, port of departure, and vessel participation in the TDGDLF were obtained from the catch-and-effort systems of the DPIRD (Braccini et al. 2021b). These data were used to determine patterns in catch, catch rates, and the number of ports used and vessel participation in the TDGDLF through time (1975–2019).
Socio-economic survey
A voluntary survey of TDGDLF vessel owners, skippers and fish processors was conducted to understand the economic and social dimensions of the TDGDLF and its current contribution to the regional economy. Two socio-economic questionnaires (see ‘Questionnaires used during the interview of (a) fishers and (b) fish processors’ section in the Supplementary material) were designed following Pascoe et al. (2016). These surveys were designed to go beyond commonly reported coarse metric of economic contribution (e.g. gross value product), instead supporting estimation of a suite of metrics including gross value added (GVA) to the economy, and value-add through the supply chain and employment. Together these metrics allow a more nuanced understanding of the economic contributions of the fishery. In total, 46 stakeholders were originally identified from DPIRD licensing, vessel-monitoring system (VMS) and catch-and-effort returns databases (Braccini et al. 2021b). From these, 33 vessel owners and skippers (henceforth referred to as ‘fishers’) or fish processors were identified as ‘active operators’. An email was sent to each of these stakeholders, notifying them of the upcoming survey, followed by a phone call. A face-to-face meeting was arranged with those who agreed to participate (n = 13). Data analyses and visualisations were performed using the statistical software R (ver. 4.0.3 (2020-10-10), R Foundation for Statistical Computing, Vienna, Austria, see https://www.R-project.org/). Network analysis and Sankey plots were used to visualise the flow of the TDGDLF catch from fishers to processors, the general public and other elements of the supply chain. The average values provided by respondents were used for this analysis.
Social and economic contributions
Catch and socio-economic survey data were used to determine the social and economic contribution of the TDGDLF on the basis of the following indicators: average fisher personal income, average fishery revenue, average gross value of end consumptive use, which represents the market value through the supply chain (Rogers 2017), average GVA, and average number of persons employed in the TDGDLF. For some of the responses needed for calculating these metrics, survey participants provided a range (e.g. annual costs). Hence, a Monte Carlo procedure was implemented. For each respondent, 1000 samples were drawn from a uniform distribution, with upper and lower bounds set at the minimum and maximum values provided in the response. These random draws were used in the relevant calculations and the 2.5, 50 and 97.5% percentiles were extracted.
Fisher personal income was calculated as revenue (i.e. the product of annual landed catch and catch price) minus taxes, wages and other fishing costs (vessel repairs, lease or mortgage, gear repairs, fuel, lubricants, food, packaging, ice, bait, licensing and administration). Fishery revenue was calculated as the product of total annual landed catch and catch price.
The overall market value through the supply chain of the TDGDLF (FV) was calculated as follows:
where PVretail is the revenue generated by processors for retail sales; RV is the revenue generated by retailers (restaurants, pubs) other than fish and chip shops from the sale of processed TDGDLF catch; and FCV is the revenue generated by fish and chip shops from the sale of processed TDGDLF catch.
The revenue generated by each sector was calculated as follows:
where psold retail is the proportion of the processed catch from the TDGDLF sold by processors as retail; pri is the processors’ retail price per kilogram (fillets) for Species i; is the annual landed catch of Species i by the TDGDLF; and ri is the flesh recovery rate of Species i.
where psold other retailer is the proportion of the processed catch from the TDGDLF sold by processors to retailers other than fish and chip shops; pwi is the processors’ wholesale price per kilogram (fillets) for Species i; and α is a multiplier used for determining menu price for retailers other than fish and chip shops.
where psold FC is the proportion of the processed catch from the TDGDLF sold by processors to fish and chip shops; and pfci is the fish and chips price per kilogram (fillets) for Species i.
A summary of the assumptions and values used in the calculations is provided in Supplementary Table S1. Information on was extracted from DPIRD catch-and-effort systems. The average for the financial years from 2014–2015 to 2018–2019 was used. The flesh recovery rate of Species i (ri) was set at 0.7 for shark trunks, 0.06 for shark belly flaps and 0.35 for scalefish (Rogers 2017). The multiplier used for determining menu price (α) was set at 3.3 (Trenton Brennan, pers. comm., owner of the Ocean and Paddock restaurant). The proportion of the processed catch sold by processors (psold) to the retail (0.35), fish and chip shops (0.375) and other wholesale (0.275) sectors was obtained from the socio-economic survey. For processors, retail price (pri) and wholesale price (pwi) were obtained from the survey (random sample). For species not accounted for in the survey, species-specific prices were set to the price of ‘other sharks’ or ‘other teleost’ reported in the survey. For the fish and chips sector, the price per fillet (random sample) was obtained from an online search of menus from Western Australian fish and chip shops (164 shops). The price per kilogram (pfci) was reconstructed using an average fillet weight of 150 g (Rogers 2017). On the basis of the website search, five label types were used to advertise shark fillets: ‘gummy shark’, ‘bronze whaler’, ‘whiskery shark’, ‘sandbar shark’ and ‘shark’. The average price of ‘shark’ was used for the calculations of all shark species other than gummy sharks (M. antarcticus), dusky sharks (bronze whaler, Carcharhinus obscurus or brachyurus), whiskery sharks (F. macki) and sandbar sharks (C. plumbeus). For scalefish, fillet price information from online menus of fish and chip shops was available only for pink snapper (Chrysophrys auratus); hence, the multipliers developed by Rogers (2017) for pink snapper (hapuku, Polyprion oxygeneios), blue groper (Achoerodus gouldii) and Nannygai (Centroberyx gerrardi) were used to scale the beach prices to final-point-of-sale prices. These conversion factors consider the increase in value through the supply chain and were developed in consultation with the fishing industry. For scalefish species not accounted for by Rogers (2017), an overall factor of 3.3 was used. For species not accounted for in the questionnaire, species-specific prices were obtained from beach price information annually collected by DPIRD.
The GVA of the TDGDLF was calculated as follows:
where R is the TDGDLF annual revenue; and C is the TDGDLF annual costs (excluding taxes and wages).
where pfi is the price paid to TDGDLF fishers per kilogram (trunks for sharks, whole fish for scalefish) for Species i.
where c is the annual costs (random sample) incurred by an average vessel operating in the TDGDLF (vessel and gear repairs and maintenance, vessel lease or mortgage, fuel and lubricants, food, packaging, ice, administration), obtained from the socio-economic survey; and nTDGDLF is the total number of fishing vessels operating in the TDGDLF, obtained from DIPRD databases.
The total annual number of employees (full-time quivalents, FTEs) working in the TDGDLF (ETDGDLF) was calculated as follows:
where sTDGDLF is the number of persons employed per vessel (random sample) in the TDGDLF, obtained from the socio-economic survey.
Results
Temporal changes in ports and vessels
The number of departure ports and operating vessels significantly declined through time (Fig. 1). At the historic peak in fishing effort (1988–1989), 134 TDGDLF vessels operated from a total of 53 ports, with Esperance and Perth accounting for most of the fishing trips. By contrast, only 17 vessels remained in the fishery in 2019–2020 and operated from a total of 14 ports with Augusta, Esperance, Albany and Bunbury, accounting for the majority of the fishing trips.
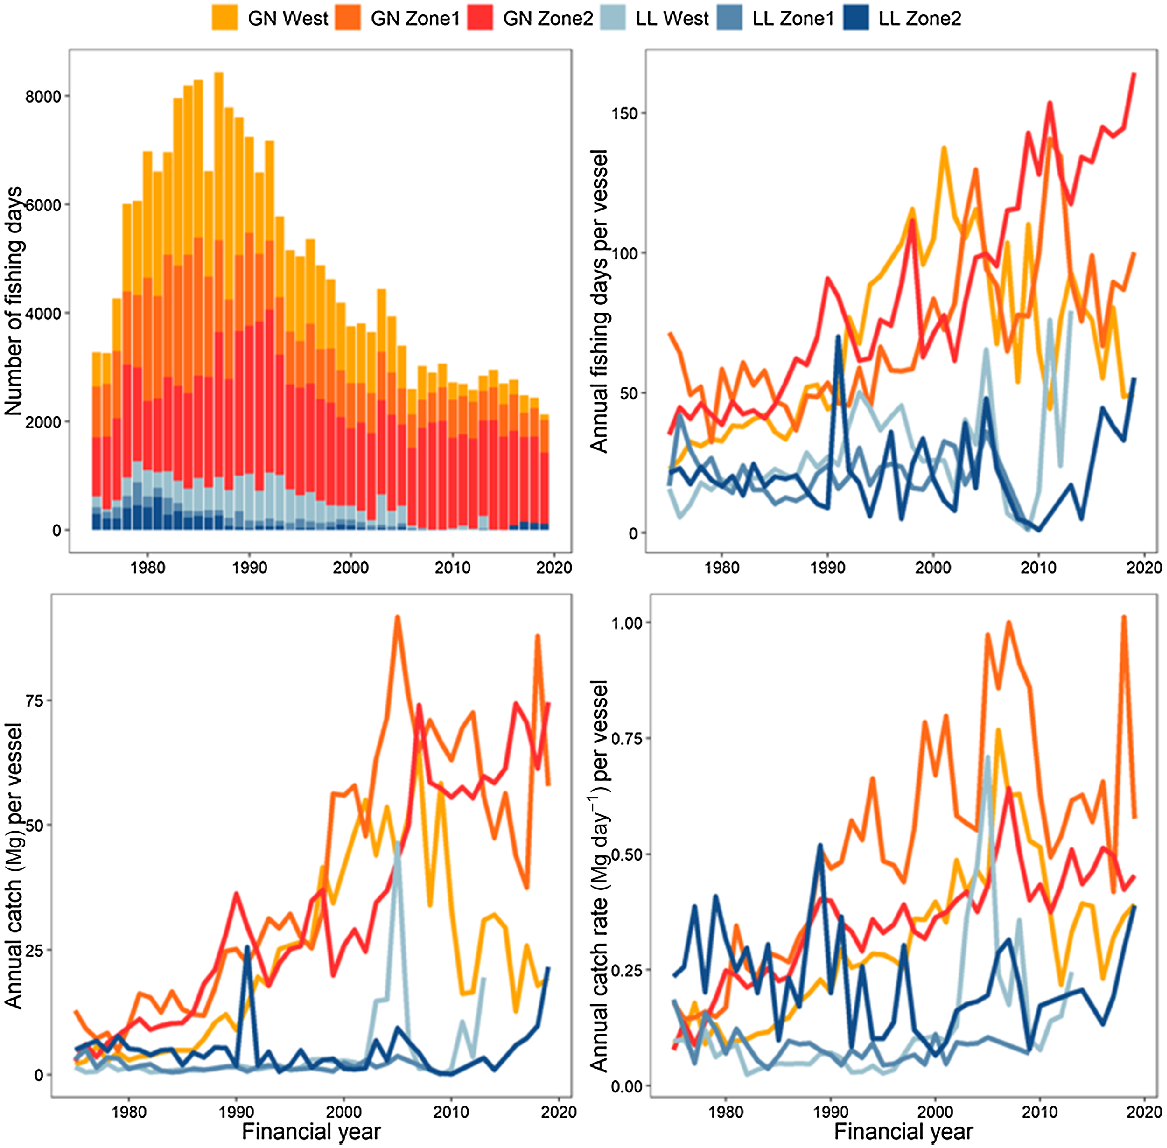
The annual number of fishing days by fishing gear and zone peaked in the late 1980s and early 1990s, but substantially decreased through time (Fig. 2). For the vessels that remained in the fishery, the average annual number of fishing days increased through time, particularly in Zone 2. Despite the number of vessels operating in the TDGDLF declining since the fishery’s peak in effort, both the average annual catch and catch rate per vessel increased with time.
Annual number of fishing days by fishing gear (GN, demersal gillnet; LL, demersal longline) and zone (top left). Also shown is the average annual number of fishing days per vessel (top right), the average annual catch per vessel (bottom left), and the average annual catch rate per vessel (bottom right) by fishing zone and fishing gear.
Socio-economic survey
Of the 33 TDGDLF fishers and processors active in the fishery and contacted, 39% (nine fishers and four processors) agreed to participate in the survey, and for those that participated, not every respondent completed all questions. Participating fishers and processors represent small-scale (<3 tonnes (Mg) per year), medium-scale (3–30 Mg year−1) and large-scale (>30 Mg year−1) operators in terms of fish landings and processing. Participating fishers have commercially fished for between 16 and 54 years (average of 38 years), all were male, had household sizes (i.e. number of persons living in the same residence) of between one and five and had home ports in the WCDGDLF (n = 1), SDGDLF Zone 1 (n = 3) and SDGDLF Zone 2 (n = 5). For these fishers, seven used demersal gillnet fishing gear, one used demersal gillnet and longline fishing gear and one used demersal longline fishing gear. All respondents owned the vessel used for commercial fishing and one respondent neither skippered the vessel nor had family members involved in the TDGDLF (Supplementary Fig. S1). For those respondents involved in the fishery, between one and six family members participated in the business. Family income derived from fishing in the TDGDLF ranged between just under 20 and 100% (Fig. S1), with fishers keeping between 10 and 50% of the total fishing revenue as personal income (Question 15, not shown).
Participating processors have processed fish for between 7 and 51 years (average of 32 years), two were male and two were husband and wife. These processors had household sizes of between two and three. Two processors owned the processing plant, whereas the other two leased (Fig. S1). Family engagement in fish processing ranged between two and five members, and between 60 and 100% of the family income originated from fish processing (Fig. S1), with processors keeping between less than 10 and 30% of the total processing revenue as personal income.
The price range paid to fishers (trunks and fins for sharks; whole fish for scalefish) and processors (fillets) is shown in Fig. S2. For fishers, average shark price ranged from A$3.5 (US$2.2) per kilogram for ‘other sharks and rays’ to A$16.5 (US$10.6) per kilogram for shark fins. Average scalefish price ranged from A$5.5 (US$3.5) per kilogram for ‘other scalefish’ to A$16.7 (US$10.7) per kilogram for dhufish. Overall, sale of shark and scalefish flesh accounted for 92% of fishers’ revenue, whereas shark fins accounted for the remaining 8%. For processors, average shark price ranged from A$19 (retail) (US$12.2) and A$14 (wholesale) (US$9) per kilogram for ‘other sharks and rays’ to A$29 (retail) (US$18.6) and A$21 (wholesale) (US$13.5) per kilogram for dusky shark. Average scalefish price ranged from A$30 (retail) (US$19.2) and A$26 (wholesale) (US$16.7) per kilogram for ‘other scalefish’ to A$60 (retail) (US$38.5) and A$56 (wholesale) (US$35.9) per kilogram for dhufish. Fishers and processors sold fins to overseas exporters, whereas processors also sold cartilage domestically (Fig. S3). Fishers sold no other shark body parts.
The range of total annual fishing revenue and costs is shown in Fig. S4. For fishers, annual revenue ranged between A$50,000 (US$32,055) and >A$500,000 (US$320,552), with annual costs ranging between <A$50,000 and A$450,000 (US$288,497). Processors did not respond this question.
A breakdown of the annual fishing and processing costs is shown in Fig. S5. For fishers, ‘crew wage’ was by far the greatest cost, followed by ‘fuel’, ‘administration’ and ‘vessel repairs’, whereas for processors, ‘fish sourcing’ was by far the greatest cost, followed by ‘personnel salaries’ and ‘administration’. For both fishers and processors, the vast majority of the costs was spent within their local (within 50 km) government area (LGA) (Fig. S6).
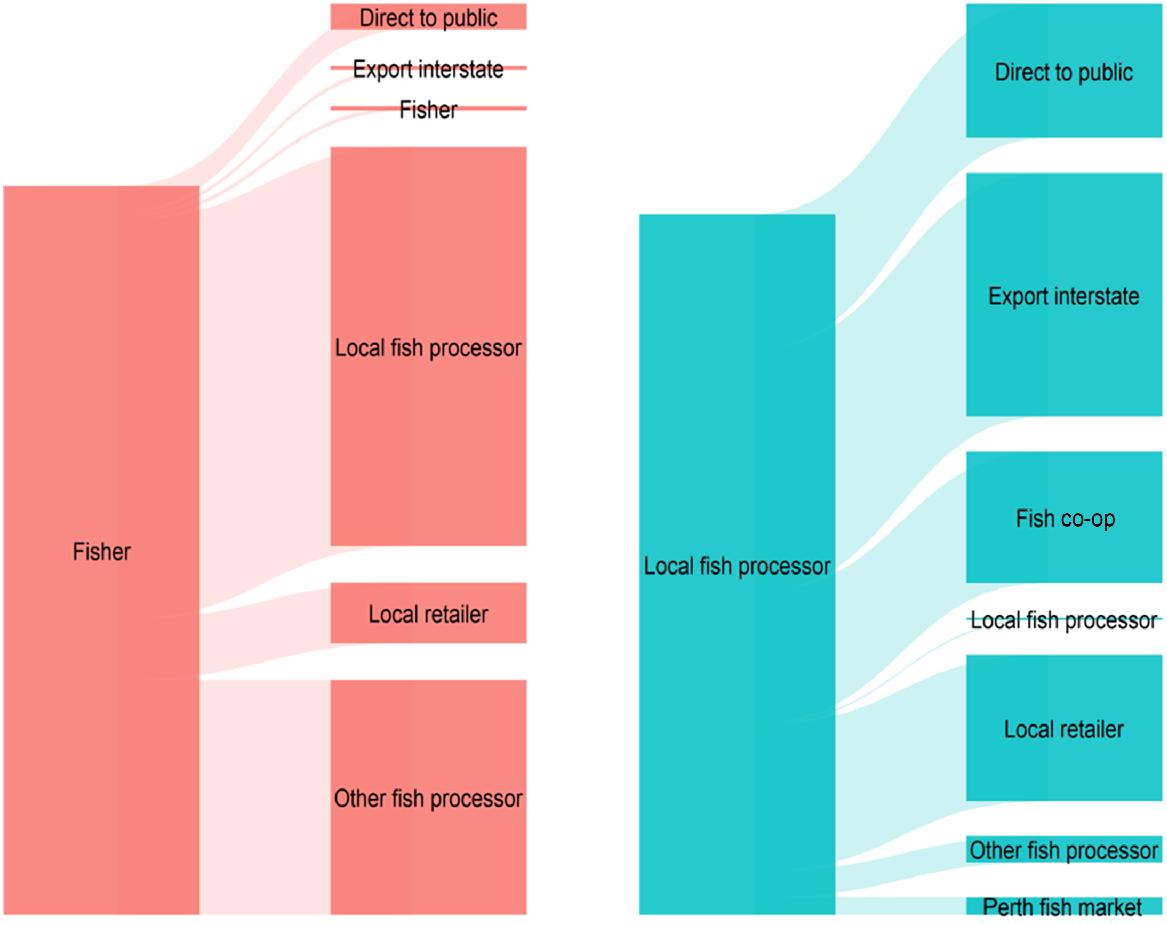
The catch destination by respondent is shown in Fig. S7 for fishers and Fig. S8 for processors and the overall catch flow is shown in Fig. 3. Most fishers sold their catch (86.9%) to fish processors (mostly local processors), with some fishers selling directly to the public, local retailers, and exporting interstate or consuming a small amount. For processors, the processed catch was mostly sold to local retailers (20.9%), direct to public (19.1%) or exported inter-state (34.8%).
Sankey plot summarising the destination of landed or processed catch (averaged across fishers or processors). Link width is proportional to catch flow.
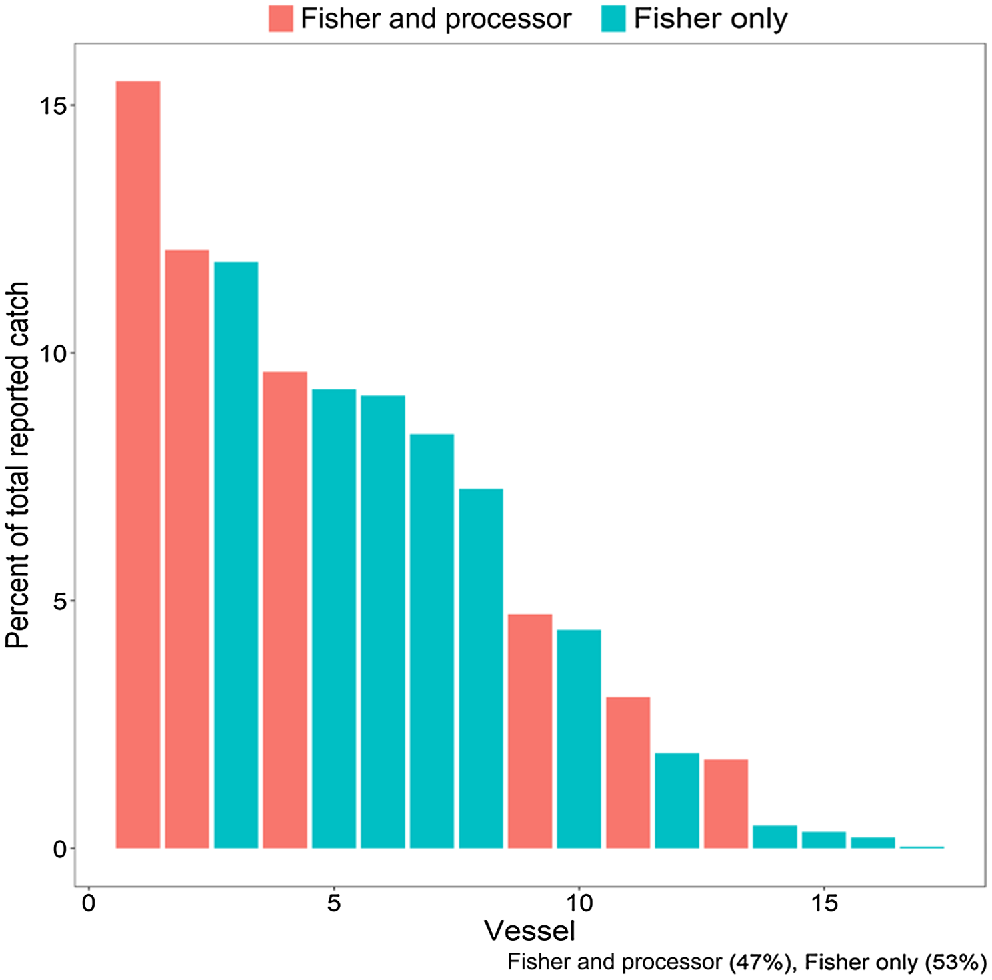
On the basis of the 2019–2020 reported landings (DPIRD database, Braccini et al. 2021b), 17 vessels participated in the fishery, from which almost 50% of landings were caught by vertically integrated fishers, i.e. operators that caught and processed the catch (Fig. 4). Of these 17 fishers, all processed sharks and rays in addition to scalefish, and six processed mostly sharks and rays, which were all sourced from the TDGDLF.
Social and economic contributions
For an average fisher, median annual net income (±95% CI) was estimated at A$56,112 (±15,100) (US$35,974). For the fishery, median annual revenue was estimated at A$5.8 × 10⁶ (±0.4 × 10⁶) (US$3.7 × 10⁶) whereas median GVA was estimated at A$2.8 × 10⁶ (±0.5 × 10⁶) (US$1.8 × 10⁶). By contrast, median market value through the supply chain was estimated at A$32.6 × 10⁶ (±2.1 × 10⁶) (US$20.9 × 10⁶). Finally, the median number of FTEs in the TDGDLF was estimated at 75.5 (±24.4), with a total number of persons estimated at 101.8 (±49.4).
Discussion
Fishing overcapacity (i.e. too many vessels chasing too few fish) results in poor social and economic performance (Hilborn 2007). For the TDGDLF, the number of vessels participating in the TDGDLF and the ports they used steadily declined through time, from >130 vessels operating from >50 ports at the fishery’s historic peak in 1988–1989 to <20 vessels operating from 14 ports in 2019–2020. However, for the vessels that remained in the TDGDLF, annual catch and catch rate per vessel increased with time, likely owing to a combination of the improvement of the status of target stocks (Braccini et al. 2021a) and technological creep (Braccini et al. 2021b). Since the historic effort peak, there has been a considerable reduction in fishing effort across this fishery following management interventions, ranging from buyback schemes to spatial closures, catch-and-effort caps and the introduction of access rights (Braccini et al. 2021a). This translated into a reduction in the number of vessel and ports participating in the TDGDLF, with an improvement in the catch and catch rate per vessel (present study) and an improvement in the stock status of the main target species (Braccini et al. 2021a).
The present study showed that fishers and processors have been involved in the TDGDLF for several decades (>30 years on average), generating most of their income from fishing in this fishery or processing products sourced from this fishery. In addition, family members are typically involved in fishing or processing. Many of the interviewed participants were over 60 years old, with some participants expressing concern about the future and succession plan for commercial fisheries in Australia (open-ended question of the questionnaire). Many coastal fisheries around the world are characterised by low incomes and an ageing fisher population (Pascual-Fernandez et al. 2020). For example, coastal communities in Norway with established dependencies on coastal fishing were completely vacated or endured out-migration and restructuring following fleet reductions and quota introduction as a result of overfishing (Hjorthen et al. 2021). In Estonia, the majority of coastal fishers work part-time because of low profitability (average income of €698 (US$715) per month for 2012) and seasonality of the catch, so they supplement their income with off-season work (Plaan 2020). More generally, global fishers’ income is below national poverty lines in 34% of the countries with available data (n = 89) (Teh et al. 2020). Low incomes typically drive the increase in fishers’ average age, with youth leaving fishery-related communities to seek better opportunities elsewhere (Plaan 2020), resulting in the ‘graying-of-the-fleet’ phenomenon (Carothers 2015). This, combined with the increasing global demand for fish (Food and Agriculture Organization of the United Nations 2020) and the use of rights-based management to improve bioeconomic outcomes can result in the consolidation of fishing rights in fewer operators and negative social and economic effects on coastal communities excluded from the distribution of fishing rights (e.g. Abbott et al. 2022).
By contrast, average annual fisher income (per person) in the TDGDLF was estimated to be A$56,112 (US$35,913), well above Australia’s poverty line of A$23,764 (US$15,235) per annum for a single adult (Davidson et al. 2020) and the international gross fishing income of US$18,960 per annum (across all fishing sectors and adjusted for inflation and standard of living) (Teh et al. 2020). In WA, finding reliable crew and skippers has become increasingly difficult in recent years because of better financial opportunities in the offshore oil and gas industry (Wright and Pyke 2010). However, second- or third-generation fishers are becoming more common in the TDGDLF, with sons skippering the vessel, while the parents administrate the business. In addition, we show evidence that fishers have adapted to improve the economic performance within the fishery. Over 35% of fishers in the TDGDLF (corresponding to ~50% of landings) are currently vertically integrated and have developed their own brand. Adding catch value by processing and selling directly to customers has become more commonplace in coastal fisheries as an effective business enhancement strategy (Plaan 2020). Some fishing families have also diversified their income streams. These strategies attempt to value add to the fishery, and build resilience to shocks, improving long-term economic sustainability.
Most of the catch landed by TDGDLF fishers was sold to processors, who, in turn, sold most of the processed catch to local retailers or direct to the public. Fishers sold only flesh and fins, whereas processors sold also cartilage. Flesh and cartilage were sold domestically, whereas fins were sold to overseas exporters. Worldwide, coastal fisheries catching sharks sell a range of other shark body parts, including liver oil, skin, jaws and teeth (Dent and Clarke 2015). In the TDGDLF, on average, fishers received A$16.5 (US$10.6) per kilogram for shark fins and between A$3.5 and $9.5 (US$2.2 and $6.1) per kilogram for shark flesh (trunks), whereas processors received between A$19 and A$30 (US$12.2 and $19.2) per kilogram for fillets. By contrast, shark flesh price is generally lower in other parts of the world. For example, fishers receive up to US$4 in Brazil, US$3.4 in the US and less than US$1 in Indonesia per kilogram for flesh (Martins et al. 2018; Ichsan et al. 2019; Ferretti et al. 2020), which may lure fishers into targeting sharks for their fins because these can attain considerably higher prices, such as US$22–$104 kg−1 for fins in Indonesia (Ichsan et al. 2019). By contrast, there is little economic incentive in the TDGDLF for ‘shark fining’, i.e. the retention of fins and the discarding of trunks. Unlike other shark fisheries, driven by the high demand for shark fins (e.g. (Jaiteh et al. 2017; Martins et al. 2018)), most of the revenue in the TDGDLF originated from the sale of shark and scalefish flesh, not shark fins, because, owing to the regulated size-selective fishing gear used in this fishery (Simpfendorfer and Unsworth 1998; McAuley et al. 2007), the catch comprises mostly small individuals (<2 m) that have small fins (McAuley and Simpfendorfer 2003).
Only 13 fishers and processors participated in the survey, which, by its voluntary nature, may suffer from self-selection bias. However, the number of participants constituted almost 40% of active fishers and processors and represented small, medium and large operators. Nevertheless, our findings must be interpreted within these limitations.
Our study has contributed novel information about the social and economic dimensions of the TDGDLF, one the world’s longest-operating shark fisheries. The TDGDLF employs an average of 102 people per annum, provides fresh seafood to local communities and has an average annual market value through the supply chain of up to A$32.6 × 10⁶ (US$20.9 × 10⁶), which is considerably larger than the reported gross value of production of A$1 × 10⁶–5 × 10⁶ (US$0.6 × 10⁶–3.2 × 10⁶) (Braccini and Blay 2018), which is typically used to value sector shares, set priorities and allocate scarce resources (McShane et al. 2021). In addition, most of the costs from TDGDLF fishers and processors are spent within LGAs, contributing to the local regional economy through the acquisition of a range of products, from fuel, gear and vessel repairs to service requirements and equipment purchases from local businesses.
Despite management interventions, and likely owing to improvements in catch rates, we have shown that the TDGDLF still provides sizeable injections into the local economy and employs >100 persons. Many other benefits of the fishery, including flow on economic effects, benefits for the seafood industry and regional identity have not been assessed here but add to the value contribution of this fishery. Our study also suggests several threats to the current economic performance of the fishery, principally an ageing fisher population, and competition with other well-paying sectors (e.g. mining and offshore oil and gas) for skilled workers. At present, family ties appear to be a strong factor in maintaining interest in the fishery, with increasing proportions of second- or third-generation fishers and evidence of succession within families. Our study is the first step towards a more comprehensive valuation of the societal contribution of the TDGDLF to the broader Western Australian community. Further research on stakeholders’ motivations, well-being and perceptions of the future could contribute to a deeper characterisation of the social dimension of this fishery. This information can be used to inform the development of social and economic objectives in a future harvest strategy for WA’s statewide shark resource. With increasing conflict in marine use in WA, between commercial and recreational fishing, offshore oil and gas, wind-farm development, marine tourism, and marine parks, quantifying the socio-economic benefits of the TDGDLF can help empower government agencies when making decisions on natural resource management. More generally, our findings contribute to assessing and balancing trade-offs between social and economic objectives of commercial fishing and other industries such as tourism, and the maintenance of biodiversity and ecosystem resilience.
Data availability
The data that support this study cannot be publicly shared due to privacy reasons and may be shared upon reasonable request to the corresponding author if appropriate.
Declaration of funding
Funding was provided by Parks Australia (grant 4-BH9DL76) by a grant to the Western Australian Fishing Industry Council (WAFIC), who contracted DPIRD.
Human ethics
The study was conducted following the principles of the National Statement on Ethical Conduct in Human Research. Study participants provided informed consent to participate in the study and for their anonymised data to be published.
Author contributions
M. Braccini, M. Watt, M. Navarro and M. Burton designed the study; M. Braccini and M. Watt collected the data; M. Braccini analysed the data; M. Braccini and M. Navarro wrote the first draft of the manuscript. All authors commented on the manuscript.
Acknowledgements
This research would not have been possible without the invaluable assistance of several professional fishers and fish processors.
References
Abbott JK, Leonard B, Garber-Yonts B (2022) The distributional outcomes of rights-based management in fisheries. Proceedings of the National Academy of Sciences 119, e2109154119.
| Crossref | Google Scholar |
Braccini M, Blay N (2018) Temperate demersal gillnet and demersal longline fisheries recource status report 2018. In ‘Status reports of the fisheries and aquatic resources of Western Australia 2016/17: the state of the fisheries’. (Eds DJ Gaughan, K Santoro) pp. 170–174. (Department of Primary Industries and Regional Development: Perth, WA, Australia)
Braccini M, Molony B, Blay N (2020) Patterns in abundance and size of sharks in northwestern Australia: cause for optimism. ICES Journal of Marine Science 77, 72-82.
| Crossref | Google Scholar |
Braccini M, Hesp A, Molony B (2021a) Risk-based weight of evidence assessment of commercial sharks in western Australia. Ocean & Coastal Management 205, 105501.
| Crossref | Google Scholar |
Braccini M, Denham A, O’Neill MF, Lai E (2021b) Spatial and temporal patterns in catch rates from multispecies shark fisheries in Western Australia. Ocean & Coastal Management 213, 105883.
| Crossref | Google Scholar |
Carothers C (2015) Fisheries privatization, social transitions, and well-being in Kodiak, Alaska. Marine Policy 61, 313-322.
| Crossref | Google Scholar |
Dent F, Clarke S (2015) State of the global market for shark products. FAO Fisheries and Aquaculture Technical Paper 590. (Food and Agriculture Organization of the United Nations: Rome, Italy) Available at https://www.fao.org/3/i4795e/i4795e.pdf
Department of Agriculture, Fisheries and Forestry (2012) National plan of action for the conservation and management of sharks 2012. Shark-Plan 2. (DAFF: Canberra, ACT, Australia) Available at https://www.agriculture.gov.au/sites/default/files/sitecollectiondocuments/fisheries/environment/sharks/sharkplan2-action.pdf
Dulvy NK, Simpfendorfer CA, Davidson LNK, Fordham SV, Bräutigam A, Sant G, Welch DJ (2017) Challenges and priorities in shark and ray conservation. Current Biology 27, R565-R572.
| Crossref | Google Scholar | PubMed |
Dulvy NK, Pacoureau N, Rigby CL, Hilton-Taylor C, Fordham SV, Simpfendorfer CA (2021) Overfishing drives over one-third of all sharks and rays toward a global extinction crisis. Current Biology 31, 4773-4787.e8.
| Crossref | Google Scholar | PubMed |
Ferretti F, Jacoby DMP, Pfleger MO, White TD, Dent F, Micheli F, Rosenberg AA, Crowder LB, Block BA (2020) Shark fin trade bans and sustainable shark fisheries. Conservation Letters 13, e12708.
| Crossref | Google Scholar |
Food and Agriculture Organization of the United Nations (2020) ‘The state of world fisheries and aquaculture 2020. Sustainability in action.’ (FAO: Rome, Italy) doi:10.4060/ca9229en
Fulton EA (2021) Opportunities to improve ecosystem-based fisheries management by recognizing and overcoming path dependency and cognitive bias. Fish and Fisheries 22, 428-448.
| Crossref | Google Scholar |
Hilborn R (2007) Managing fisheries is managing people: what has been learned? Fish and Fisheries 8, 285-296.
| Crossref | Google Scholar |
Hjorthen SL, Sund ER, Kjørholt AT, Engevold MH, Krokstad S (2021) Public health in restructuring coastal communities: generational trends in self-rated health following the decline in small-scale fishing. The HUNT study, Norway. Journal of Rural Studies 88, 307-316.
| Crossref | Google Scholar |
Ichsan M, Simeon BM, Muttaqin E, Ula S, Booth H (2019) Shark fisheries and trade characteristic in North Maluku, Indonesia. IOP Conference Series: Earth and Environmental Science 348, 012013.
| Crossref | Google Scholar |
Jaiteh VF, Hordyk AR, Braccini M, Warren C, Loneragan NR (2017) Shark finning in eastern Indonesia: assessing the sustainability of a data-poor fishery. ICES Journal of Marine Science 74, 242-253.
| Crossref | Google Scholar |
Jorgensen SJ, Micheli F, White TD, Van Houtan KS, Alfaro-Shigueto J, Andrzejaczek S, Arnoldi NS, Baum JK, Block B, Britten GL, Butner C, Caballero S, Cardeñosa D, Chapple TK, Clarke S, Cortés E, Dulvy NK, Fowler S, Gallagher AJ, Gilman E, Godley BJ, Graham RT, Hammerschlag N, Harry AV, Heithaus MR, Hutchinson M, Huveneers C, Lowe CG, Lucifora LO, MacKeracher T, Mangel JC, Barbosa Martins AP, McCauley DJ, McClenachan L, Mull C, Natanson LJ, Pauly D, Pazmiño DA, Pistevos JCA, Queiroz N, Roff G, Shea BD, Simpfendorfer CA, Sims DW, Ward-Paige C, Worm B, Ferretti F (2022) Emergent research and priorities for shark and ray conservation. Endangered Species Research 47, 171-203.
| Crossref | Google Scholar |
Larkin P (1988) The future of fisheries management – managing the fisherman. Fisheries 13, 3-9.
| Google Scholar |
Martins APB, Feitosa LM, Lessa RP, Almeida ZS, Heupel M, Silva WM, Tchaicka L, Nunes JLS (2018) Analysis of the supply chain and conservation status of sharks (Elasmobranchii: Superorder Selachimorpha) based on fisher knowledge. PLoS ONE 13, e0193969.
| Crossref | Google Scholar |
McAuley R, Simpfendorfer C (2003) Catch composition of the Western Australian temperate demersal gillnet and demersal longline fisheries, 1994 to 1999. Fisheries research report number 146. (WA Department of Fisheries: Perth, WA, Australia) Available at https://www.fish.wa.gov.au/documents/research_reports/frr146.pdf
McAuley RB, Simpfendorfer CA, Wright IW (2007) Gillnet mesh selectivity of the sandbar shark (Carcharhinus plumbeus): implications for fisheries management. ICES Journal of Marine Science 64, 1702-1709.
| Crossref | Google Scholar |
McShane P, Knuckey I, Sen S (2021) Access and allocation in fisheries: the Australian experience. Marine Policy 132, 104702.
| Crossref | Google Scholar |
Oliver S, Braccini M, Newman SJ, Harvey ES (2015) Global patterns in the bycatch of sharks and rays. Marine Policy 54, 86-97.
| Crossref | Google Scholar |
Pacoureau N, Rigby CL, Kyne PM, Sherley RB, Winker H, Carlson JK, Fordham SV, Barreto RP, Fernando D, Francis MP, Jabado RW, Herman KB, Liu K-M, Marshall AD, Pollom RA, Romanov EV, Simpfendorfer CA, Yin JS, Kindsvater HK, Dulvy NK (2021) Half a century of global decline in oceanic sharks and rays. Nature 589, 567-571.
| Crossref | Google Scholar | PubMed |
Pascoe S, Innes J, Tobin R, Stoeckl N, Paredes S, Dauth K (2016) Beyond GVP: the value of inshore commercial fisheries to fishers and consumers in regional communities on Queensland’s east coast. FRDC Project number 2013-301. (Fisheries Research and Development Corporation: Canberra, ACT, Australia) Available at http://www.saveyourlocalseafood.com/uploads/7/2/0/5/72051019/beyond_gvp_project_july_2016.pdf
Plaan J (2020) A critical insight into fisheries policies and its effects on small-scale fisheries in Estonia. In ‘Small-scale fisheries in Europe: status, resilience and governance’. MARE Publication Series 23. (Eds JJ Pascual-Fernández, C Pita, M Bavinck) pp. 519–536. (Springer: Cham, Switzerland)
Simpfendorfer C, Donohue K (1998) Keeping the fish in ‘fish and chips’: research and management of the Western Australian shark fishery. Marine and Freshwater Research 49, 593-600.
| Crossref | Google Scholar |
Simpfendorfer CA, Dulvy NK (2017) Bright spots of sustainable shark fishing. Current Biology 27, R97-R98.
| Crossref | Google Scholar | PubMed |
Simpfendorfer CA, Unsworth P (1998) Gill-net mesh selectivity of dusky sharks (Carcharhinus obscurus) and whiskery sharks (Furgaleus macki) from south-western Australia. Marine and Freshwater Research 49, 713-718.
| Crossref | Google Scholar |
Stephenson F, Mill AC, Scott CL, Stewart GB, Grainger MJ, Polunin NVC, Fitzsimmons C (2018) Socio-economic, technological and environmental drivers of spatio-temporal changes in fishing pressure. Marine Policy 88, 189-203.
| Crossref | Google Scholar |
Teh LCL, Ota Y, Cisneros-Montemayor AM, Harrington L, Swartz W (2020) Are fishers poor? Getting to the bottom of marine fisheries income statistics. Fish and Fisheries 21, 471-482.
| Crossref | Google Scholar |
Walker TI (1998) Can shark resources be harvested sustainably? A question revisited with a review of shark fisheries. Marine and Freshwater Research 49, 553-572.
| Crossref | Google Scholar |