

Genomic population structure of great hammerhead sharks (Sphyrna mokarran) across the Indo-Pacific
Naomi L. Brunjes A * , Samuel M. Williams A B C , Alexis L. Levengood A , Matt K. Broadhurst C D , Vincent Raoult E , Alastair V. Harry F , Matias Braccini F , Madeline E. Green G , Julia L. Y. Spaet H , Michael J. Travers F and Bonnie J. Holmes A
A
B
C
D
E
F
G
H
Abstract
Currently, little information exists describing the population structure of great hammerhead sharks (Sphyrna mokarran) in Australian waters.
This study used single nucleotide polymorphisms to investigate fine-scale population structure in S. mokarran across the Indo-Pacific.
DNA was extracted from 235 individuals across six Australian locations and a Red Sea outgroup. Population parameters were calculated and visualised to test structuring across locations.
No fine-scale population structuring was observed for S. mokarran across the Indo-Pacific. However, population structuring occurred for all Australian locations when compared to the Red Sea outgroup.
Findings suggest a single stock is most likely for S. mokarran found in Australian waters. Results provide key information for understanding the broad range movements of S. mokarran and help to define the scale of management required to preserve genetic diversity in this species. The structuring between Australia and the Red Sea indicates limited gene flow and movement.
Results indicate that large-scale movements of S. mokarran could be occurring to facilitate genetic mixing. Future research focusing on individual tagging to corroborate movements would be highly beneficial to determine how far (and often) individuals are dispersing, and to note where cross-jurisdictional management, including from neighbouring regions in the Indo-West Pacific–Oceania region, are most critical.
Keywords: Australia, gene flow, management scale, panmixia, population genomics, Red Sea, shark fisheries, single nucleotide polymorphisms.
Introduction
More than one-third of the world’s shark and ray species are threatened with extinction, mainly due to overfishing (Dulvy et al. 2021; Pacoureau et al. 2021). With a global listing as Critically Endangered, the great hammerhead shark (Sphyrna mokarran) is among those species of most concern (Rigby et al. 2019). Throughout its distribution across inshore and oceanic tropical and temperate waters, S. mokarran is targeted and bycaught in various commercial, recreational and artisanal fisheries (Compagno 1984; Stevens and Lyle 1989; Compagno et al. 2005). Global declines of S. mokarran (and hammerhead sharks more broadly) have been widespread and swift, approaching 99% in some regions, including off South Africa and in the Mediterranean Sea (Gallagher et al. 2014; Miller et al. 2014; Roff et al. 2018; Raoult et al. 2019). Shark finning and meat or cartilage trade are major drivers of global population declines, with the largest hammerhead species (including S. mokarran, smooth hammerheads, S. zygaena and scalloped hammerheads, S. lewini) often sought for their large fins and supposed medicinal benefits (Clarke et al. 2006; Cardeñosa et al. 2022).
Across its Australian range, S. mokarran is caught in several commercial and recreational fisheries, and often managed collectively within the Sphyrnidae family. Approximately 90% of catches originate from five regulated fishery groups, with the remaining 10% as bycatch (Department of Agriculture Water and the Environment 2021). However, overall the catches of S. mokarran within Australian waters is considered to be low, and key fishery groups are managed by precautionary jurisdictional measures that aim to limit catches and prevent overfishing. Australia’s 2014 non-detriment finding (NDF) reported that if the relevant regional fisheries remained within annual quota limits, the harvest of S. mokarran would not be detrimental to populations (Department of Agriculture, Water and the Environment 2014). Nevertheless, if hammerheads leave Australian waters, they can be exposed to other commercial and artisanal fisheries, often with fewer regulations or low monitoring and enforcement capacity (Clarke et al. 2006; Dudley and Simpfendorfer 2006).
There have been various attempts to document the migration (and connectivity) of S. mokarran, with most studies employing tagging methods. In the western North Atlantic Ocean off Florida and The Bahamas, Guttridge et al. (2017) reported the first evidence of philopatric behaviour for S. mokarran, with observations for both sexes of large-scale migrations, seasonal residency and site fidelity. In addition, Boube et al. (2023) reported sexual segregation, seasonal residency or long-term site fidelity for S. mokarran off French Polynesia, noting aggregations and the possibility of natal grounds nearby. Similarly, Queiroz et al. (2016) found that when S. mokarran were not making long distance movements, they remained in localised preferential habitats. Other recent tracking off northern Australia by Heupel et al. (2020) found localised movements but was limited to small specimens (200–240-cm total length). Although it is less precise due to rely on chemical tracers, Raoult et al. (2020) noted that adult S. mokarran captured in New South Wales (NSW) waters are likely residents further north in Queensland (Qld) and possibly as far north as Papua New Guinea. It is these challenges in obtaining local tracking data across an appropriate size and sex range that requires alternative assessment techniques to decipher stock structures and connectivity, among which genetic applications are uniquely relevant.
Identifying genetic stock structure is an integral component of fisheries management, so that the spatial scale required for the assessment and management of stocks is based on the appropriate management ‘units’; that is, the number of stocks within a given management jurisdiction (Begg et al. 1999). Over recent decades, genetic analysis has evolved into an invaluable tool for fisheries management (Benestan 2020), and nowadays complimentary to fish tagging, parasite and isotope methods. Although tagging efforts reflect individual movement and are often stochastic, genetic signatures are relevant at the population level, allowing inferences of historical connectivity or isolation (Kraft et al. 2020). Few studies have investigated genetic population structure to determine the scale of genetic structuring for S. mokarran. Previous work by Testerman et al. (2008) using mitochondrial DNA (mtDNA) found genetic differences between North Atlantic and Indo-Pacific conspecifics, with little spatial exchange of haplotypes (i.e. across ocean basins). This study further revealed significant population structuring with both microsatellites (msats) and mtDNA between samples collected in waters of the western North Atlantic, Australia, and the northern Indian Ocean (Testerman 2014). Similarly, using mtDNA, Naylor et al. (2012) reported two distinct populations of S. mokarran: one from the North Atlantic, and the second from Australia and Borneo.
Evaluation of within-basin population structure for the Atlantic and Indian oceans by Gonzalez et al. (2017), Testerman et al. (2008) and Testerman (2014) failed to note any genetic structuring. Currently, only one technical report by Heupel et al. (2020) has undertaken single nucleotide polymorphism (SNP) analysis for northern Australian specimens, revealing no evidence of structuring and a relatively homogenous panmictic population extending to Papua New Guinea. It should be noted, however, that this study had only five Australian samples. The report of Heupel et al. (2020) recommends further studies using SNPs due to their power to resolve fine-scale population structure and applications in similar species (Green et al. 2019; Green et al. 2022). Additionally, previous studies emphasise that an appropriate sample size is needed for sufficient testing, so that appropriate conclusions can be made. Considering the above limitation, we aim to evaluate: (1) the population structure or connectivity using SNPs across a number of sampled locations throughout the Australian range of S. mokarran; and (2) test for any population structuring between individuals from Australia and the Red Sea (a spatially separated outgroup).
Methodology
Sampling design and collection
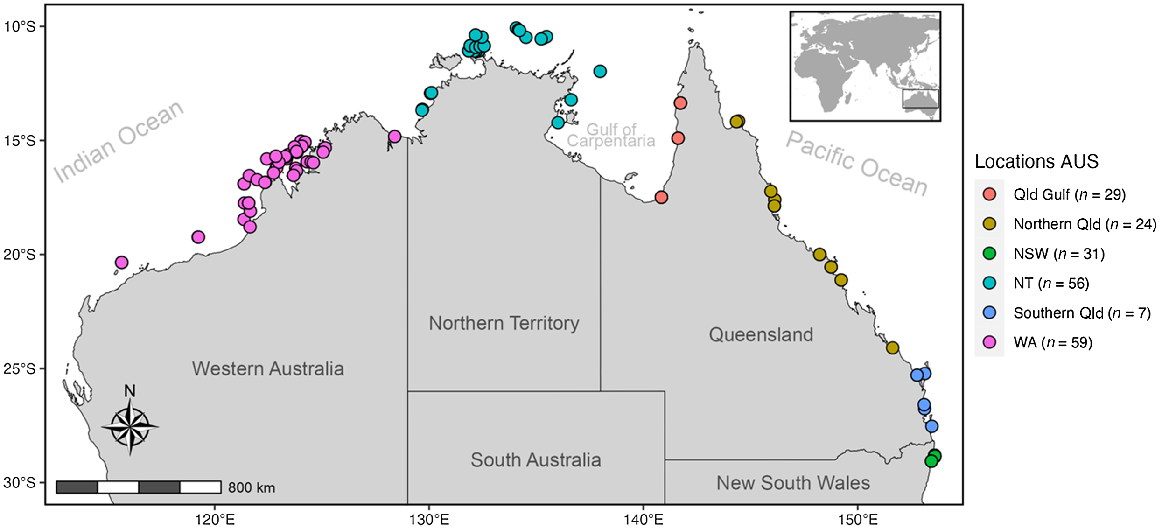
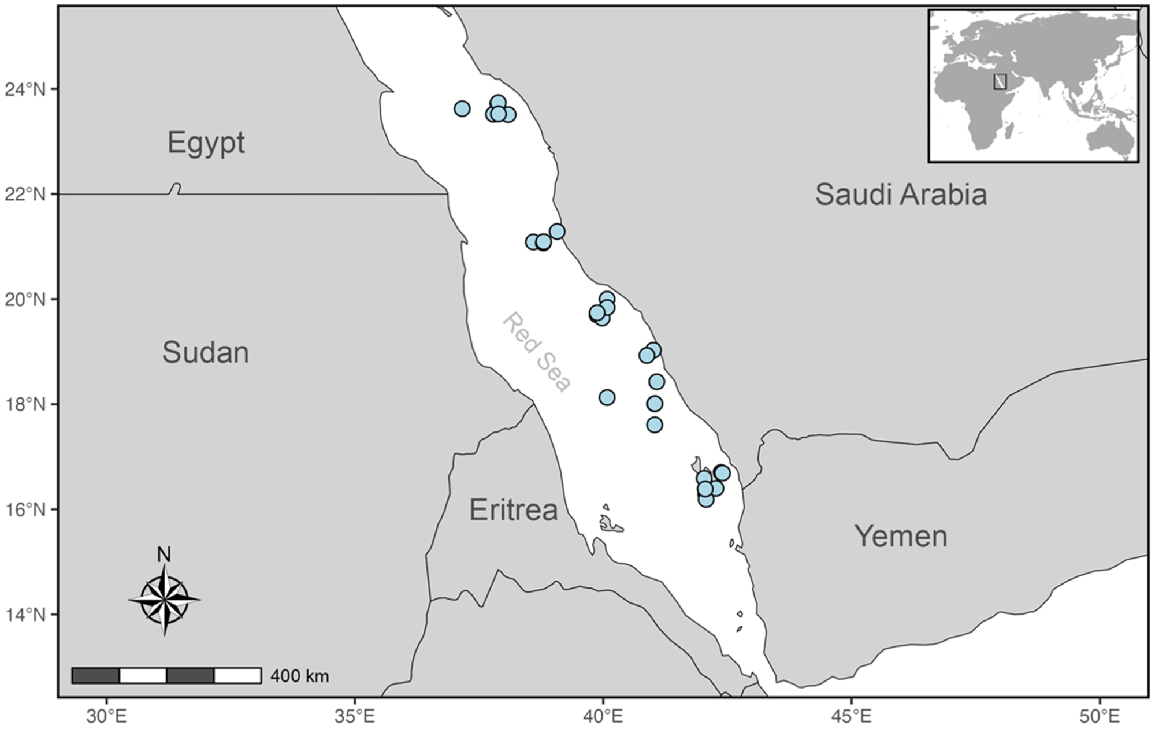
Tissue samples of S. mokarran (n = 235 individuals) were sourced from various collections across Australia (Fig. 1, Supplementary Table S1). Red Sea samples were opportunistically obtained through collaboration with Dr Julia Spaet, in order to include an outgroup. For specific collection processes see associated papers (Red Sea, Spaet and Berumen 2015; NSW, Broadhurst and Cullis 2020). Samples were either small fin clips or muscle pieces from captured specimens, stored in 99% ethanol that were provided along with data on individuals total length (TL), sex and sampling location. Samples within this study contain individuals of both sexes at varying life stages (see size distribution in Fig. S1). In addition to the Red Sea outgroup, sampling locations were arranged into Australia’s predefined current commercial fishing management zonings of Western Australia (WA), Northern Territory (NT), Queensland (Qld), Qld Gulf of Carpentaria (Gulf), north-east Qld, south-east Qld and NSW (Fig. 1 and 2).
Sampling locations for great hammerhead (Sphyrna mokarran) tissue samples across northern Australia.
This work was authorised under the University of the Sunshine Coast’s risk assessment number 210095 and ethics approval number ANA21180 from the University’s Animal Ethics Committee. Samples used in this analysis collected from within the North-west Marine Parks Network were obtained under permit numbers AU-COM2020-485, AU-COM2020-488, AU-COM2020-494, issued by the Director of National Parks, Australia. Additional samples sourced elsewhere were collected under the corresponding researchers permits and ethics.
DNA extraction, sequencing and genotyping
DNA was extracted using QIAGEN DNeasy blood and tissue kits following their outlined standard protocol (Qiagen, Valencia, CA, USA). The DNA concentrations were tested using a Nanodrop 2000 spectrophotometer machine (ThermoFisher Scientific, Waltham, MA, USA), where samples were diluted or further concentrated to obtain a concentration of between 50 and 100 ng μL−1. The DNA isolates within this range were transferred to a 96-well plate and sent to Diversity Arrays Technology for sequencing (DArT Pty Ltd, Canberra, ACT, Australia). Sequencing involved using the DArTseq (DArT Pty Ltd) protocol to uncover SNPs (variations in the DNA sequence) within the species (Kilian et al. 2012; International Society of Genetic Genealogy 2020). The DArTseq was used to significantly reduce the complexity using four restriction enzymes. Sequences were processed using DArT Pty Ltd analytical pipelines producing high-quality SNP markers and metadata. In-depth protocols for such procedures can be reviewed in Georges et al. (2018).
Single nucleotide polymorphism filtering
Of the 235 tissues sampled across the seven locations, the DArTseqTM pipeline yielded 83,579 SNP markers for 233 S. mokarran. Quantitative analyses were undertaken using the statistical package R (ver. 4.2.1, R Foundation for Statistical Computing, Vienna, Austria, see https://www.R-project.org/). The SNP data and metadata produced by DArT Pty Ltd was converted into a genlight object for further filtering using the package dartR (ver. 2.7.2, see https://cran.r-project.org/package=dartR; Gruber et al. 2018). Filtering for repeatability, loci call-rate and minor allele frequencies removed 9409, 2783 and 19,508 loci respectively (Table S2). With all populations pooled, 403 loci were removed for Hardy–Weinberg disequilibrium (Table S2). Using the gl.outflank function nested within dartR, 69 loci were identified as outliers and removed. South-east and north-east Qld were combined to form a single ‘Qld’ grouping due to a small regional sample size, similar genetic distance and non-significant FST and P-values. Following quality control procedures, 3846 putatively neutral SNPs were retained for 211 individuals, whereas 69 outlier SNPs were identified (Table S2). These individuals comprised 29 from the Gulf, 29 from east Qld, 23 from NSW, 52 from the NT, 22 from the Red Sea and 56 from WA.
An additional dataset was constructed from the filtered dataset above to support a fine-scale population structure analysis among Australian locations using high pairwise fixation indexes (FST) loci. The approach was undertaken in which outlier loci were firstly identified and removed as they are assumed to be putitively under selection that can lead to biased population differentiation estimates (Luikart et al. 2003; Maduna et al. 2024). To identify potential SNPs under selection, both pcadapt and OUTFLANK methods were used. OUTFLANK identified zero outliers whereas pcadapt observed 249, which were subsequently removed, creating a neutral dataset. To characterise fine-scale population genetic structure, the remaining loci in the neutral were ordered to high to low FST, and a subset panel was constructed by selecting the 300 neutral diagnostic SNPs with the highest locus-specific FST.
Population structure analyses
Genetic differentiation between populations was quantified through FST following Weir and Cockerham’s methods, with Bonferroni adjusted conservative alpha significance and 99% confidence intervals (CIs) through bootstrapping 2000 times (Weir and Cockerham 1984; Pembleton et al. 2013). The dartR package was used to estimate the number of alleles (n), inbreeding coefficients (FIS), observed (HO) and expected (HE) heterozygosity (Gruber et al. 2018). The function snmf(), embedded in the R package LEA (ver. 3.8.0, see https://bioconductor.org/packages/release/bioc/html/LEA.html; Frichot and Francois 2015), estimated individual admixture coefficients from the genotypic matrix, assuming K ancestral populations (Frichot and Francois 2015). The package is similar to the Bayesian clustering program STRUCTURE, but it provides a cross-entropy criterion from least-squares estimates testing 10 repetitions of scenarios K = 1–7 for the number of ancestral populations (K) that best explain a dataset (Frichot and Francois 2015).
Population differentiation was visualised through three different approaches. To identify locations, individuals were plotted with their original location (e.g. south-east and north-east Qld) and not with groupings assigned for analyses. First, a principal components analysis (PCoA) was performed to visualise population patterns and genetic similarity between individuals and locations using dartR (Gruber et al. 2018). A discriminate analysis of principal components (DAPC) without priors was conducted through the package adegenet (ver. 2.1.7, see https://cran.r-project.org/package=adegenet) to establish optimal clusters based on the Bayesian Information Criterion (BIC) (Jombart 2008). A final admixture plot was produced to visualise a geographic map of ancestry coefficients for different K scenarios using the tess3r package (ver. 1.1.0, see https://rdrr.io/github/cayek/TESS3_encho_sen/man/tess3r.html; Caye et al. 2016). Additional methods of genetic distance and isolation by distance (IBD) tests were conducted to determine if there was a correlation between gene flow and geographical distance (Gruber et al. 2018).
Results
No significant deviations in heterozygosity were found at any location (P > 0.05, HE = 0.129–0.140; HO = 0.126–0.142, Table 1). The Red Sea outgroup had greater heterozygosity than all Australian samples (HE = 0.140; HO = 0.142, Table 1). Gene flow between Australian locations was high, indicated by the inbreeding coefficient (FIS) observations being similar (FIS = 0.037–0.052, Table 1). The FIS value for the Red Sea outgroup (0.010) was closer to HWE and varied to the Australian locations (Table 1). A Euclidean distance matrix revealed non-significant population differentiation between the Australian locations and the Red Sea outgroup (Table S3).
| Location | n | HO | HE | FIS | |
|---|---|---|---|---|---|
| Gulf | 29 | 0.132 | 0.135 | 0.040 | |
| Qld | 29 | 0.134 | 0.138 | 0.052 | |
| NSW | 23 | 0.126 | 0.129 | 0.041 | |
| NT | 52 | 0.130 | 0.134 | 0.037 | |
| Red Sea | 22 | 0.142 | 0.140 | 0.010 | |
| WA | 56 | 0.133 | 0.137 | 0.037 |
n, number of individuals; HO, observed heterozygosity; HE, expected heterozygosity; FIS, inbreeding coefficient; Gulf, Queensland Gulf of Carpentaria; Qld, Queensland; NSW, New South Wales; NT, Northern Territory; RS, Red Sea; WA, Western Australia.
The estimates of genetic pairwise differentiation (FST) from samples collected between all locations were small (mean FST = 0.006). Significant gene differences were observed between samples from all Australian locations and the Red Sea outgroup (P < 0.01, Table 2), with the highest differences (FST = 0.0175) being observed between the Red Sea and Qld Gulf samples (Fig. 3 and S5). A lack of significant genetic differentiation was detected between Australian regions using the neutral dataset, with the exception of comparisons between the Qld Gulf and each of the NT, and east Qld, which showed low but significant differentiation (P < 0.01, Table 2). However, significant genetic differentiation was detected for all Australian locations when testing with the 300 diagnostic SNPs (P > 0.01, Table 3).
| NSW | WA | Qld | NT | Gulf | RS | ||
|---|---|---|---|---|---|---|---|
| NSW | 0.2525 | 0.7345 | 0.4960 | 0.0340 | 0.0000 | ||
| WA | 0.0004 | 0.0325 | 0.0135 | 0.0500 | 0.0000 | ||
| Qld | −0.0004 | 0.0008 | 0.025 | 0.001 | 0.0000 | ||
| NT | −0.000003 | 0.0007 | 0.0009 | 0.001 | 0.0000 | ||
| Gulf | 0.0014 | 0.0008 | 0.0020 | 0.0015 | 0.0000 | ||
| RS | 0.0163 | 0.0148 | 0.0144 | 0.0157 | 0.0175 |
Significant P-values (P < 0.01) shown in bold. Gulf, Queensland Gulf of Carpentaria; Qld, Queensland; NSW, New South Wales; NT, Northern Territory; RS, Red Sea; WA, Western Australia.
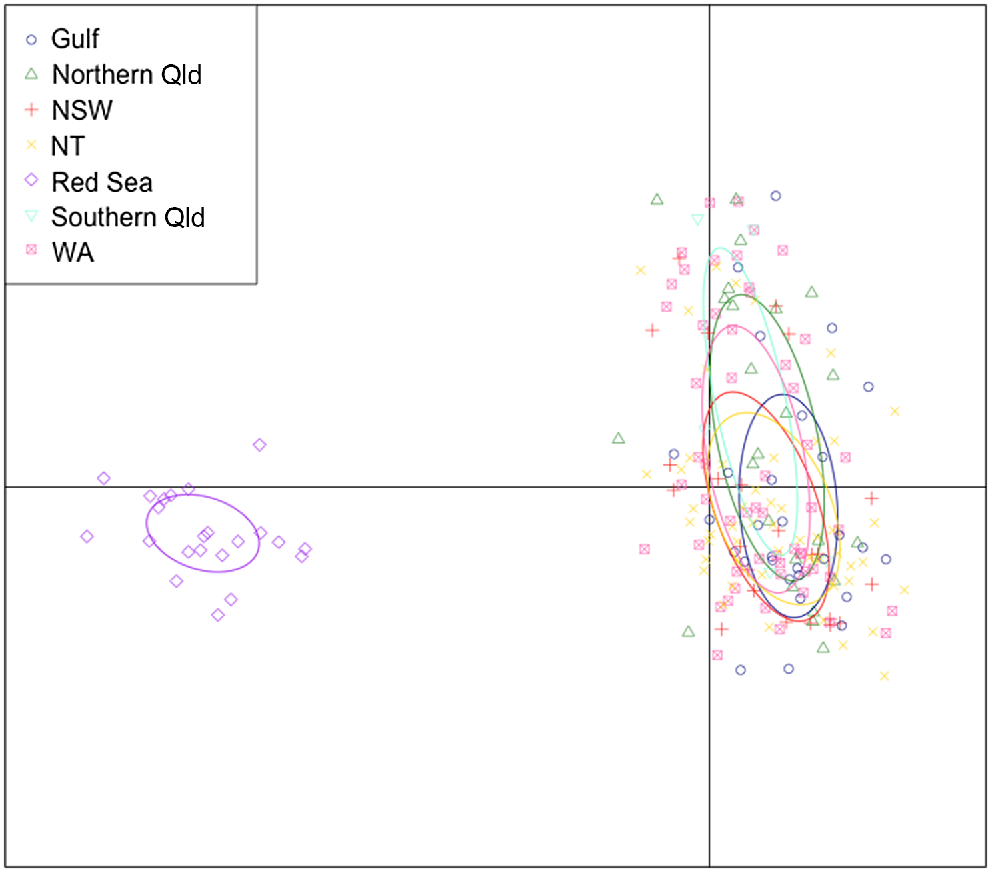
DAPC using neutral SNP genotypes, visualising Indo-Pacific structuring of great hammerhead (Sphyrna mokarran) along the first two axes. Locations (n = 7) were used as priors for clustering calculated with Bayesian Information Criterion.
| East Coast | WA | NT | Gulf | ||
|---|---|---|---|---|---|
| East Coast | 0 | 0 | 0 | ||
| WA | 0.0228 | 0 | 0 | ||
| NT | 0.0194 | 0.0203 | 0 | ||
| Gulf | 0.0322 | 0.0298 | 0.0294 |
Significant P-values (P < 0.01) shown in bold. Gulf, Queensland Gulf of Carpentaria; East Coast, Queensland and New South Wales combined; NT, Northern Territory; WA, Western Australia.
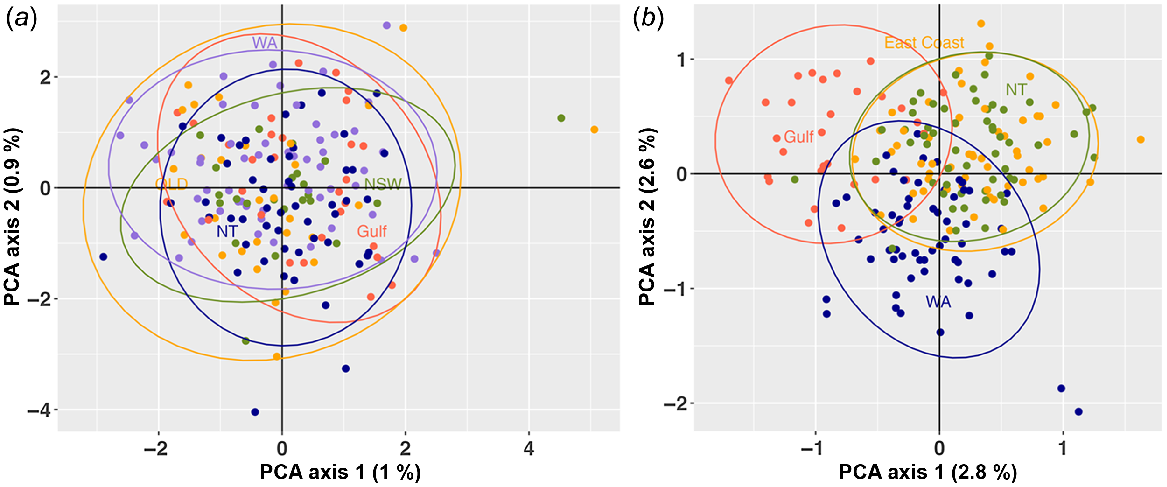
Based on the cross-entropy criterion, the optimal number of ancestral populations (K) was two (Fig. S2). Population structuring was visible from the DAPC plot with all Australian locations clustered together, whereas the Red Sea outgroup sat independently (Fig. 3). This outcome was further supported by a PCoA output which showed seperation of the Red Sea outgroup and Australian locations into two separate clusters (Fig. S5). When undertaking a hirachical investigation with the Red Sea outgroup removed, no population structuring was detected in the PCoA plot among Australian locations (Fig. 4a). Additional investigation using the diagnostic dataset of 300 of the most informative SNPs showed marginal overlap of Australian locations (Fig. 4b). With all locations connected through a central cluster, location-based variance was observed between WA, the Gulf of Carpentaria, NT and the East Coast, with overlap visualised between the latter two.
(a) Scatterplot of great hammerhead (Sphyrna mokarran) structuring for Australian only locations using PCoA modelling. The first two principal coordinate axes are shown with the amount of variance explained by each axis in parentheses. (b) PCoA modelling of great hammerhead (S. mokarran) structuring for Australian only locations using the most informative 300 diagnostic SNPs.
Population and location admixture plots showed the admixture ancestry coefficients for scenarios K = 2 and K = 3 (Fig. S3 and S4). The Red Sea outgroup showed strong differentiation and population structuring for all admixture scenarios when compared against Australian locations (Fig. S3 and S4).
Both the PCoA and DAPC were visualised for datasets against sex and maturity or immaturity. This was done for the purpose of identifying any signatures driven by various life events (i.e. pupping, residency, philopatry) from biases in size, sex or both. Nevertheless, no structuring was evident (Fig. S6 and S7).
Discussion
Here, we present the first comprehensive study assessing the fine-scale genetic population structure of selected S. mokarran populations in the Indo-Pacific, complimenting earlier efforts for conspecifics between the Atlantic and Indian oceans (Testerman et al. 2008; Testerman 2014; Gonzalez et al. 2017). Further, by analysing samples from various regional locations throughout S. mokarran’s Australian range, we have highlighted high genetic connectivity and facilitated comparisons against previous work. These results contribute to the limited genetic knowledge employing more recent next-generation sequencing techniques with the use of SNPs for greater detection of structure. The results can be discussed with respect to key life-history parameters and ultimately used to support the regional and international management of S. mokarran populations.
Australian structuring
Both the DAPC and PCoA results indicated a lack of genetic structure among S. mokarran from all sampled Australian locations. Further, the FST values (a measure of population differentiation due to genetic structure, Frankham et al. 2002) for all Australian locations (mean = 0.006) were low, indicating little genetic differentiation and high gene flow between the sampled locations, although there were some significant pairwise differences. Additionally, the diagnostic SNPs indicate low, but significant, differentiation between all Australian locations (FST mean = 0.026). This result is supported by the PCoA plot indicating marginal overlap, but not complete panmixia. Ovenden (2013) notes that elasmobranchs are likely to experience phenomena termed ‘crinkled connectivity’, whereby ‘connectivity is large enough to make the populations genetically similar, but not large enough to make them demographically linked’. This crinkled connectivity is similar to what has been observed in this study. It infers that a number of migrants are successfully exchanging genetic material across locations to comprise of a single stock, yet the proportion of migrants is not significant enough to infer complete demographic connectedness and panmixa. Waples (1998) noted that some departures from complete panmixia are expected when comparing geographic samples. It is suggested that the complete dispersal throughout northern Australia is unlikely and instead S. mokarran populations (relevant to location) are remaining connected through this crinkled connectivity method. Admixture plots also show the mixing of ancestry across all locations and so there does not appear to be fine-scale genetic population structuring for S. mokarran off Australia.
Our results suggest that broad-scale population connectivity (i.e. across the Australian coastlines) is being maintained, despite movement of tagged S. mokarran not having been recorded at this spatial scale to date (3030 km largest return trip reported in Florida, Guttridge et al. 2017). This potential for population admixture aligns with conclusions from Raoult et al. (2020) that suggest S. mokarran forage across large parts of the eastern Australian coastline. Further, S. mokarran reportedly use shallow coastal environments to target prey (Chapman and Gruber 2002; Doan and Kajiura 2020) and extend across both pelagic and oceanic shelf waters (Queiroz et al. 2016; Raoult et al. 2019). Guttridge et al. (2022) also studied the thermal and vertical range of the species, noting they primarily use shallow depths (75% at <30 m) and occupy warm waters (89% between 23 and 28°C). This range reflects the possibility for significant connectivity due to the <100 m of water connecting the Gulf of Carpentaria to the Timor Sea, Arafura Sea, Torres Strait and Gulf of Papua (National Oceanic and Atmospheric Administration 2022) as well as the continuous shallow continental shelf along Qld’s Great Barrier Reef (Dudgeon et al. 2009). This preferential habitat, to a degree, may facilitate the connectivity seen in this study around the Australian coastline. Although it is unknown what level of influence the direct long-distance movement of individuals has on the genetic homogeneity found herein, we theorise that it may be substantial and likely remains understudied. Specifically, additional tracking of S. mokarran to further understand contemporary movements, along with consideration to the spatiotemporal segregations among S. mokarran based on life-stage and sex (Harry et al. 2011; Chin et al. 2017), will be critical for understanding the species demography.
Indo-Pacific structuring
Inclusion of the Red Sea outgroup provided an important genetic comparison, revealing structuring against all Australian locations, and therefore implying no regular movement and interbreeding of individuals across the Indian Ocean. This conclusion is reinforced by within-basin structuring in the Indian Ocean (i.e. comparing the Red Sea individuals to only those in WA). The distance between the Red Sea and Australia, combined with the deep waters of the Timor Trench (2–3 km) and Wallace’s Line in Indonesia, are both regarded as potential geographical barriers between WA, northern Australia and Indonesia, preventing movement and gene flow among various species, which might explain the clear separated population structures between these regions (Ovenden et al. 2009; Chin et al. 2017). Similar restriction of genetic mixing is seen between the Atlantic and Indian oceans and often explained by the Benguela Barrier, a cold-water current flowing around the southern tip of Africa that limits transfer. This phenomenon likely reflects the genetic differences found in Atlantic and Indo-Pacific S. mokarran (Briggs 1995; Dudgeon et al. 2012; Testerman 2014). Despite such environmental barriers limiting mixing, it is possible some Red Sea and Australian specimens have nevertheless exchanged genetic material off Indonesia, or instead, the slight shared genetic signals seen in the admixture plots are a result of shared histories.
The challenge of this study was that the variance is driven only by what has been sampled. Although testing of specific groupings (i.e. immature or mature and male or female) failed to reveal any trends, the sample sizes of these specific groups was limited. Additional sampling of neonates warrants testing in future studies. Also, coupling SNPs with mtDNA would be an interesting and beneficial way to investigate if both males and females are dispersing (e.g. occurring in the blue shark, Prionace glauca; Veríssimo et al. 2017), if movement is solely male (e.g. S. lewini; Marie et al. 2019) or female mediated, or driven by natal philopatry like in other species (e.g. lemon sharks, Negaprion brevirostris; Feldheim et al. 2001). The observed trends seen in the Australian S. mokarran here could reflect broad movements of a select number of individuals resulting in the spreading of alleles across their population range. Initially, mtDNA literature noted that large movements of S. lewini were male-mediated with females exhibiting philopatry (Daly-Engel et al. 2012). However, using SNPs, large-scale movement has been shown in both sexes (Green et al. 2022). Philopatric behaviours exhibited by S. mokarran over large spatial scales have previously been discussed in the literature, yet it is unclear if these instances relate to natal philopatry, mating opportunities or functional residency behaviours like feeding events (Chapman et al. 2015; Guttridge et al. 2017; Boube et al. 2023).
Management implications and conclusions
Defining genetic connectivity and structuring of species like S. mokarran provides valuable information which can help to define populations used in stock assessment and development of biologically relevant management units (Green et al. 2022). Our study describes a genetically mixed stock of S. mokarran within Australian waters. Until more is known about the contemporary movements of S. mokarran (using tagging or telemetry), we suggest that the species is managed as a single Australian genetic population. To support this, continued research into the reproductive biology, natal or nursery areas and tagged movement for the species will be valuable.
To more effectively manage the S. mokarran population, fisheries’ harvest strategies should clearly encompass cross-jurisdictional biological assessments to determine if efforts are affording enough protection against harvest levels. Jurisdictional approaches to managing this species may have limited success in isolation if this species regularly crosses Australian jurisdictional boundaries, as implied by this study. Recent management changes within Qld have led to S. mokarran becoming a no-take species within Qld waters. These changes are likely to lead to a complete loss of data from the fishery, and will undoubtably make cross jurisdictional assessment and management for this species throughout northern Australia a more challenging process.
It is also evident that, although stringent restrictions and limits apply under Australian law for S. mokarran, this only extends to the limit of the Australian Exclusive Economic Zone (EEZ). International waters and neighbouring countries are less regulated, with high illegal, unreported and unregulated (IUU) fishing activity (Vince et al. 2021). Fishing efforts in these areas are likely to have ongoing impacts on this migratory species, which may affect Australian populations. Through further efforts of population assessments and modelling, especially in adjacent regions to the Australian EEZ, understanding of the species can be better managed with consideration of cross-jursidictional movement and exchange.
Data availability
The datasets generated during or analysed during the current study are available from the corresponding author on reasonable request.
Declaration of funding
Funding for this research was provided by the Thomas Davies Research Grant for Marine, Soil and Plant Biology (Australian Academy of Science), the Winifred Violet Scott Charitable Trust, and the Queensland Department of Agriculture and Fisheries.
Acknowledgements
We acknowledge and extend our sincerest thanks to Michael Usher, Thor Saunders, Grant Johnson, Adam Barnett, Jessica Morgan, Lenore Litherland and Tracey Scott-Holland for their generosity of samples contributing to this study. We also acknowledge the various Traditional custodians of the lands and waters on which this work was conducted.
References
Begg GA, Friedland KD, Pearce JB (1999) Stock identification and its role in stock assessment and fisheries management: an overview. Fisheries Research 43, 1-8.
| Crossref | Google Scholar |
Benestan L (2020) Population genomics applied to fishery management and conservation. In ‘Population Genomics: Marine Organisms’. (Eds MF Oleksiak, OP Rajora) pp. 399–421. (Springer International Publishing: Cham, Switzerland) doi:10.1007/13836_2019_66
Boube T, Azam C-S, Guilbert A, Huveneers C, Papastamatiou YP, Mourier J, Trujillo JE, Femmami N, Kunovsky A, Bersani F, Laurent E, Bousseyroux A, Thellier T, Follin Y, Pavy T, Jeandel V, Mataarere A, Burlot M, Bouyeure J, Rigoreau B, Rigoreau L, Lenormand A, Chalabi F, Hayek M, Jeandel J-M, Stenger P-L (2023) First insights into the population characteristics and seasonal occurrence of the great hammerhead shark, Sphyrna mokarran (Rüppell, 1837) in the Western Tuamotu archipelago, French Polynesia. Frontiers in Marine Science 10, 1234059.
| Crossref | Google Scholar |
Broadhurst M, Cullis B (2020) Mitigating the discard mortality of non-target, threatened elasmobranchs in bather-protection gillnets. Fisheries Research 222, 105435.
| Crossref | Google Scholar |
Cardeñosa D, Shea SK, Zhang H, Fischer GA, Simpfendorfer CA, Chapman DD (2022) Two thirds of species in a global shark fin trade hub are threatened with extinction: conservation potential of international trade regulations for coastal sharks. Conservation Letters 15, e12910.
| Crossref | Google Scholar |
Caye K, Deist TM, Martins H, Michel O, Francois O (2016) TESS3: fast inference of spatial population structure and genome scans for selection. Molecular Ecology Resources 16, 540-548.
| Crossref | Google Scholar | PubMed |
Chapman DD, Gruber SH (2002) A further observation of the prey-handling behavior of the great hammerhead shark, Sphyrna mokarran: predation upon the spotted eagle ray, Aetobatus narinari. Bulletin of Marine Science 70, 947-952.
| Google Scholar |
Chapman DD, Feldheim KA, Papastamatiou YP, Hueter RE (2015) There and back again: a review of residency and return migrations in sharks, with implications for population structure and management. Annual Review of Marine Science 7, 547-570.
| Crossref | Google Scholar | PubMed |
Chin A, Simpfendorfer CA, White WT, Johnson GJ, McAuley RB, Heupel MR (2017) Crossing lines: a multidisciplinary framework for assessing connectivity of hammerhead sharks across jurisdictional boundaries. Scientific Reports 7, e46061.
| Crossref | Google Scholar |
Clarke SC, McAllister MK, Milner-Gulland EJ, Kirkwood GP, Michielsens CGJ, Agnew DJ, Pikitch EK, Nakano H, Shivji MS (2006) Global estimates of shark catches using trade records from commercial markets. Ecology Letters 9, 1115-1126.
| Crossref | Google Scholar | PubMed |
Compagno LJV (1984) Sharks of the world. An annotated and illustrated catalogue of shark species known to date. Part 2: Carcharhiniformes. FAO Fish Synopsis 4, pp. 251–655. (Food and Agriculture Organization of the United Nations: Rome, Italy) Available at https://www.fao.org/3/ad123e/ad123e00.htm
Daly-Engel TS, Seraphin KD, Holland KN, Coffey JP, Nance HA, Toonen RJ, Bowen BW (2012) Global phylogeography with mixed-marker analysis reveals male-mediated dispersal in the endangered scalloped hammerhead shark (Sphyrna lewini). PLoS ONE 7, e29986.
| Crossref | Google Scholar | PubMed |
Department of Agriculture Water and the Environment (2021) Fisheries and the environment: Environment Protection and Biodiversity Conservation Act 1999. (DAWE) Available at https://www.dcceew.gov.au/environment/marine/fisheries [Verified 25 May 2022]
Doan MD, Kajiura SM (2020) Adult blacktip sharks (Carcharhinus limbatus) use shallow water as a refuge from great hammerheads (Sphyrna mokarran). Journal of Fish Biology 96, 1530-1533.
| Crossref | Google Scholar | PubMed |
Dudgeon CL, Broderick D, Ovenden JR (2009) IUCN classification zones concord with, but underestimate, the population genetic structure of the zebra shark Stegostoma fasciatum in the Indo-West Pacifc. Molecular Ecology 18, 248-261.
| Crossref | Google Scholar | PubMed |
Dudgeon CL, Blower DC, Broderick D, Giles JL, Holmes BJ, Kashiwagi T, Krück NC, Morgan JAT, Tillett BJ, Ovenden JR (2012) A review of the application of molecular genetics for fisheries management and conservation of sharks and rays. Journal of Fish Biology 80, 1789-1843.
| Crossref | Google Scholar | PubMed |
Dudley SFJ, Simpfendorfer CA (2006) Population status of 14 shark species caught in the protective gillnets off KwaZulu–Natal beaches, South Africa, 1978–2003. Marine and Freshwater Research 57, 225-240.
| Crossref | Google Scholar |
Dulvy NK, Pacoureau N, Rigby CL, Pollom RA, Jabado RW, Ebert DA, Finucci B, Pollock CM, Cheok J, Derrick DH, Herman KB, Sherman CS, VanderWright WJ, Lawson JM, Walls RHL, Carlson JK, Charvet P, Bineesh KK, Fernando D, Ralph GM, Matsushiba JH, Hilton-Taylor C, Fordham SV, Simpfendorfer CA (2021) Overfishing drives over one-third of all sharks and rays toward a global extinction crisis. Current Biology 31, 4773-4787.e8.
| Crossref | Google Scholar | PubMed |
Feldheim KA, Gruber SH, Ashley MV (2001) Multiple paternity of a lemon shark litter (chondrichthyes: Carcharhinidae). Copeia 2001, 781-786.
| Crossref | Google Scholar |
Frichot E, Francois O (2015) LEA: an R package for landscape and ecological association studies. Methods in Ecology and Evolution 6, 925-929.
| Crossref | Google Scholar |
Gallagher AJ, Hammerschlag N, Shiffman DS, Giery ST (2014) Evolved for extinction: the cost and conservation implications of specialization in hammerhead sharks. BioScience 64, 619-624.
| Crossref | Google Scholar |
Georges A, Gruber B, Pauly GB, White D, Adams M, Young MJ, Kilian A, Zhang X, Shaffer HB, Unmack PJ (2018) Genomewide SNP markers breathe new life into phylogeography and species delimitation for the problematic short-necked turtles (chelidae: Emydura) of eastern Australia. Molecular ecology 27, 5195-5213.
| Crossref | Google Scholar | PubMed |
Gonzalez C, Hammerschlag N, Gallagher A, Caballero S (2017) Population genetics of the endangered hammerhead sharks Sphyrna mokarran and Sphyrna lewini of south Florida, USA. Chapt. 2, pp. 23–49, Universidad de los Andes, Santiago, Chile. Available at https://repositorio.uniandes.edu.co/server/api/core/bitstreams/4b57570c-23ae-4e8b-91b7-e422f53acd8e/content
Green ME, Appleyard SA, White W, Tracey S, Devloo-Delva F, Ovenden JR (2019) Novel multimarker comparisons address the genetic population structure of silvertip sharks (Carcharhinus albimarginatus). Marine and Freshwater Research 70, 1007-1019.
| Crossref | Google Scholar |
Green ME, Appleyard SA, White WT, Tracey SR, Heupel MR, Ovenden JR (2022) Updated connectivity assessment for the scalloped hammerhead (Sphyrna lewini) in Pacific and Indian Oceans using a multi-marker genetic approach. Fisheries Research 251, 106305.
| Crossref | Google Scholar |
Gruber B, Unmack PJ, Berry OF, Georges A (2018) dartR: an R package to facilitate analysis of SNP data generated from reduced representation genome sequencing. Molecular Ecology Resources 18, 691-699.
| Crossref | Google Scholar | PubMed |
Guttridge TL, Van Zinnicq Bergmann MPM, Bolte C, Howey LA, Finger JS, Kessel ST, Brooks JL, Winram W, Bond ME, Jordan LKB, Cashman RC, Tolentino ER, Grubbs RD, Gruber SH (2017) Philopatry and regional connectivity of the great hammerhead shark, Sphyrna mokarran in the US and Bahamas. Frontiers in Marine Science 4, 3.
| Crossref | Google Scholar |
Guttridge TL, Müller L, Keller BA, Bond ME, Grubbs RD, Winram W, Howey LA, Frazier BS, Gruber SH (2022) Vertical space use and thermal range of the great hammerhead (Sphyrna mokarran), (Rüppell, 1837) in the western north Atlantic. Journal of Fish Biology 101, 797-810.
| Crossref | Google Scholar | PubMed |
Harry AV, Tobin AJ, Simpfendorfer CA, Welch DJ, Mapleston A, White J, Williams AJ, Stapley J (2011) Evaluating catch and mitigating risk in a multispecies, tropical, inshore shark fishery within the Great Barrier Reef World Heritage Area. Marine and Freshwater Research 62, 710-721.
| Crossref | Google Scholar |
International Society of Genetic Genealogy (2020) Single-nucleotide polymorphism. (ISGG) Available at https://isogg.org/wiki/Single-nucleotide_polymorphism/en
Jombart T (2008) adegenet: a R package for the multivariate analysis of genetic markers. Bioinformatics 24, 1403-1405.
| Crossref | Google Scholar | PubMed |
Kilian A, Wenzl P, Huttner E, Carling J, Xia L, Blois H, Caig V, Heller-Uszynska K, Jaccoud D, Hopper C, Aschenbrenner-Kilian M, Evers M, Peng K, Cayla C, Hok P, Uszynsk G (2012) Diversity arrays technology (DArT) – a generic genome profiling technology on open platforms. In ‘Data production and analysis in population genomics: methods and protocols’. (Eds F Pompanon, A Bonin) pp. 67–89. (Humana Press: New York, NY, USA)
Kraft DW, Conklin EE, Barba EW, Hutchinson M, Toonen RJ, Forsman ZH, Bowen BW (2020) Genomics versus mtDNA for resolving stock structure in the silky shark (Carcharhinus falciformis). PeerJ 8, e10186.
| Crossref | Google Scholar |
Luikart G, England PR, Tallmon D, Jordan S, Taberlet P (2003) The power and promise of population genomics: from genotyping to genome typing. Nature Reviews Genetics 4, 981-994.
| Crossref | Google Scholar | PubMed |
Maduna SN, Aspholm PE, Hansen A-SB, Klütsch CFC, Hagen SB (2024) Ecological niche modelling and population genomics provide insights into the geographic and demographic ‘explosion’ of a non-indigenous salmonid. Diversity and Distributions 30, e13811.
| Crossref | Google Scholar |
Marie AD, Stockwell BL, Rico C (2019) DNA analysis of Juvenile Scalloped Hammerhead Sharks Sphyrna lewini (Griffith, 1834) reveals multiple breeding populations and signs of adaptive divergence in the South Pacific. Frontiers in Marine Science 6, 718.
| Crossref | Google Scholar |
Miller M, Carlson J, Hogan L, Kobayashi D (2014) Status review report: great hammerhead shark (Sphyrna mokarran). (National Marine Fisheries Service and National Oceanic and Atmospheric Administration) Available at https://repository.library.noaa.gov/view/noaa/16286
National Oceanic and Atmospheric Administration (2022) Bathymetric data viewer. (NOAA, National Centers for Environmental Information) Available at https://www.ncei.noaa.gov/maps/bathymetry/ [Verified 30 October 2022]
Naylor GJP, Caira JN, Jensen K, Rosana KAM, White WT, Last PR (2012) A DNA sequence-based approach to the identification of shark and ray species and its implications for global elasmobranch diversity and parasitology. Bulletin of the American Museum of Natural History 367, 1-262.
| Crossref | Google Scholar |
Ovenden JR (2013) Crinkles in connectivity: combining genetics and other types of biological data to estimate movement and interbreeding between populations. Marine and Freshwater Research 64, 201-207.
| Crossref | Google Scholar |
Ovenden JR, Kashiwagi T, Broderick D, Giles J, Salini J (2009) The extent of population genetic subdivision differs among four co-distributed shark species in the Indo-Australian archipelago. BMC Evolutionary Biology 9, 40.
| Crossref | Google Scholar | PubMed |
Pacoureau N, Rigby CL, Kyne PM, Sherley RB, Winker H, Carlson JK, Fordham SV, Barreto R, Fernando D, Francis MP, Jabado RW, Herman KB, Liu K-M, Marshall AD, Pollom RA, Romanov EV, Simpfendorfer CA, Yin JS, Kindsvater HK, Dulvy NK (2021) Half a century of global decline in oceanic sharks and rays. Nature 589, 567-571.
| Crossref | Google Scholar | PubMed |
Pembleton LW, Cogan NOI, Forster JW (2013) StAMPP: an R package for calculation of genetic differentiation and structure of mixed-ploidy level populations. Molecular Ecology Resources 13, 946-952.
| Crossref | Google Scholar | PubMed |
Queiroz N, Humphries NE, Mucientes G, Hammerschlag N, Lima FP, Scales KL, Miller PI, Sousa LL, Seabra R, Sims DW (2016) Ocean-wide tracking of pelagic sharks reveals extent of overlap with longline fishing hotspots. Proceedings of the National Academy of Sciences 113, 1582-1587.
| Crossref | Google Scholar |
Raoult V, Broadhurst MK, Peddemors VM, Williamson JE, Gaston TF (2019) Resource use of great hammerhead sharks (Sphyrna mokarran) off eastern Australia. Journal of Fish Biology 95, 1430-1440.
| Crossref | Google Scholar | PubMed |
Raoult V, Trueman CN, Kingsbury KM, Gillanders BM, Broadhurst MK, Williamson JE, Nagelkerken I, Booth DJ, Peddemors V, Couturier LIE, Gaston TF (2020) Predicting geographic ranges of marine animal populations using stable isotopes: a case study of great hammerhead sharks in eastern Australia. Frontiers in Marine Science 7, e594636.
| Crossref | Google Scholar |
Rigby C, Barreto R, Carlson J, Fernando D, Fordham S, Francis M, Herman K, Jabado R, Liu K, Marshall A, Pacoureau N, Romanov E, Sherley R, Winker H (2019) Great hammerhead Sphyrna mokarran. In ‘The IUCN Red List of Threatened Species 2019’. e.T39386A2920499. (International Union for Conservation of Nature and Natural Resources) Available at https://www.iucnredlist.org/es/species/39386/2920499
Roff G, Brown CJ, Priest MA, Mumby PJ (2018) Decline of coastal apex shark populations over the past half century. Communications Biology 1, 223.
| Crossref | Google Scholar |
Spaet JLY, Berumen ML (2015) Fish market surveys indicate unsustainable elasmobranch fisheries in the Saudi Arabian Red Sea. Fisheries Research 161, 356-364.
| Crossref | Google Scholar |
Stevens JD, Lyle JM (1989) Biology of three hammerhead sharks (Eusphyra blochii, Sphyrna mokarran and S. lewini) from Northern Australia. Marine and Freshwater Research 40, 129-146.
| Crossref | Google Scholar |
Veríssimo A, Sampaio Í, McDowell JR, Alexandrino P, Mucientes G, Queiroz N, da Silva C, Jones CS, Noble LR (2017) World without borders—genetic population structure of a highly migratory marine predator, the blue shark (Prionace glauca). Ecology and Evolution 7, 4768-4781.
| Crossref | Google Scholar | PubMed |
Vince J, Hardesty BD, Wilcox C (2021) Progress and challenges in eliminating illegal fishing. Fish and Fisheries 22, 518-531.
| Crossref | Google Scholar |
Waples RS (1998) Separating the wheat from the chaff: patterns of genetic differentiation in high gene flow species. Journal of Heredity 89, 438-450.
| Crossref | Google Scholar |
Weir BS, Cockerham CC (1984) Estimating F-statistics for the analysis of population structure. Evolution 38, 1358-1370.
| Google Scholar | PubMed |