

General practitioner assessment of lifestyle risk factors for chronic disease: a cross-sectional study in urban, rural and remote South Australia
Antoinette Liddell A * , Lucy Brown A , Susan Williams A and David Gonzalez-Chica BA Adelaide Rural Clinical School, Faculty of Health and Medical Sciences, The University of Adelaide, Adelaide, SA 5005, Australia.
B Adelaide Rural Clinical School and Discipline of General Practice, Faculty of Health and Medical Sciences, The University of Adelaide, Adelaide, SA 5005, Australia.
Australian Journal of Primary Health - https://doi.org/10.1071/PY23035
Submitted: 8 March 2023 Accepted: 25 May 2023 Published online: 23 June 2023
© 2023 The Author(s) (or their employer(s)). Published by CSIRO Publishing on behalf of La Trobe University. This is an open access article distributed under the Creative Commons Attribution-NonCommercial-NoDerivatives 4.0 International License (CC BY-NC-ND)
Abstract
Background: The assessment and management of the SNAP lifestyle risk factors (smoking, nutrition, alcohol intake and physical activity) is fundamental to primary prevention of chronic disease. This study investigates the prevalence of SNAP assessments conducted in South Australian general practice, according to patient risk profiles, and across urban, rural and remote locations.
Methods: A cross-sectional population-based survey was conducted in South Australia in 2017. Survey data included information on health characteristics, lifestyle risks and general practitioner (GP) assessments for 2775 participants, aged ≥18 years, who visited a GP in the past 12 months. The main outcome measure was assessment for two or more (≥2) SNAP risks in this time. Logistic regression models were used to estimate the prevalence of ≥2 SNAP assessments by remoteness area, using the Modified Monash Model (MMM) classifications for urban (MMM), rural (MMM3-4) and remote (MMM5-6), and adjusting for sociodemographic, SNAP lifestyle risks and clinical variables.
Results: Of the 2775 participants (mean age 49.1 ± 18.7 years; 52.7% women), 32% were assessed for ≥2 SNAP in the past 12 months. The adjusted prevalence of assessments was higher in rural (43.8%; 95% CI 36.4–51.2%) than urban (29.7%; 95% CI 27.2–32.2%) or remote (34.7%; 95% CI 28.4–41.0%) areas. Depending on rurality, ≥2 SNAP assessments were 2.5–3.4 times more likely among participants with existing cardiovascular disease, and two to seven times more likely among participants with three or four SNAP risk factors (P < 0.05 in all cases).
Conclusion: Greater attention to GP SNAP assessments is warranted to match the prevalence of SNAP risks across South Australia.
Keywords: chronic disease, family practice, general practice, health risk behaviours, lifestyle risk reduction, primary prevention, rural health.
Introduction
A significant burden of chronic disease in Australia is attributable to lifestyle risk factors of smoking, nutrition, alcohol and physical activity (SNAP), which are linked to chronic diseases, such as hypertension, hyperlipidaemia, type 2 diabetes, obesity and cardiovascular disease (CVD; AIHW 2021a, 2021b). In 2011–2012, two-thirds of the adult population (66%) had three or more lifestyle or biomedical risk factors at the same time (AIHW 2015). Managing SNAP risk factors is fundamental to primary prevention of CVD and other chronic diseases, and the Royal Australian College of General Practitioners (RACGP) guidelines recommend routine and/or opportunistic screening for SNAP risks, with regular assessments depending on age and risk of disease (RACGP 2015, 2016).
The burden of chronic disease and the prevalence of SNAP risk factors are higher in rural and remote populations in Australia (AIHW 2021a, 2022a). An estimated 8.6% of the total burden of chronic disease is attributed to smoking, and remote/very remote areas have a higher proportion of daily smokers (19.6% aged ≥14 years) compared with major cities (9.7%; AIHW 2021b). Adults in outer regional and remote areas are also 1.7 times more likely to exceed alcohol consumption guidelines (i.e. more than two standard drinks per day) than those in major cities (24.4% and 14.7%, respectively; AIHW 2022a). Adherence to dietary and physical activity guidelines is poor across Australia, with less than one in 10 adults meeting the recommendations for daily vegetable consumption (AIHW 2022b), and 55% not meeting physical activity guidelines in 2017–2018 (AIHW 2020). Fewer adults in outer regional and remote areas (47%) meet the daily fruit recommendation (i.e. two serves per day) compared with major cities (52%; AIHW 2022b). Rural and remote populations can face barriers to accessing affordable healthy food; furthermore, they have higher levels of socioeconomic disadvantage and reduced access to healthcare services (National Rural Health Alliance 2017).
The higher distribution of at-risk patients and reduced access to health services in rural and remote areas increases the importance of SNAP assessments in rural general practice. Overall, the level of assessment performed by GPs is variable, with some studies reporting <20% of patients being assessed for specific lifestyle risk factors (Amoroso et al. 2005; Denney-Wilson et al. 2010; Passey et al. 2010; Gonzalez-Chica et al. 2019). Differences in SNAP assessment and counselling between urban and rural GPs have also been reported. Using the ‘Bettering the Evaluation and Care of Health’ data, Beattie et al. (2017) reported that rural GPs in Western Victoria (n = 101 GPs and 10 100 patients) were less likely to provide advice and counselling for diet and exercise than their state and national counterparts, despite the higher prevalence of these risk factors in rural populations. Another study including 63 GPs and practice nurses in NSW reported rural clinicians were less likely to provide lifestyle advice about smoking compared with urban clinicians (83% vs 100%), and were generally less positive about the benefits of lifestyle counselling for their patients (Passey et al. 2010). These studies suggest there is scope to improve SNAP assessment and counselling in general practice, especially in rural settings. (Passey et al. 2010; Allenby et al. 2016; Beattie et al. 2017; Gonzalez-Chica et al. 2019). Still, additional evidence is required to assess the magnitude of this urban–rural gap to guide public health policies.
The main aims of this study were: (1) to investigate the prevalence of SNAP assessments performed by the GP in the past 12 months using a large population-based survey from South Australia, (2) to compare whether SNAP assessments differed depending on the remoteness of residence, and (3) to identify if patients at a higher risk or with existing chronic conditions were more likely to have their SNAP assessed in urban or rural settings.
Methods
A cross-sectional population-based survey (Health Omnibus Survey) was conducted in South Australia between September and December 2017 by Harrison’s Research (Taylor et al. 2006). Details of the sampling process have been reported previously (Taylor et al. 2006; Gonzalez-Chica et al. 2019) Briefly, a multistage non-replacement sampling process was used to select a random sample of all individuals aged ≥15 years in the state. From the total 4188 Statistical Areas Level 1 (SA1s), 398 major city and 132 rural or remote SA1s were selected, based on the Accessibility/Remoteness Index of Australia classification (ABS 2016). Due to logistical constraints, very remote areas were not sampled. Ten households were randomly selected from each SA1, and a face-to-face interview was conducted with one randomly selected resident from each household. Interviews included questions about self-reported health conditions, SNAP lifestyle risks, health service use in the past 12 months and sociodemographics. Individuals with a terminal illness or a mental incapacity (n = 60), or unable to speak English (n = 77) were ineligible for the study. Of the 4320 eligible participants, 1343 refused to answer the survey, providing a final sample of 2977 individuals (68.9%). Only those aged ≥18 years who visited a GP in the past 12 months were included in our analyses (n = 2775).
Outcome
The RACGP guidelines recommend assessment for SNAP opportunistically and/or routinely, ranging from every 6 months to 2 years, depending on individual risk factors and the presence of medical conditions (e.g. diabetes, hypertension, obesity, CVD etc.; RACGP 2015). Therefore, as it is not expected that all SNAP factors are checked during the same consultation or with the same periodicity, we defined the assessments of two or more (≥2) SNAP factors in the past 12 months as the primary outcome of our study. Participants in the Health Omnibus Survey were asked if they had visited a GP in the past year and if, in any of their visits, the GP assessed each of the SNAP factors using the following four binary (yes/no) questions: ‘During the last year, i.e. since <MONTH> 2016, in any of your visits to see a general practitioner (GP), did he/she do any of the following: (1) talk/ask about your diet or what you are eating; (2) talk/ask about your physical activity level; (3) talk/ask about smoking; (4) talk/ask about drinking alcohol?’. From these responses, another binary indicator variable was defined according to whether ≥2 SNAP factors were assessed by a GP in the past 12 months. Assessments for each of the SNAP factors were included as secondary outcome measures.
Independent variables
Geographic remoteness of the place of residence was defined using the Modified Monash Model (MMM) classification (Australian Government Department of Health 2021). For analysis, we reclassified these areas as urban (MMM1-2 – major cities and regional centres), rural (MMM3-4 – large and medium rural towns) or remote (MMM5-6 – small rural towns and remote communities).
The presence of current SNAP risk factors was investigated using separate questions for smoking status, daily frequency of fruit or vegetable intake, alcohol consumption (frequency and quantity) and weekly frequency of moderate/vigorous physical activity, as detailed in a previous publication (Gonzalez-Chica et al. 2017). Binary variables for the presence of SNAP risk factors were defined to indicate: (1) current smoking, (2) non-compliance with daily fruit and vegetable intake (less than five portions of fruit and/or vegetables/day), (3) alcohol intake above recommendations (more than two standard drinks/day), and (4) physical inactivity (<30 min of moderate/vigorous intensity physical activity on most days or equivalent to <150 min/week). The number of SNAP risks was added up and then categorised as none (i.e. participant meets all SNAP recommendations), one, two, three or four SNAP risk factors.
The diagnosis of CVD or its biomedical risk factors was self-reported (‘Has a doctor ever told you that you have…?’) and included separated questions for high blood pressure, high cholesterol, diabetes and CVD (including myocardial infarction, angina, heart failure, stroke). These conditions were considered ‘current’ if the participant was taking any medication for that condition or if they had visited a GP in the past 6 months to manage it. Obesity was defined as a body mass index ≥30.0 kg/m2 (WHO 2003), and estimated based on self-reported weight and height. Participants were then classified as: (1) none (not at risk or with CVD), (2) currently at risk of CVD (either with high blood pressure, high cholesterol, diabetes or obesity, but not with a CVD), or (3) currently with CVD.
Covariates
Sociodemographic variables included those found to be associated with the frequency of SNAP risk factors (AIHW 2015), as these variables may also influence GP assessment. These included sex (female or male), age group (18–34, 35–49, 50–64, 65–79, ≥80 years), marital status (married/living with partner or single/divorced/widowed), attained educational level (up to secondary schooling, certificate/diploma/trade, Bachelor degree or higher), working status (full-/part-time work, not in the workforce, retired) and socioeconomic status. The latter was assigned using the 2016 Australian Socio-Economic Indexes for Areas Index of Relative Socioeconomic Advantage and Disadvantage (SEIFA-IRSAD), an an indicator of relative economic and social advantage/disadvantage of people and households within an area (Australian Bureau of Statistics 2011). The SEIFA-IRSAD deciles were used to generate categories for low (deciles 1–3), intermediate (deciles 4–7) or high (deciles 8–10) IRSAD.
Data analysis
All analyses were performed using StataMP 16.1 (StataCorp, College Station, TX, USA), considering clusters (SA1 area) and sampling weights (inverse probability of the individual’s selection within the household, re-weighted to the estimated population in SA in 2016; Taylor et al. 2006).
Categorical variables were expressed in percentages and presented graphically or in tables. The distribution of the primary outcome (≥2 SNAP assessed by a GP in the past 12 months) according to sociodemographic, lifestyle variables and biomedical conditions was tested using the chi-squared test of heterogeneity (Pearson) or trend (Wald), depending on the nature of the exposure variable. The same method was used to compare the distribution of all these variables according to the remoteness of residence, except for age, in this case a Wald test was used for comparison of means.
Logistic regression models were used to adjust the results for possible confounders, considering hierarchical levels of adjustment. In Model 1, all sociodemographic characteristics (age, sex, marital status, education, work status, IRSAD) and the remoteness category were included in the regression analysis. Model 2 additionally included the presence of SNAP risk factors, whereas Model 3 additionally included the presence of biomedical conditions (diabetes, high blood pressure, high cholesterol, obesity and existing CVD). The corresponding adjusted odds ratios (ORadj) and the 95% confidence intervals (95% CI) were obtained from each level of adjustment. P-values were obtained using Wald tests for heterogeneity or trend due to the use of clustered data. Determination coefficients (r2) were used to evaluate the overall model fit, whereas the variance inflation factor was investigated as an indicator of possible collinearity between the explanatory variables.
To assess if patients with higher risk factors or biomedical conditions were more likely to have ≥2 SNAP assessed in urban, rural or remote settings, a multiplicative term between remoteness classification and these independent variables (i.e. number of SNAP risks and presence of biomedical conditions) was introduced in the logistic regression models. A P-value for interaction <0.05 was considered as evidence of heterogeneity in these associations. ORadj were then used to estimate marginal adjusted probabilities (i.e. adjusted prevalence) of ≥2 SNAP assessments for each category of the independent variables stratified by the remoteness of residence and presented graphically with the corresponding 95% CI.
Results
The proportion of individuals (aged ≥18 years) who reported visiting a GP in the past 12 months was 92.2% (95% CI 90.8–93.4), and was higher in urban (93.5%; 95% CI 92.0–94.8) compared with rural (90.2; 95% CI 85.8–93.3) and remote (84.7%; 95% CI 78.8–89.2) locations (P < 0.001). These 2775 individuals (aged ≥18 years who visited their GP in the past 12 months) comprise the sample population for analysis (weighted sample 2675). As shown in Table 1, 52.7% were women, the mean age was 49.1 ± 18.7 years, 35.7% had up to secondary level of education and 77.5% lived in an urban area. Table 1 also shows the proportions with self-reported SNAP risk factors. The most frequent were inadequate fruit/vegetable consumption (67.9%) and physical inactivity (67.2%), followed by excessive alcohol intake (30.4%) and current smoking (15.3%). Furthermore, 62.1% of participants reported having two or more SNAP risk factors. Approximately 25% of participants self-reported having either high blood pressure, high cholesterol or obesity, 12.6% had diabetes and 7.9% had CVD.
| Variables | Proportion (%)A | GP assessed ≥2 SNAP factors in the past 12 monthsA | |||||
|---|---|---|---|---|---|---|---|
| Yes (%) | No (%) | P-valueB | Adjusted resultsC | ||||
| ORadj | 95% CI | P-valueD | |||||
| Total | 854.8 (32.0) | 1820 (68.0) | |||||
| Sociodemographic | |||||||
| Sex | |||||||
| Female | 52.7 | 28.0 | 72.0 | Ref | |||
| Male | 47.3 | 36.4 | 63.6 | <0.001 | 1.48 | 1.22–1.80 | <0.001a |
| Age group | |||||||
| 18–34 years | 27.9 | 35.4 | 64.6 | Ref | |||
| 35–49 years | 22.2 | 35.1 | 64.9 | 1.06 | 0.79–1.42 | ||
| 50–64 years | 25.6 | 32.7 | 67.3 | 0.90 | 0.68–1.20 | ||
| 65–79 years | 19.1 | 25.9 | 74.1 | 0.66 | 0.44–0.98 | ||
| ≥80 years | 5.2 | 18.7 | 81.4 | <0.001 | 0.42 | 0.25–0.72 | 0.017a |
| Marital status | |||||||
| Single/divorced/widowed | 35.9 | 33.8 | 66.2 | Ref | |||
| Married/living with partner | 64.1 | 30.9 | 69.1 | 0.174 | 0.85 | 0.70–1.04 | 0.122a |
| Education | |||||||
| Up to secondary | 35.7 | 31.2 | 68.8 | Ref | |||
| Certificate/diploma/trade | 38.5 | 32.5 | 67.5 | 0.98 | 0.77–1.24 | ||
| Bachelor or higher | 25.9 | 32.2 | 67.8 | 0.886 | 1.07 | 0.79–1.44 | 0.832a |
| Work status | |||||||
| Full-/part-time work | 54.0 | 34.3 | 65.7 | Ref | |||
| Not in the workforce | 21.7 | 33.6 | 66.4 | 0.96 | 0.73–1.26 | ||
| Retired | 24.4 | 25.3 | 74.7 | <0.001 | 0.97 | 0.67–1.40 | 0.390a |
| SEIFA-IRSAD | |||||||
| Low | 32.3 | 34.6 | 65.4 | Ref | |||
| Intermediate | 40.9 | 32.4 | 67.6 | 0.97 | 0.75–1.25 | ||
| High | 26.8 | 28.1 | 71.9 | 0.031 | 0.84 | 0.62–1.13 | 0.249a |
| Remoteness of residence | |||||||
| Urban | 77.5 | 29.7 | 70.3 | Ref | |||
| Rural | 13.3 | 43.8 | 56.2 | 1.87 | 1.34–2.61 | ||
| Remote | 9.2 | 33.8 | 66.2 | <0.001 | 1.26 | 0.93–1.72 | <0.001a |
| SNAP risk factors | |||||||
| Smoking | |||||||
| Non-smoker | 84.8 | 29.0 | 71.0 | Ref | |||
| Current smoker | 15.3 | 48.2 | 51.8 | <0.001 | 1.93 | 1.46–2.54 | <0.001b |
| Nutrition (fruit/vegetables) | |||||||
| ≥5 portions/day | 32.2 | 29.4 | 70.7 | Ref | |||
| <5 portions/day | 67.9 | 33.2 | 66.8 | 0.08 | 1.05 | 0.86–1.30 | 0.621b |
| Alcohol | |||||||
| ≤2 doses/day | 69.6 | 29.2 | 70.8 | Ref | |||
| >2 doses/day | 30.4 | 38.4 | 61.6 | <0.001 | 1.24 | 0.99–1.54 | 0.056b |
| Physical activity | |||||||
| ≥150 min/week | 32.8 | 28.9 | 71.1 | Ref | |||
| <150 min/week | 67.2 | 33.5 | 66.5 | 0.06 | 1.24 | 0.99–1.55 | 0.057b |
| Biomedical conditions | |||||||
| Diabetes | |||||||
| No | 87.4 | 30.1 | 69.9 | Ref | |||
| Yes | 12.6 | 55.1 | 44.9 | <0.001 | 1.69 | 1.25–2.29 | 0.001c |
| High blood pressure | |||||||
| No | 70.4 | 30.6 | 69.4 | Ref | |||
| Yes | 29.6 | 35.3 | 64.7 | 0.028 | 1.16 | 0.90–1.49 | 0.263c |
| High cholesterol | |||||||
| No | 75.5 | 29.3 | 70.7 | Ref | |||
| Yes | 24.5 | 40.1 | 59.9 | <0.001 | 1.67 | 1.30–2.13 | 0.001c |
| Obese | |||||||
| No | 74.3 | 29.6 | 70.4 | Ref | |||
| Yes | 25.7 | 41.7 | 58.3 | <0.001 | 1.56 | 1.23–1.99 | <0.001c |
| Existing CVD | |||||||
| No | 92.1 | 31.2 | 68.8 | Ref | |||
| Yes | 7.9 | 41.2 | 58.8 | 0.006 | 1.45 | 0.97–2.17 | 0.070c |
Urban (MMM1-2 – major cities and regional centres), Rural (MMM3-4 – large and medium rural towns), Remote (MMM5-6 – small rural towns and remote communities). Weighted populations: urban n = 2073; rural n = 357; remote n = 246. SNAP risk factors = current smoker; <5 portions of fruit and/or vegetables/day; >2 standard doses of alcohol/day; <150 min/week of moderate/vigorous physical activity.
SNAP, smoking, nutrition, alcohol intake, physical activity; GP, general practitioner; HOS, Health Omnibus Survey; SEIFA-IRSAD, Index of relative socioeconomic advantage and disadvantage, ORadj, adjusted odds ratio; Obese, body mass index ≥30 kg/m2 (self-reported weight and height); CVD, cardiovascular disease including myocardial infarction, angina, heart failure, stroke.
AFor participants who reported they attended a GP in the past 12 months.
BPearson’s chi-squared test of heterogeneity reported for all variables except age group and IRSAD category where Wald test for trend is reported.
CResults obtained considering three different hierarchical levels for adjustment: aModel 1: results adjusted for sociodemographic characteristics (sex, age, marital status, educational level, working status and IRSAD) and remoteness of residence; R2 = 0.026; bModel 2: Model 1 + additional adjustment for SNAP lifestyle variables; R2 = 0.039; cModel 3: Model 1 + 2 + additional adjustment for biomedical conditions; R2 = 0.071.
DWald test for heterogeneity or trend. Test for trend is reported for age group and IRSAD category.
Prevalence of ≥2 SNAP assessments and associated factors
Overall, 32.0% of participants reported having ≥2 SNAP factors assessed by a GP in the past 12 months (95% CI 29.7–34.3). Table 1 shows the variables associated with that outcome. The adjusted odds of ≥2 SNAP assessments were higher among men than women (ORadj 1.48; 95% CI 1.22–1.80), and for those living in rural (ORadj 1.87; 95% CI 1.34–2.61) compared with other remoteness areas, but the odds of being assessed decreased with age. Current smoking was the only lifestyle characteristic associated with ≥2 SNAP assessments (ORadj 1.93; 95% CI 1.46–2.54). Positive associations were observed between ≥2 SNAP assessments and the presence of diabetes (OR 1.69; 95% CI 1.25–2.29), high cholesterol (OR 1.67; 95% CI 1.30–2.13) and obesity (OR 1.56; 95% CI 1.23–1.99; Table 1). In contrast, neither high blood pressure nor CVD was associated with this outcome.
Assessment of SNAP factors according to remoteness
Table 2 summarises the distribution of the sociodemographic and SNAP risk factors, and biomedical conditions, by the remoteness of residence. Individuals living in urban areas were more likely to be younger, have a higher education level, be working full-/part-time or with a higher IRSAD than those in rural or remote areas. Smoking was the only SNAP risk factor that differed according to the remoteness area, with a prevalence 1.6–1.8 times higher in rural and remote areas than in urban areas. A higher prevalence of diabetes, high blood pressure and CVD was also observed in rural and remote areas than in urban areas, but the frequency of high cholesterol or obesity was similar in all areas.
| Variables | Proportion (%)A | P-valueB | ||
|---|---|---|---|---|
| Urban | Rural | Remote | ||
| Sociodemographic | ||||
| Sex (male) | 47.1 | 46.2 | 50.2 | 0.612 |
| Age: mean (s.d.) | 48.1 (18.0) | 50.4 (19.7) | 55.4 (21.1) | <0.001C |
| Marital status: | ||||
| Married/living with a partner | 64.0 | 65.3 | 62.6 | |
| Single/divorced/widowed | 36.0 | 34.7 | 37.4 | 0.843 |
| Education | ||||
| Up to secondary | 32.3 | 42.5 | 54.2 | |
| Certificate/diploma/trade | 38.4 | 42.4 | 33.4 | |
| Bachelor or higher | 29.3 | 15.1 | 12.4 | <0.001 |
| Work status | ||||
| Full/part-time | 55.9 | 48.7 | 45.8 | |
| Not in the workforce | 22.0 | 24.9 | 14.5 | |
| Retired | 22.2 | 26.4 | 39.8 | <0.001 |
| SEIFA-IRSAD | ||||
| Low | 26.9 | 52.3 | 49.5 | |
| Intermediate | 41.1 | 38.0 | 43.1 | |
| High | 32.0 | 9.8 | 7.4 | <0.001 |
| SNAP risk factors (% yes) | ||||
| Current smoker | 13.1 | 23.7 | 21.5 | <0.001 |
| Nutrition <5 (fruit or veg)/day | 68.6 | 65.1 | 66.0 | 0.393 |
| Alcohol >2 standard doses/day | 30.4 | 31.7 | 27.9 | 0.707 |
| Physical activity <150 min/week | 68.1 | 65.2 | 62.6 | 0.283 |
| Biomedical conditions (% yes) | ||||
| Diabetes | 11.4 | 15.6 | 18.3 | 0.001 |
| High blood pressure | 28.1 | 32.1 | 38.9 | 0.003 |
| High cholesterol | 24.2 | 24.2 | 27.8 | 0.453 |
| Obesity | 25.6 | 27.2 | 24.9 | 0.750 |
| Existing CVD | 6.8 | 10.8 | 13.7 | <0.001 |
Urban (MMM1-2 – major cities and regional centres), Rural (MMM3-4 – large and medium rural towns), Remote (MMM5-6 – small rural towns and remote communities). Weighted populations: urban n = 2073; rural n = 357; remote n = 246. SEIFA-IRSAD = Index of relative socioeconomic advantage and disadvantage; SNAP risk factors = current smoker, <5 portions of fruit and/or vegetables/day, >2 standard doses of alcohol/day; <150 min/week of moderate/vigorous physical activity.
SNAP, smoking, nutrition, alcohol intake, physical activity; HOS, Health Omnibus Survey; Obese, body mass index ≥30 kg/m2 (self-reported weight and height); CVD, cardiovascular disease including myocardial infarction, angina, heart failure, stroke.
AFor participants who reported they attended a GP in the last 12 months.
BChi-squared test for heterogeneity.
CAdjusted Wald test for equivalence of means.
Fig. 1a shows the number of self-reported SNAP risk factors was not different according to the remoteness of residence (P = 0.541), with <10% meeting all SNAP lifestyle recommendations in any area. Fig. 1b shows the prevalence of SNAP assessments according to remoteness. Overall, 9.8% (95% CI 8.4–11.3) of all participants reported the four SNAP factors were assessed by a GP in the past 12 months, with a higher frequency in rural (15.2%) and remote areas (13.3%) than in urban areas (8.4%; Fig. 1b, P-value < 0.001). Over half of all participants (51.2%; 95% CI 49.3–54.2) reported none of the SNAP factors were assessed in the past 12 months.
(a) Number of SNAP risk factors and (b) number of SNAP assessments performed by the GP in the past 12 months according to the remoteness of residence. Urban (MMM1-2 – major cities and regional centres), Rural (MMM3-4 – large and medium rural towns), Remote (MMM5-6 – small rural towns and remote communities). Weighted populations: urban n = 2073; rural n = 357; remote n = 246. SNAP = smoking, nutrition, alcohol intake, physical activity. SNAP risk factors = current smoker, <5 portions of fruit and/or vegetables/day, >2 standard doses of alcohol/day; <150 min/week of moderate/vigorous physical activity. a – Test of heterogeneity comparing the frequency of these variables according to the remoteness of residence.
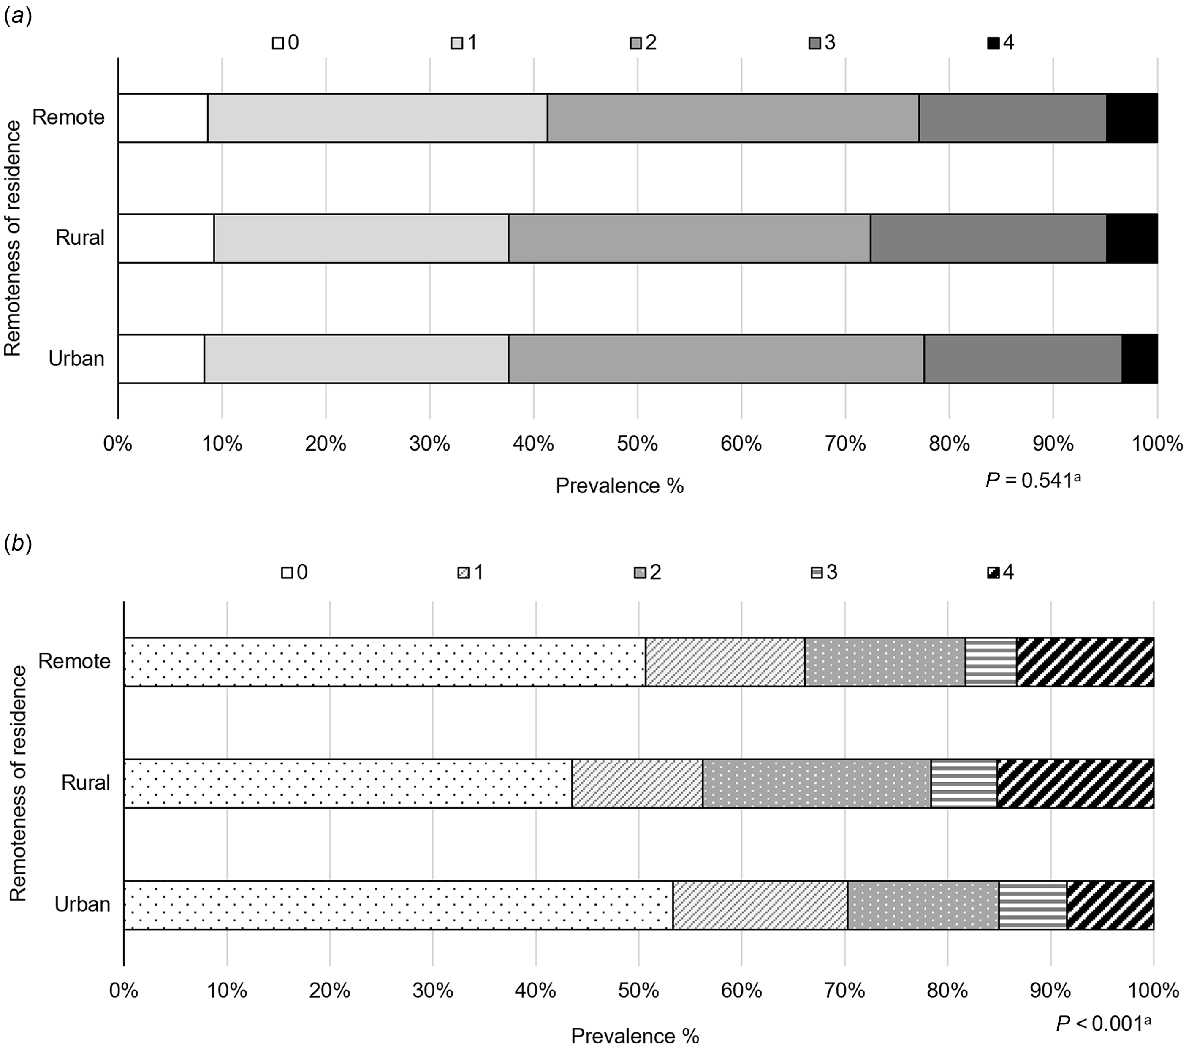
Fig. 2 shows that, after adjustment, the assessment of ≥2 SNAP factors by a GP in the past 12 months was more prevalent in rural areas (43.8%; 95% CI 36.4–51.2) than in urban (29.7%; 95% CI 27.2–32.2) or in remote areas (34.7%; 95% CI 28.4–41.0).
Adjusted prevalence of ≥2 SNAP assessments performed by the GP in the past 12 months according to the remoteness of residence. Urban (MMM1-2 – major cities and regional centres), Rural (MMM3-4 – large and medium rural towns), Remote (MMM5-6 – small rural towns and remote communities). Weighted populations: urban n = 2073; rural n = 357; remote n = 246. SNAP = smoking, nutrition, alcohol intake, physical activity. a – Adjusted prevalence (i.e. marginal adjusted probabilities) obtained using logistic regression model adjusted for sociodemographic differences across geographical areas (sex, age, marital status, educational level, working status and IRSAD). b – Test of heterogeneity comparing the prevalence of SNAP assessments according to the remoteness of residence. Vertical lines represent the 95% CI.
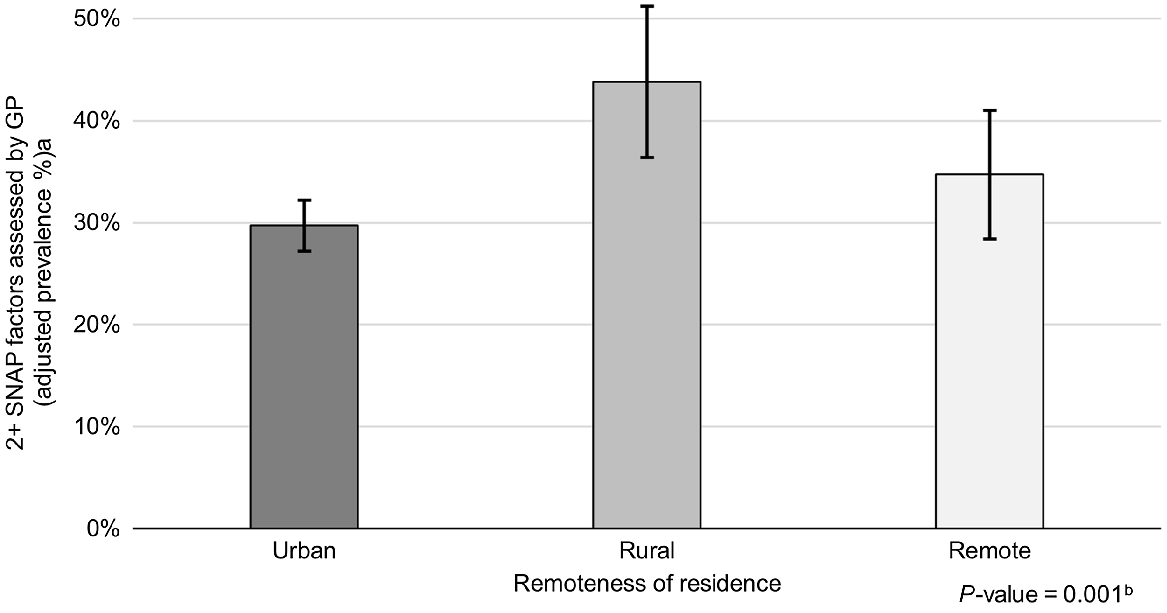
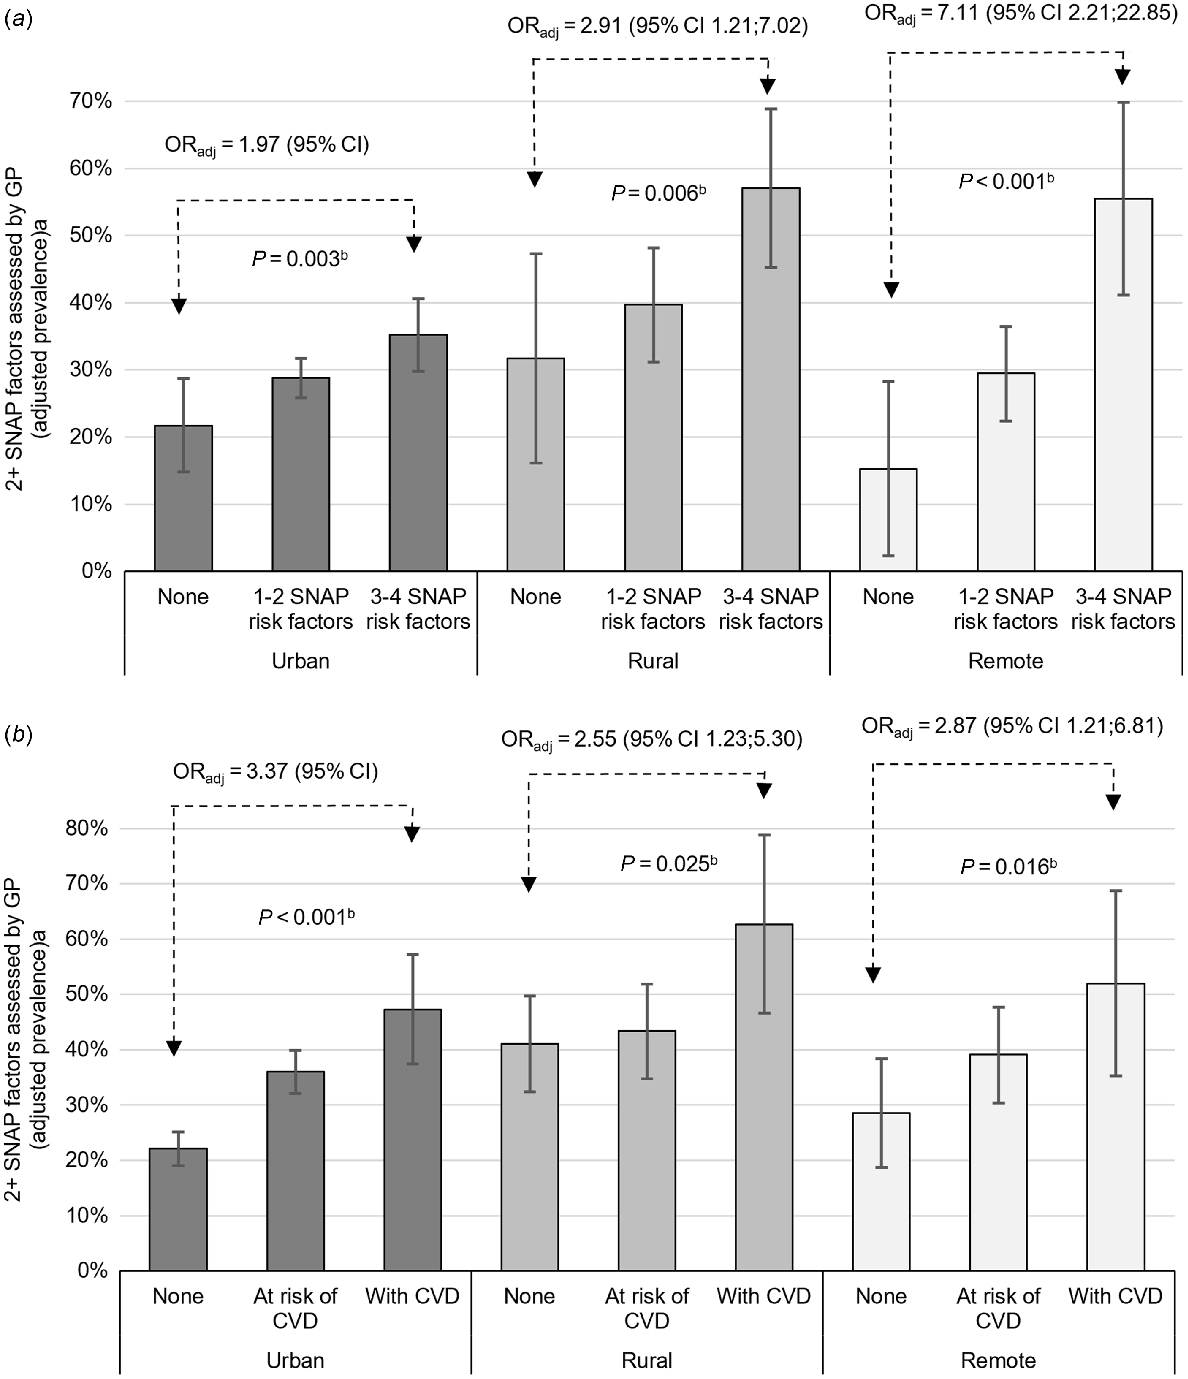
Fig. 3a shows that, irrespective of the remoteness of residence, the adjusted prevalence of ≥2 SNAP assessed by a GP in the past 12 months increased with the number of existing SNAP risk factors. However, the magnitude of the association was two to three times higher in remote areas than in urban or rural areas (P-value for interaction = 0.034). The highest prevalence of ≥2 SNAP assessments was for those living in rural (57.1%; 95% CI 45.3–68.9%) or remote areas (55.5%; 95% CI 41.1–69.8), who self-reported having three or four SNAP risk factors. Fig. 3b shows those with CVD were more likely to be assessed (~50–55%) than those at risk of CVD or with none of the biomedical conditions. In this case, the magnitude of the associations was similar in all geographical areas (P-value for interaction = 0.21).
Adjusted prevalence of ≥2 SNAP assessments performed by the GP in the past 12 months according to the remoteness of residence and (a) number of SNAP risk factors or (b) presence of biomedical conditions. Urban (MMM1-2 – major cities and regional centres), Rural (MMM3-4 – large and medium rural towns), Remote (MMM5-6 – small rural towns and remote communities). Weighted populations: urban n = 2073; rural n = 357; remote n = 246. SNAP = smoking, nutrition, alcohol intake, physical activity; ORadj = adjusted odds ratio. SNAP risk factors = current smoker, <5 portions of fruit and/or vegetables/day, >2 standard doses of alcohol/day; <150 min/week of moderate/vigorous physical activity. At risk of CVD = obese, with diabetes, hypertension and/or dyslipidaemia but no CVD. CVD = myocardial infarction/angina, heart failure and/or stroke. a – Adjusted prevalence (i.e. marginal adjusted probabilities) obtained using logistic regression models adjusted for differences across geographical areas. b – Test for trend in each geographical area. Vertical lines represent the 95% CI. P-value for interaction: SNAP risk factors*remoteness = 0.034; presence of biomedical conditions*remoteness = 0.21.
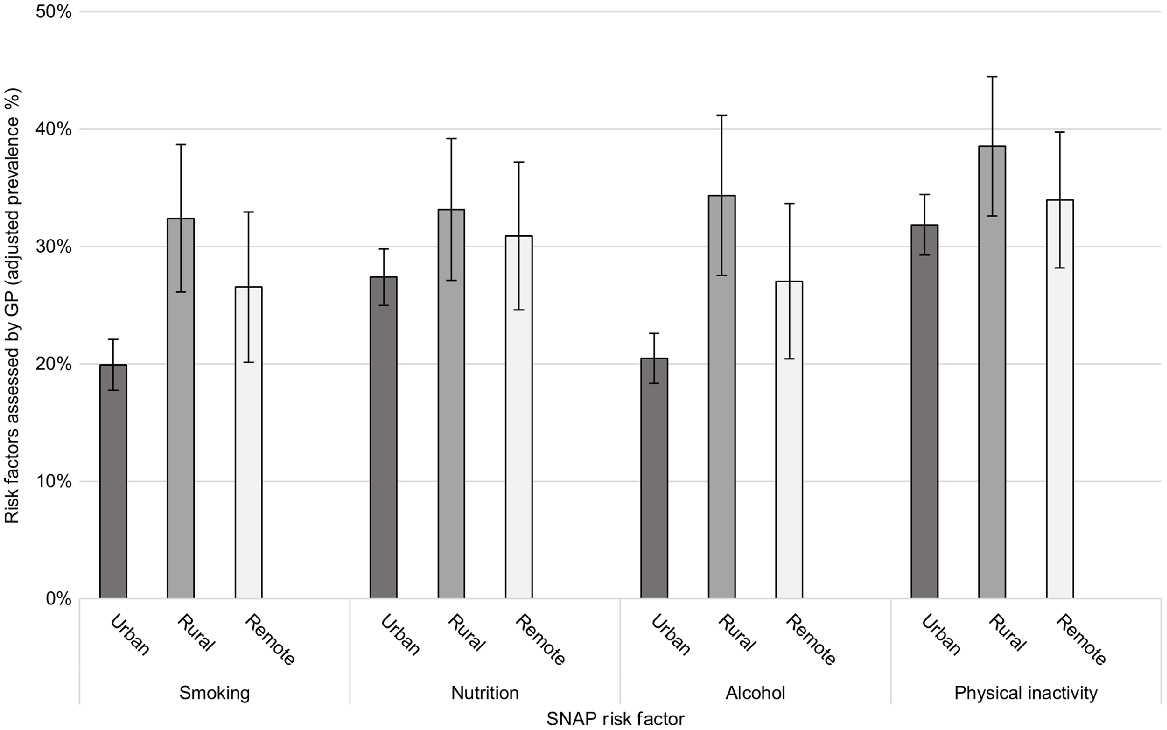
For the individual SNAP risk factors, the crude proportion of participants who reported being assessed was 32.9% for physical activity, 28.6% for nutrition, 22.7% for alcohol intake and 21.9% for smoking. Fig. 4 shows the adjusted prevalence of assessments for each of the SNAP factors, across remoteness areas. Assessments were higher in rural areas for smoking (32.4%; 95% CI 26.1–38.7; P < 0.001) and alcohol intake (34.4%; 95% CI 27.6–41.2; P < 0.001). No differences were observed for assessments for nutrition and physical inactivity across remoteness areas.
Adjusted prevalence of assessments for individual SNAP factors performed by the GP in the past 12 months according to the remoteness of residence. Urban (MMM1-2 – major cities and regional centres), Rural (MMM3-4 – large and medium rural towns), Remote (MMM5-6 – small rural towns and remote communities). Weighted populations: urban n = 2073; rural n = 357; remote n = 246. SNAP = smoking, nutrition, alcohol intake, physical activity. Adjusted prevalence (i.e. marginal adjusted probabilities) obtained using logistic regression model adjusted for sociodemographic differences across remoteness areas (sex, age, marital status, educational level, working status and IRSAD).
Discussion
Our results show that only one-third of survey participants reported being assessed for two or more SNAP factors by their GP in the past 12 months. The prevalence of assessments was higher in rural areas and among those with multiple SNAP risk factors, biomedical conditions or existing CVD. These findings suggest a greater focus on SNAP assessments for secondary rather than primary prevention in all locations.
The overall prevalence of ≥2 SNAP assessments (32%) is low when compared with the levels of SNAP risk factors in the study population, with ~60% of participants reporting the presence of two or more SNAP risks in all remoteness areas. Inadequate nutrition and physical inactivity were most common, reported by two-thirds of all participants. Additionally, approximately one-quarter of all participants reported having high blood pressure, high cholesterol or obesity. Men, smokers and those with biomedical conditions (diabetes, high cholesterol, obesity) were more likely to be assessed for ≥2 SNAP, suggesting GPs are more vigilant in assessing higher-risk patients. Men may be prioritised because of reportedly higher levels of risk factors and risk of CVD (Anand et al. 2008; Ng et al. 2020). Participants in older age groups (≥65 years) were less likely to be assessed for ≥2 SNAP, despite the risk of chronic disease increasing with age. Notably, the RACGP Red Book guidelines for preventive activities do not recommend asking about all SNAP risk factors as part of preventive activities in older age (>65 years), which may account for this finding (RACGP 2016).
The nature of GP encounters differs between urban and rural practice for a variety of reasons (Britt et al. 2001). Having fewer rural practitioners and higher levels of chronic disease would be expected to limit time for preventive care in rural consultations (AIHW 2022a). In contrast, a greater continuity of care in rural practices could increase the prevalence of SNAP assessments (Rygh and Hjortdahl 2007). We found the adjusted prevalence of ≥2 SNAP assessments was 1.5 times higher in rural areas (43.8%) compared with urban areas (29.7%). Assessments for smoking and alcohol intake were 1.6–1.7 times higher in rural areas than in urban areas, but assessments for nutrition and physical activity were similar. Assessments tended to parallel risks, as the prevalence of smoking, diabetes, high blood pressure and existing CVD were all higher in rural and remote areas compared with urban areas. Depending on the rurality, ≥2 SNAP assessments were two to seven times more likely among participants with three or four SNAP risk factors, and 2.5–3.4 times more likely among participants with existing CVD, suggesting a greater focus on assessments for secondary prevention. Alternatively, there may be more opportunities for assessments if patients are visiting the GP more frequently.
Although our findings suggest that rural GPs are assessing SNAP risks at a higher level than urban GPs, other studies have shown mixed results. In contrast to our findings, Beattie et al. (2017) found that rural GPs in Victoria provided advice on nutrition and physical activity less frequently than urban GPs, possibly because of the time required to assess and counsel. Another study in New South Wales found that rural GPs were less likely than urban GPs to provide advice about smoking (Passey et al. 2010). Denney-Wilson et al. (2010) reported that GPs generally assess smoking and alcohol more often than nutrition and physical activity, whereas our results showed higher assessments for physical activity. The lack of consensus may be explained by the different study participants (GPs or patients), study designs and settings, making it difficult to directly compare these findings. One point of consensus across these studies is that advice about lifestyle risk factors is not provided at a rate that matches their prevalence (Denney-Wilson et al. 2010; Passey et al. 2010; Beattie et al. 2017). A range of potential barriers to GP assessments have been reported, including GP attitudes, knowledge and time constraints (Beattie et al. 2017).
A key strength of this study is the use of population-based, representative survey data comprising quality-controlled interview-based assessments. Furthermore, the survey provided information for potential sociodemographic and clinical confounders in relation to GP visits and SNAP assessments. However, we cannot exclude the possibility of recall bias and misclassification, because all measures were self-reported. It is also possible that we underestimated the prevalence of SNAP assessments conducted because of the following: (1) the survey did not capture assessments conducted by practice nurses (Morris et al. 2022), (2) each SNAP factor was assessed using single binary questions, and (3) the length of the recall time for these items (12 months). Another limitation is the time elapsed since the survey was undertaken when there have been substantial changes in health-related behaviours and GP visits due to the COVID-19 pandemic (Chan et al. 2022). However, the data used in our study were from the most recent survey available in South Australia that investigated SNAP assessments by GPs (Wellbeing SA 2022). It would be timely to repeat the survey and expand it to include the growing population of non-English speaking groups, and to broaden the questions to include assessments conducted by practice nurses. Finally, we have only reported the prevalence of assessments for participants who visited their GP in the past 12 months. A greater proportion of rural/remote participants (10–15%) did not visit a GP compared with 6% of those in metropolitan areas, consistent with limited access in rural and remote areas (AIHW 2022a).
In conclusion, our results indicate that greater attention to GP SNAP assessments is warranted, especially for primary prevention, to match the high prevalence of SNAP risks across the state. The higher reporting of SNAP assessments in rural areas is commensurate with higher levels of smoking, CVD and some biomedical risks. Although GP SNAP assessments are fundamental to disease prevention, access to other rural health services and amenities may also be required to promote healthy lifestyles, and reduce the burden of chronic disease in rural and remote populations.
Acknowledgements
The authors acknowledge the participants of the 2017 Spring Health Omnibus Survey for their participation in this study.
References
ABS (2016) Australian Statistical Geography Standard (ASGS): Volume 5 – Remoteness Structure, July 2016. (Australian Bureau of Statistics) Available at http://www.abs.gov.au/ausstats/abs@.nsf/mf/1270.0.55.005 [Verified 10 December 2022]
AIHW (2020) Insufficient physical activity. (Australian Institute of Health and Welfare: Canberra, Australia) Available at https://www.aihw.gov.au/reports/risk-factors/insufficient-physical-activity [Verified 24 August 2022]
AIHW (2021b) Heart, stroke and vascular disease: Australian facts. (Australian Institute of Health and Welfare: Canberra, Australia) Available at https://www.aihw.gov.au/reports/heart-stroke-vascular-diseases/hsvd-facts [Verified 24 August 2022]
AIHW (2022a) Rural and remote health. (Australian Institute of Health and Welfare: Canberra, Australia) Available at https://www.aihw.gov.au/reports/rural-remote-australians/rural-and-remote-health#Health%20risk%20factors [Verified 7 September 2022]
AIHW (2022b) Diet. (Australian Institute of Health and Welfare: Canberra, Australia) Available at https://www.aihw.gov.au/reports/australias-health/diet [Verified 24 August 2022]
Allenby A, Kinsman L, Tham R, Symons J, Jones M, Campbell S (2016) The quality of cardiovascular disease prevention in rural primary care. Australian Journal of Rural Health 24(2), 92-98.
| Crossref | Google Scholar |
Amoroso C, Hobbs C, Harris MF (2005) General practice capacity for behavioural risk factor management: a SNAP-shot of a needs assessment in Australia. Australian Journal of Primary Health 11, 120-127.
| Crossref | Google Scholar |
Anand SS, Islam S, Rosengren A, Franzosi MG, Steyn K, Yusufali AH, Keltai M, Diaz R, Rangarajan S, Yusuf S, INTERHEART Investigators (2008) Risk factors for myocardial infarction in women and men: insights from the INTERHEART study. European Heart Journal 29(7), 932-940.
| Crossref | Google Scholar |
Australian Bureau of Statistics (2011) Census of population and housing: Socio-Economic Indexes for Areas (SEIFA), Australia. Available at http://www.abs.gov.au/ausstats/abs@.nsf/mf/2033.0.55.001 [Verified 13 September 2022]
Australian Government Department of Health (2021) Modified Monash Model. Available at https://www.health.gov.au/health-topics/rural-health-workforce/classifications/mmm [Verified 8 February 2022]
Beattie J, Binder M, Harrison C, Miller GC, Pedler D (2017) Lifestyle risk factors and corresponding levels of clinical advice and counselling in general practice. Australian Family Physician 46(10), 751-755.
| Google Scholar |
Chan K, Xue H, Carlson J, Gray JM, Bailey J, Vines R (2022) Impact of COVID-19 on lifestyle and mental wellbeing in a drought-affected rural Australian population. Rural Remote Health 22(4), 7231.
| Crossref | Google Scholar |
Denney-Wilson E, Fanaian M, Wan M, Vagholkar M, Schutze H, Mark M (2010) Lifestyle risk factors in general practice – routine assessment and management. Australian Family Physician 39(12), 950-953.
| Google Scholar |
Gonzalez-Chica DA, Dal Grande E, Bowden J, Musker M, Hay P, Stocks N (2017) Are we reducing the risk of cardiovascular disease and improving the quality of life through preventive health care? Results of a population-based study in South Australia. Preventive Medicine 99, 164-170.
| Crossref | Google Scholar |
Gonzalez-Chica DA, Bowden J, Miller C, Longo M, Nelson M, Reid C, Stocks N (2019) Patient-reported GP health assessments rather than individual cardiovascular risk burden are associated with the engagement in lifestyle changes: population-based survey in South Australia. BMC Family Practice 20(1), 173.
| Crossref | Google Scholar |
Morris M, Halcomb E, Mansourian Y, Bernoth M (2022) Understanding how general practice nurses support adult lifestyle risk reduction: an integrative review. Journal of Advanced Nursing 78(11), 3517-3530.
| Crossref | Google Scholar |
National Rural Health Alliance (2017) The disproportionate burden of heart disease in rural and remote Australia. Available at https://www.ruralhealth.org.au/news/disproportionate-burden-heart-disease-rural-and-remote-australia-0
Ng R, Sutradhar R, Yao Z, Wodchis WP, Rosella LC (2020) Smoking, drinking, diet and physical activity – modifiable lifestyle risk factors and their associations with age to first chronic disease. International Journal of Epidemiology 49(1), 113-130.
| Crossref | Google Scholar |
Passey M, Fanaian M, Lyle D, Harris MF (2010) Assessment and management of lifestyle risk factors in rural and urban general practices in Australia. Australian Journal of Primary Health 16(1), 81-86.
| Crossref | Google Scholar |
Rygh EM, Hjortdahl P (2007) Continuous and integrated health care services in rural areas. A literature study. Rural Remote Health 7(3), 766.
| Google Scholar |
Taylor A, Dal Grande E, Wilson D (2006) The South Australian Health Omnibus Survey 15 years on: has public health benefited? Public Health Bull 3(1), 30-32.
| Google Scholar |
Wellbeing SA (2022) South Australian population health data. Available at https://www.wellbeingsa.sa.gov.au/evidence-data/explore-and-request-data/open-data-portal/south-australian-population-health-data [Verified 18 May 2023]