

Burned vegetation recovery trajectory and its driving factors using satellite remote-sensing datasets in the Great Xing’An forest region of Inner Mongolia
Qiyue Zhang A B , Saeid Homayouni B , Pengwu Zhao A and Mei Zhou A *
A Forestry College, Inner Mongolia Agricultural University, No. 275, East Xin Jian Street, Hohhot, 010011, China.
B Centre Eau Terre Environnement, Institut National de la Recherche Scientifique, Québec, Canada.
International Journal of Wildland Fire 32(2) 244-261 https://doi.org/10.1071/WF21167
Submitted: 22 November 2021 Accepted: 30 November 2022 Published: 19 January 2023
© 2023 The Author(s) (or their employer(s)). Published by CSIRO Publishing on behalf of IAWF. This is an open access article distributed under the Creative Commons Attribution-NonCommercial-NoDerivatives 4.0 International License (CC BY-NC-ND)
Abstract
Forest fire is one of the most important factors that alter a forest ecosystem’s biogeochemical cycle. Large-scale distributed burned areas lose their original vegetation structure and are more impacted by climate change in the vegetation recovery process, thus making it harder to restore their original vegetation structure. In this study, we used historical Landsat imagery and the LandTrendr algorithm in the Google Earth Engine platform to study and identify post-fire stages in the Great Xing’An Range of Inner Mongolia. Moreover, we categorized different post-fire vegetation recovery trajectories. The usefulness of spectral indices was also evaluated in the study region. We applied the Geodetector model to analyze the driving factors of the burned area vegetation regeneration process. The results show that burn severity and earth–atmosphere hydrological cycle are two main impacting factors in the short term after the fire (e.g. 5–6 years). Other climatical conditions affect vegetation recovery, including prolonged vegetation recovery process, hydrothermal circulation process and topographical conditions, seasonally frozen soil, freeze–thaw processes, and climate events. This study improves understanding of the dynamic successional processes in the burned area and the driving factors. Also, the outcomes can facilitate and support sustainable forest management of the Great Xing’An Range.
Keywords: burned area, driving factors, geodector, Great Xing’An Range, Inner Mongolia, LandTrendr, remote sensing data, vegetation recovery trajectory.
Introduction
Wildfire is considered one of the most severe natural disasters and plays a critical role in terrestrial ecosystems (Artés et al. 2019). At the same time, a forest fire is an ecological management tool and a crucial factor in ecosystem evolution (Adelabu et al. 2020); however, it has harmful natural and socio-economic impacts at various scales (Chuvieco 2009; Aponte et al. 2016). Forest fire also indirectly affects the forest ecosystem by promoting forest degradation. Large-scale fire-related forest degradation results in long-term or permanent changes in vegetation coverage (Siscawati 1998).
Moreover, climate change and climate events accelerate the fire risk in forest ecosystems (San-Miguel-Ayanz et al. 2013, 2020; Yang et al. 2021). High-latitudinal regions influenced by the amplification of global-warming signals show increased fire activity (Girardin 2007; Marlon et al. 2008). Climate change and climate events lead to fuel moisture change, shaping the patterns of future forest fires. Interactions of abiotic and biotic climate-changing processes are more likely to amplify disturbances, with coniferous forest and boreal ecosystems the most affected (Seidl et al. 2017). Over recent decades, climate change has significantly affected post-fire forest recovery. Climate change also increases forests' water deficits and climate tolerance.
As the largest boreal forest in China, the Great Xing’An Range has the most vegetation types in the Eurasian boreal biome (Fang et al. 2015). Existing research recognises this region’s teleconnections between climate events and wildfires (Yao et al. 2017). The local forest ecosystem shows an adaptive trend in growth response to the climatic changes, with trees more susceptible to climate changes than dwarf shrubs (Yang et al. 2020), and the Dahurian larch and the Mongolian pine tending to be distributed separately (Li et al. 2021a). Moreover, permafrost is widely distributed in the Great Xing’An Range. The permafrost degradation process significantly affects the soil-water balance, eventually changing vegetation distribution (Li et al. 2021b). Post-fire forest regeneration experiments indicate that limited artificial promotion can be helpful to local vegetation recovery. However, broad-leafed species become the major regenerating species under natural regeneration conditions (Chen et al. 2014). Furthermore, annual temperature and spring phenology also show a stronger influence than other climatical conditions (Tang et al. 2015; Fu et al. 2018). Other researchers state that the duration of daily sunshine in summer is the critical factor in gross primary productivity in the Great Xing’An Range (Hu et al. 2018).
Remote sensing imagery and geospatial analysis have historically been the most cost-effective tools to study forest fire (Kourtz 1968; Hawe and Fuquay 1969; McKetta 1969). Cardil et al. (2021) recently developed multi-factor models to study forest fire occurrence and burned area vegetation recovery. Many optical spectral indices have been used to examine relationships between remote-sensing data and forest fire (White et al. 1996; Thomas Ambadan et al. 2020). Landsat time series has long been used in change detection (Kennedy et al. 2012; Zhu 2017). Previous research has established many algorithms such as Breaks for Additive Seasonal and Trend (BFAST) (Verbesselt et al. 2010), Continuous Monitoring of Forest Disturbance Algorithm (CMFDA) (Zhu et al. 2012) and Vegetation Change Tracker (VCT) (Huang et al. 2010). LandTrendr is a spectral trajectory-based segmentation algorithm that enables the identification of both short-term events (e.g. wildfire) and long-term changes (e.g. forest degradation). LandTrendr has good performance in many different regions for evaluating the disturbing and recovery process (Kennedy et al. 2012; Bright et al. 2019; Wang et al. 2021; Liu et al. 2022). The Google Earth Engine (GEE) platform is a popular and freely available cloud computing service that boosts remote-sensing analyses and provides access to varieties of earth observation products at a planetary scale (Gorelick et al. 2017). The combination of LandTrendr and GEE enables fast application and high efficiency of LandTrendr (Kennedy et al. 2018).
The Geographical Detector Model (GDM) was initially designed to assess health risk across different geographical strata (Wang et al. 2010). Their following studies improved and expanded the GDM in ecological phenomena (Wang et al. 2016) and other aspects (Luo et al. 2016; Xu et al. 2018). Su et al. (2020) investigated the driving factors of soil salinisation distribution. Chen et al. (2022a) found that slope angle controls permafrost-related seasonal deformation in the Qinghai-Tibet Plateau. To date, several attempts have investigated GDM for analysing vegetation growth. For example, Zhu et al. (2020) used GDM to study natural and anthropogenic factors in northeast China. Chen et al. (2021) analysed the driving factors of vegetation net primary productivity. Existing research on vegetation dynamics suggests that GDM plays an essential role in analysis of vegetation driving factors (Guo et al. 2020; Huo and Sun 2021; Zheng et al. 2021).
A considerable amount of literature on post-fire vegetation recovery has been published. Though these works studied a variety of forest ecosystems (Bartels et al. 2016; Hao et al. 2022), fewer works defined the different succession stages (Meng et al. 2015; João et al. 2018; Viana-Soto et al. 2020), and few have been applied to the Great Xing’An Range (Shi et al. 2019; Guo et al. 2021). Our study focuses on classifying and identifying vegetation recovery in burned areas at different stages and their driving factors in the Great Xing’An Range. We tried to understand post-fire biodiversity and vegetation composition better and promote knowledge of the boreal ecosystem’s resilience to wildfire. We used the modified GEE LandTrendr (Kennedy et al. 2018) and GDM (Wang et al. 2010) for analysis of Landsat historical data. The main goals are to (1) classify different trajectories of burned area vegetation recovery in two study areas, (2) categorise the differentiation between sustained management region and naturally recovered region, and (3) find the driving factors of each recovery stage.
Methodology
Study areas
Our study region lies in the northern forest of the Great Xing’An Range of Inner Mongolia, located in northeast China (Fig. 1a), which falls at the junction of two provinces: Inner Mongolia and Heilongjiang. Latitude is 50.03–53.33°N, and longitude is 119.49–123.25°E, covering an area of 1654 km2, most parts being larch forest. The dominant tree species are Xing’an larch, white birch, and Mongolian pine (Pinus sylvestris var. mongolica) (Wang et al. 2017). The region is characterised by a cold temperate continental climate under the influence of alternating monsoons. Based on meteorology data from 1960 to 2018, the multi-year average annual air temperature ranges from −1 to 1°C (Yue et al. 2020) at the Gen’he Meteorological Station. The mean annual precipitation is 438 mm. Precipitation is mainly concentrated in summer during June–September, accounting for 73% of the annual total. Between 1960 and 2018, annual precipitation at Gen’he station increased at an average rate of 15.5 mm per decade. This region has an intact community structure with relatively little artificial disturbance. Nevertheless, this area has become one of China’s regions with high forest fire risk because wildfires are frequent. Records show that the Great Xing’An Range has had over 3400 forest fires in the last six decades (Wang 2020).
Our research was based on two large forest fires in 2002 and 2003. One was the northern virgin forest fire (NVF-02) that occurred on 21 July 2002 and burned 3438.684 ha of forest. The other was the GenHe fire (GHF-03) on 5 May 2003, which burned 104 347.44 ha of forest. These two regions have had no subsequent fires after the primary fire disturbance. The main difference between these two forest fires is that the GHF-03 region was reforested by the local forestry bureau after the fire, while the NVF-02 region naturally recovered.

|
Data resources
All remote-sensing data in our study were collected from the GEE platform. The Landsat time series images were all chosen from surface reflectance product stores in GEE, including Landsat 5, Landsat 7, and Landsat 8, the GEE ImageCollection IDs for each image collection being LANDSAT/LT05/C02/T1_L2, LANDSAT/LE07/C02/T1_L2, and LANDSAT/LC08/C02/T1_L2, respectively. All Landsat time series images were processed to create the cloud, shadow, water, and snow masks in LandTrendr. A research period of 26 years, from 1995 to 2020, was used. We mainly used the growing season data (20 May to 20 September).
We used the ALOS DSM (Advanced Land Observing Satellite Digital Surface Model) to extract topographic information. The ALOS DSM was created by combing the SRTM CHILI (Shuttle Radar Topography Mission Continuous Heat-Insolation Load Index) and the multi-scale topographic position, which has a spatial resolution of 30 m (Tadono et al. 2014; Takaku et al. 2014, 2016; Bhalla et al. 2016).
Due to insufficient long-term field investigation images, the validation data of spatial vegetation recovery relied on Landsat time-series historical data, GEE historical data, and the data provided by the local forest bureau.
We acquired nine indices from the Terra Climate dataset (Abatzoglou et al. 2018) as climate variables in our study. Terra Climate is a global monthly climate dataset at 0.2 arc min spatial resolution. We divided these nine climate indices into Groups 1 and 2.
Group 1. The climate data for the growing season data were acquired for May–September every year, mainly representing the growing season’s impact and vegetation recovery, which contained the Palmer Drought Severity Index (PDSI) and Reference Evapotranspiration (PET) index showing the evaporative demand of soil moisture. Climate Water Deficit (DEF) and Precipitation Accumulation (PR) indices indicated climatic moisture conditions. The Soil Moisture (SOIL) index indicates the soil moisture conditions. The indices of Downward Surface Shortwave Radiation (SRAD) and Minimum Temperature (TMMN) indicated solar radiation.
Group 2. The non-growing season data acquired from October to April of the following year were mainly used to determine if the climatic conditions prior to the growing season affected the vegetation recovery. A former study showed that vegetation is affected by hydrothermal conditions in the permafrost region (Jin et al. 2021). The Snow Water Equivalent (SWE) index was used to evaluate the impact of the frozen soil and spring snow depth. The Maximum Temperature (TMMX) index was used to assess the winter temperature change.
Image processing and statistical analysis
Spectral indices and LandTrendr parameters
We used the LandTrendr spectral-temporal segmentation algorithm to calculate the spectral indices, delineate burned areas, and derive trajectory metrics of forested pixels. To better understand vegetation recovery tendencies, we needed to choose a vegetation-related index that best correlates with local vegetation recovery. The selected indices are tasselled cap components – tasselled cap wetness, tasselled cap greenness, tasselled cap brightness (Crist 1985), and tasselled cap angle (Powell et al. 2010) – they all show a relation to the mixed deciduous and coniferous forest (Dymond et al. 2002; Powell et al. 2010). We also used the Normalised Difference Vegetation Index (NDVI) (Tucker 1979), Normalised Difference Moisture Index (NDMI) (Jin and Sader 2005), and Normalised Burn Ratio (NBR) (van Wagtendonk et al. 2004) indices. The NDVI is widely used to quantify active vegetation, the NDMI is sensitive to canopy structure and leaf water content (Liu 2016), and the NBR is a broadly used vegetation index in burned areas and provides general vegetation growth conditions (Bright et al. 2019). In addition, because the near-infrared and shortwave infrared bands show a solid connection to vegetation change (Xiao et al. 2002), we also used these two indices in our pre-analysis.
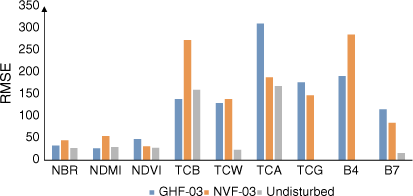
The UI Pixel Time Series Plotter was used to start the pre-study. Root mean square error (RMSE) was used to determine which index performed best. We randomly chose sample plots of burned area for each study region (NVF-02 and GHF-03). Also, another undisturbed region was used in this step to evaluate whether the index was sensitive to vegetation change. Based on the RMSE results (Fig. 2), in all three sample regions (NVF-02, GHF-03, and undisturbed), NBR showed the lowest RMSE and excellent pixel efficiency compared to other indices. We used the NBR as our trajectory classification-based index and NDVI as the pre-fire vegetation condition index to get more accurate and stable results in subsequent analyses.
|
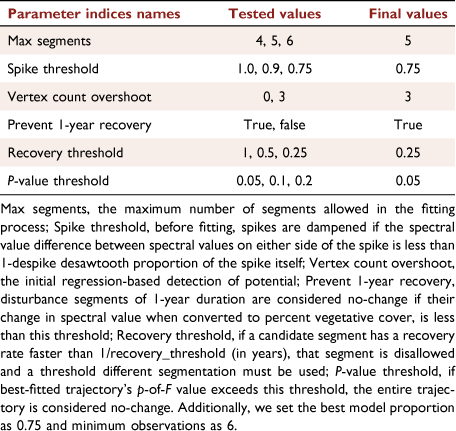
The core of LandTrendr trajectory segmentation is to eliminate noise but capture both abrupt and slow phenomena in the Landsat time series. This purpose requires LandTrendr to simplify the complex model into the best-fitting simple model iteratively. Therefore, we tested some parameters to help determine the final model (Table 1), and more details of this segmentation process can be found in Kennedy et al. (2010).
|
Vegetation recovery trajectory segmentation and classification
We tried to use the most relevant and stable index from the test we did before in this step. The recovery ratio (RR) was used to classify the vegetation recovery segmentation. The RR describes the ratio of vegetation change magnitude and duration. From the segmentation:
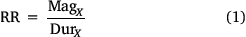
where X represents the vegetation change year, and Mag and Dur are the magnitude and duration of vegetation change, respectively.
In this work, we used K-means classification, one of the most popular unsupervised ensemble learning algorithms to cluster and classify the different vegetation recovery patterns (Gouveia et al. 2010). It runs efficiently on an extensive database. The clustering process can be divided into two steps: the first was to cluster the RR in each segment into groups. In this step, we ran the different numbers of classes from 12 to 7 to test if more classes would provide a better result. The second step refers to the idea of Bholowalia and Kumar (2014). The elbow method chooses the optimal classes, which explains the percentage of variance as a function of the number of clusters. In this step, we differentiated the class, those who did not add the variance percentage were classified into the minority classes, and those classes that added the variance percentage were classified into the majority classes. We reduced the classes by combining the minority and majority classes based on distance. The yearly change map was also used to determine if the RR had the same value while the recovery condition differed (i.e. RR is the same when mag = 10 and dur = 5 as when mag = 4 and dur = 2). The yearly change map ensured that classified RR was in the same condition. Each region finally had five classes of recovery categories.
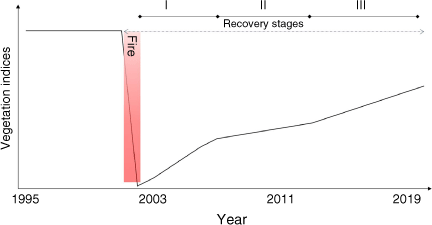
According to the original index-based (NBR-based) vegetation yearly change, vegetation recovery can be divided into three stages based on recovery time (Key and Benson 2006). The pre-fire vegetation indices values are the reference values to assess the vegetation recovery conditions. This judgment is based on the linear regression of different vegetation recovery stages. The trendline of pre-fire showed a steady trend. However, the different post-fire stages had different recovery rates. Fig. 3 shows the NBR-based vegetation recovery trajectories and stages.
|
Vegetation recovery driving factors
To investigate the vegetation recovery driving factors, we used the GDM to calculate the driving factors of the burned area vegetation recovery. The core of the GDM is stratified spatial heterogeneity (Wang et al. 2016). Stratified spatial heterogeneity refers to intra-strata having more geographical attribute similarities than inner-strata, which implies the natural geographical phenomenon by evaluating the association of geographical attributes between regional variances and the global variance of data (Guo et al. 2022). The strata from the definition of statistical in the GDM model thus can correspond to the definition of geographical classes in this study (Wang et al. 2010). Due to the climate variables at low resolution compared with Landsat series images, we need to differentiate the spatial resolution of the climate dataset. Previous research (Booij 2002; Masson and Knutti 2011) on climate scale found a good agreement with observations yet retained most regional features of climate signal under 20 km or lower resolution. Former studies proved that different spatial resolution data could be used in the GDM model by applying a rescale method (Zhang et al. 2021; Hu et al. 2022). Thus we used the Nearest Neighbour method (Danahy et al. 2007) to rescale the climate data to match our derived data. The q-value can determine this spatial association:
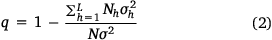
where h is the strata (h = 1, 2, …, L) of Y or X, Nh and N refer to the number of strata h and whole study region, respectively, and σh and σ are the variances of strata h and total strata, respectively. The q-value, within [0, 1], evaluates the association between X and Y: 0 implies no association between dependent and explanatory variables, and 1 suggests that X can perfectly explain the distribution of Y.
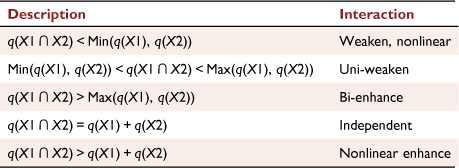
The functionality of the factor detector is to assess the coupling degree of X to Y using the q- and P-values. The q-value indicates the spatial association and the P-value refers to the significance. The functionality of the ecological detector implies two explanatory variables that have different impacts on the spatial distribution of Y. Ecological detectors are determined using the F-test value. The interaction detector function reveals whether two explanatory variables interact with the dependent variable. The interaction relationship of GDM is presented in Table 2. In this table, ‘Weaken,’ ‘Independent’, and ‘Enhance’ describe the impact of two explanatory variables’ interaction on the dependent variable, while ‘Uni’, ‘Bi’, and ‘Nonlinear’ mark the correlation between this interactive impact and the influence of the two explanatory variables themselves.
|
The Geodetector package (Song 2018) in R Studio is an analysing tool developed to apply the GDM function and get the spatial stratified heterogeneity result. Details about the Geodetector package can be found on the official website (Xu and Wang 2016). To better understand the association of fire severity, pre-fire conditions, and topographic and climatic conditions in the vegetation recovery process, we used 14 variables to explore this association, which were acquired and derived from the Landsat series and other data introduced before. All variables are shown in Table 3. All descriptive data should be under a discrete treatment, stratifying the continuous numerical variable into categorical variables. Because the climate variables are low resolution compared with Landsat series images, we need to differentiate the spatial resolution of the climate dataset. Previous research (Booij 2002; Masson and Knutti 2011) on climate scale found good agreement with observations, yet retained most regional features of climate signal at 20 km or lower resolution. Climate data also have at least five pixels in each study region, meeting the requirement of the GDM model. Hence, we consider the climate data as naturally heterologous distributed categorical variables rather than rescale them. In this step, we classify all needed variables in ArcGIS.

|
Evidence shows a strong relationship between fire severity and vegetation recovery of burned areas (Jin et al. 2012). Most likely, it represents the function of fire in the altered forest ecosystem. We evaluated fire severity by classifying dNBR values and the rules based on the USGS classification table (Key and Benson 2006). Severely burned areas are where most vegetation is burned to death. In moderately burned areas, nearly half of the vegetation is burned. Finally, the mild class is those under little or no influence. The dNBR are calculated from NBR:


We used NDVI for pre-fire vegetation conditions. The NDVI values used the Jenks natural breaks classification to build nine NDVI value groups of the NDVI values (Jenks 1967):

Topographic conditions were derived from ALOS DSM. The elevations were classified using a 50 m interval. This way, the NVF-02 region has 12 categories, and the GHF-03 region has 13 categories. The slope classification was done using the Guide to Medium-Scale Geomorphological Mapping (Demek and Embleton 1978). To this end, different slope classes were classified into seven classes (Table 3). The aspect was classified into nine classes (Table 3). Moreover, all the climatic conditions used original values as the categorical variables because of their spatial resolution.
Vegetation recovery assessment
A stratified validation based on the recovery categories was performed to evaluate the recovery conditions. Based on the recovery pixel counts, we classified the trajectories of different study regions into five time periods: 2005–2006 (2–3 years post-fire), 2008–2009 (5–7 years post-fire), 2011 (8–9 years post-fire), 2013–2014 (10–13 years post-fire), and 2020 (17–18 years post-fire). Likewise, our validation data were also divided into three parts: investigation data given by the local forest bureau were for the years 2006 and 2014; images from GEE historical images were for 2005, 2011, 2013–2014, and 2020; and the Landsat series provided images of 2008–2009. Other reference images helped to identify the pre-fire conditions (represented by NBR value), and dNBR were also obtained from the Landsat series in the years 2000–2001 and 2003. Note that due to the resolution, we used the NBR value to represent the vegetation coverage of Landsat images (Bright et al. 2019).
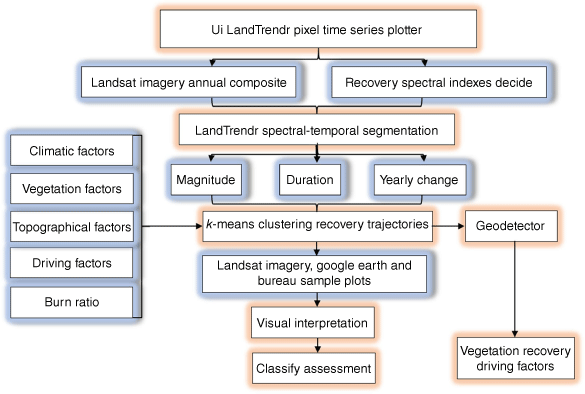
We randomly established 100 sample plots (30 m × 30 m) of each class in each region to the derived recovery trajectories. A total of 1000 sample plots were then established in the two areas. Six corresponding images were selected for each sample plot, including one pre-fire and five post-fire images. The basis of judgment differed from the data source. The Landsat-derived image defined the NBR value as over 80% of the pre-fire NBR value as recovered (Pickell et al. 2016). The GEE historical data were defined as at least 60% of areas covered with vegetation as recovered pixels (Zhao et al. 2016). The investigation data were also decided by the vegetation coverage of over 60%. Four criteria were used to evaluate the classification accuracy: global (Overall Accuracy and Kappa Coefficient of Agreement) and per-class measures. The analysis and validation methods are illustrated in Fig. 4.
|
Results
Post-fire vegetation recovery classification
The charts in Fig. 4 demonstrate the fitted trajectories of the different regions from NDVI, NDMI, and NBR. Although six graphs show an increasing trend in post-fire vegetation recovery, the two regions show dissimilitude. All results showed that the vegetation altered severely after a specific disturbance (fire). All three indices had stability in pre-fire vegetation without much alteration before the fire. There was a slight decrease before the fire, possibly because of vegetation self‑restoration and climatic change. Since the vegetation structure had not changed, the values of NBR-fitted trajectories were stable. The NVF-02 region had more abrupt changes than the GHF-03 region, yet the GHF-03 slope change could be divided into three stages and that of NVF-02 into two. The NDMI had a more significant slope in vegetation recovery trajectories among all three indices, as vegetation correlates more with moisture. As time progressed, the mean values of all three indices in both regions reached the pre-fire value.
Among all fitted trajectories, vegetation recovery could be divided into three stages: short-term high-speed increasing recovery, increasing mid-term recovery, and long-term slow increasing recovery (Fig. 3). Also, of all the graphics shown in Fig. 5, NDMI shows the best fitness result, and NBR shows the worst. All three indices show great fitness. Considering the fitness and classification, we opted for NBR as the trajectory classification index.

|
We constructed graphics to monitor the vegetation recovery change in each year (Figs 6, 7), so we could better understand the vegetation recovery. The two study regions differed in post-fire management. Each burned area showed the same situation as in the early years after the fire, and the vegetation had a rising trend for 2 years. However, GHF-03 had a rising trend of vegetation recovery immediately following the forest fire. The recovery slowed in the next 2 years, while the vegetation recovery boost for NVF-02 happened 1 year after the fire. This is likely mainly due to terrain factors, as the NVF-02 has a small area with steep hills, and GHF-03 has a large area with few steep hills.

|

|
Because this research mainly used remote-sensing data, we analysed the recovery based on its optical characteristics. Our field surveys indicate that fire ash fertilised the post-fire region, and the fire activated seeds under the soil; the rising trend of vegetation mainly consisted of bushes and grasses, and the seeds of trees were activated.
Nearly no pixels occurred in the NVF-02 region after 2009 (Fig. 7). Still, in the GHF-03 region, some vegetation recovery pixels existed after 2009 (Fig. 6). This phenomenon indicates that artificial reforestation could increase burned area vegetation recovery after natural recovery was stable.
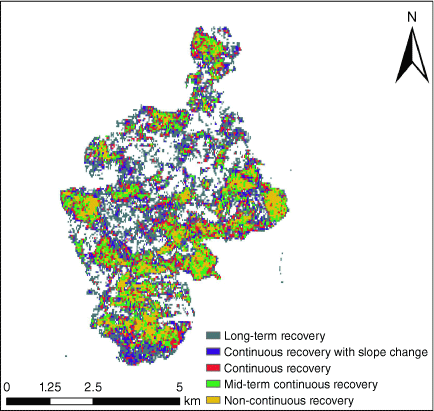
We finally classified seven categories of vegetation recovery trajectory (Table 4). The GHF-03 contained five categories: PDSR, CRSC, CR, STRS, and NCR. The NVF-02 also had five categories: LTR, CRSC, CR, MTCR, and NCR.

|
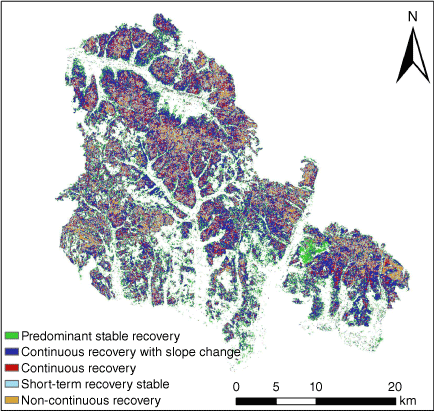
A solid spatial effect existed on the recovery categories owing to its spatial distribution. Likewise, the two study areas showed a different clustering trend under different magnitudes and change duration (Figs 8, 9).
|
|
In GHF-03, vegetation presented a steadier tendency and continuous recovery areas (Fig. 8). The NVF-02 showed more varied recovery categories and more discontinuous recovery areas (Fig. 9). The NCR of each region tended to cluster, possibly because NCR was distributed in fluctuating areas. Different vegetation recovery periods (short-, mid-, and long-term) depended primarily on their relation with seasonally frozen soil. Other locations coupling with the freeze–thaw process may lead to vegetation growth differences, thus restricting vegetation growth.
Driving factors of different regeneration types
Figs 10, 11 show that no factor had a solid correlation with vegetation recovery, meaning local vegetation had a complex structure. Its recovery was the result of multiple factors working together. However, different stages showed different correlation results. The factors in stage Ⅰ had more correlations than in stage Ⅱ, suggesting that 5–6 years after the fire, vegetation recovery was more easily altered by natural factors.

|

|
Among all post-fire stages, the burn ratio (i.e. dNBR) correlated with vegetation recovery more than the pre-fire conditions (i.e. NDVI), implying that some fire-activated species may have changed the original vegetation structure. Regarding topographic factors, in both study regions, the q-value and P-value indicated that vegetation recovery was slightly correlated with the slope, owing to local pine and larch being primarily located in foothills on a gentle slope. Aspect had relatively little influence, partly because the semi-shady slopes (northwest and northeast) had lower evaporation rates. The DEM had more influence among three topographic conditions, indicating that topography affected vegetation recovery and that the influence of topographic factors on vegetation was relatively long.
Moreover, we compared nine climatic conditions correlated with vegetation recovery (Figs 10, 11). In GHF-03, for stages, Ⅰ–Ⅲ, the most influential factor combination changed from the DEF, SOIL, and PET to the combination of SOIL, SRAD, PET, and TMMN. In other words, climatic moisture is key to burned area vegetation growth, which is also an excellent choice when studying climatic change. The factor combination change showed that short-term vegetation recovery was mostly restricted by climatic moisture and soil moisture. The long-term vegetation recovery was affected by multiple factors: growing season temperature, radiance, and moisture. A similar situation was also found in NVF-02.
Interestingly, most factors had a declining trend in stage Ⅱ in both study regions (Figs 10, 11). This may be caused by the periodic climatic events (i.e. regional drought and Arctic oscillation) that influence northeast China (Center 2020). We also tested the non-growing season SWE and TMMX due to the location in a seasonal frozen-soil area. The correlation values indicated that seasonal snow and frozen soil’s melt–freezing process would also affect the vegetation moisture balance.
The interactive analysis results are graphically shown in Figs 12, 13. Generally speaking, burn ratio and pre-fire vegetation conditions all showed an intense interactive enhanced short-term effect after the fire; this effect decreased with time, possibly because the ashes of the fire accelerated the growth of the first generation of vegetation (mainly bushes and grasses). Topography showed an increasing trend of interactive effects in both regions, especially NVF-02. The result indicated that the effect of topographic factors on vegetation recovery might need a long time. Aspect and dNBR showed a nonlinear enhancement in both regions in Stage Ⅰ. Due to the high burn ratio areas, fire most changed the vegetation structure, and the regrowth process was related to the left fertiliser from the fire; ashes most likely stayed in the plain areas compared to steep slopes. The interactive effect of topographic factors was small in GHF-03, and climatic factors were contrary. Regarding the character of each region, we conclude that the enhancement had a temporal-limit trend in GHF-03. There was no interactive enhancement that continued in the three stages. Climatic factors showed a significantly enhanced effect with other factors, primarily soil moisture and precipitation.

|

|
Recovery accuracy assessment
Both study regions showed great accuracy in most vegetation recovery categories (Table 5). Compared with a previous study (Viana-Soto et al. 2020), overall accuracy and kappa coefficient were high. Results for NVF-02 were more accurate, with lower commission and omission errors. The commission and omission errors were more stable in NVF-02 than in GHF-03. These results indicated that the structure of the NVF-02 vegetation recovery was relatively more stable. The continuous recovery classes had higher accuracy than the non-continuous ones. The NCR demonstrated more omission errors among all classes. This may due to the systematic error of chosen sample plots. We could not find a non-continuous recovery region under exactly the same recovery and non-recovery years, which could lead to this type of error.

|
Discussion
Post-fire trajectory classification
It was not easy to map all burned areas' vegetation regeneration status. It was also a great challenge to classify the vegetation recovery categories because post-fire vegetation recovery is a complex dynamic process impacted by multiple factors. Therefore, we combined historical remote-sensing data with GIS technology to quantify the post-fire vegetation recovery. Because spectral value change is related to vegetation change, we applied NBR recovery ratios at different stages in two Great Xing’An Range burned areas.
We used the LandTrendr algorithm to extract time-series Landsat data and analysed and categorised burned area vegetation recovery trends. The LandTrendr-derived categories enabled us to find slight and recovery time changes, which is essential to understand a long period of forest post-fire vegetation change. The temporal and continuous changes we mapped are vital to reveal vegetation structure change and link with other influencing factors throughout the slow vegetation recovery process. Recent studies also analysed the vegetation change process: Viana-Soto et al. (2020), using Landsat time-series images, measured post-fire recovery levels in Mediterranean pine forests, and Liu and Lu (2020) detected landscape pattern change in Hulunbeir forest–steppe ecotone. Our finding emphasised the importance of classifying vegetation recovery patterns and promoted understanding of post-fire vegetation change.
The NBR proved to be a stable index of the vegetation change process. Other researchers have had similar results: Reygadas Langarica et al. (2020) used LandTrendr-NBR to study forest disturbances in southwestern Amazon forests, and Bonney et al. (2020) quantified an analysis of post-fire recovery in Australia. In our region, NBR is suitable for tracking the post-fire vegetation growth and its structure conditions.
A recovery ratio with yearly change detection is a potential method to derive vegetation change. Our research demonstrated that vegetation recovery rates rapidly increased after the fire and declined in later stages. This is likely because forest fire activated certain seeds and nourished therophytes (i.e. grasses and shrubs). The lower increase rates in Stages Ⅱ and Ⅲ are related to the relatively slow perennial plant (i.e. forest) regrowth process. Since the early post-fire stage vegetation structure had already formed, this may have affected the satellite-based observation results. Another reason is that vegetation biomass cannot be precisely measured due to the limitations of optical remote-sensing data (Beamish et al. 2020; Frappart et al. 2020).
A well-known criticism of accuracy assessment is the lack of historical references for high-resolution image data. Therefore, we used visual interpretation to classify our reference data into vegetation and non-vegetation areas. All interpreted classes showed relatively high accuracy. We also found that the NCR class showed a relatively high omission error in both regions. Insufficient cloud-free high-quality images may cause this error in our study regions throughout the research period. As a result, our sample plots did not have the same recovery break time (i.e. every sample plot recovery from 2003 to 2005 stopped in 2006–2008 and restarted for 2009–2012). This combination of findings supports the conceptual premise that LandTrendr allowed us to quantitatively analyse the spatial–temporal dynamics of vegetation recovery in burned areas with acceptable precision. Furthermore, this will increase the understanding of wildfire-induced hydrothermal change and, thus, climate change.
Driving factors of vegetation regeneration
From the results of a spatial stratified heterogeneity regression model, we concluded that the climate is one of the most critical factors influencing post-fire vegetation recovery among topographic factors, fire severity, pre-fire conditions, and climatic factors in the Great Xing’An Range. Of all the climatic conditions, the earth–atmosphere hydrological cycle is vital to burned area short-term vegetation growth, and vegetation growth increases benefits from a positive water balance. Long-term vegetation recovery should consider the whole hydrothermal circulation process: radiance, temperature, and moisture. This also matches the results of several other researchers (Qiu et al. 2021; Chen et al. 2022b) that indicate that warmth and drought will protractedly impact vegetation regeneration.
In this study, we also explored the non-growing season hydrothermal circulation. The seasonal frozen soil’s melt–freezing process would slightly impact vegetation recovery, as Zhang et al. (2018) found. We also found that some climate events may influence the climatic impact levels, as noted in Rupp et al. (2000) and Ying et al. (2020).
Topographic conditions show a slow and stable influence on vegetation recovery. The effects tend to couple with other factors like climatic variables. Lee et al. (2018) and Viana-Soto et al. (2020) mentioned topographic factors, especially elevation effect on burned severity, which supports our result on interactive influence with topographic variables. Moreover, burn severity strongly influenced the short term after the fire, as Viana-Soto et al. (2017) described.
The purpose of this study was to compare two different regions of sustained artificial regeneration and natural recovery. Despite some differences between these two regions, we are convinced that sustained artificial regeneration will promote the recovery of burned area vegetation, although slightly and slowly. Several authors have made similar conclusions (Chen et al. 2014; Aponte et al. 2016; Hu et al. 2019; Wittenberg et al. 2020).
Returning to the question posed at the beginning of this study, it is now possible to state that even though the climatic factors were most influential in the burned area vegetation recovery process, those not presented in this paper should also be considered. Our next focus will be on the topographic condition of seeds and the species’ competitive process.
Conclusion
Wildfire is an essential component in the climate system and plays a crucial role in evaluating the carbon cycle and sink. By characterising the post-fire vegetation temporal recovery trajectories, LandTrendr enables us better understand vegetation’s adaptive strategies and mechanisms for wildfire disturbance. On the other hand, with the background of global climate change, the discovery of post-fire vegetation regeneration can play an important role in addressing the issue of fire regime and fuel conditions change in a fire-prone region. Some attempts have been made to study post-fire vegetation recovery, but few studies have characterised different vegetation recovery patterns in the Great Xing’An Range. Our work presents a classification idea based on NBR's yearly change and its change continuity. Our work on post-fire vegetation regrowth also demonstrates that burn severity and the earth–atmosphere hydrological cycle are essential factors with short-term influence. Concerning the long term, we advise considering the hydrothermal circulation process and topographical conditions.
Great Xing’An is China's largest and best-preserved pristine area and is China’s vital Larix gmelinii forestry resource. However, forest fire risk is high, and this region has frequent forest fires. As an essential terrestrial ecosystem, forests are directly affected by surface hydrothermal changes. The occurrence of forest fires will seriously threaten the regional ecological environment. Studying forest fires in the Great Xing’An area can make up for the lack of research in China and quantitatively monitor the restoration of forests after fires. These burned areas will take a long time to develop into mature forests, thus further necessitating studies on fire regimes, structural change of vegetation biotic communities in the burned area, and different species' competitive processes.
Data availability
All data, including the codes, can be provided in response to requests from the first author or the corresponding author.
Conflicts of interest
The authors declare no conflicts of interest.
Declaration of funding
This paper was funded by the Department of Science and Technology of Inner Mongolia (2022YFSH0077 and 20130435) and the National Natural Science Foundation of China (NSFC41563006).
Acknowledgments
The authors acknowledge the financial support the China Scholarship Council (CSC) provided to Qiyue Zhang to conduct this research during a visit to the Institut National de la Recherche Scientifique (INRS), Eau Terre Environnement Centre, Quebec City, Canada. We are thankful for the suggestion of Professor Huaxia Yao. We are grateful for the in-situ vegetation data provided by the Forest Bureau of Genhe and the Bureau of Northern Primitive Forest.
References
Abatzoglou JT, Dobrowski SZ, Parks SA, Hegewisch KC (2018) TerraClimate, a high-resolution global dataset of monthly climate and climatic water balance from 1958–2015. Scientific Data 5, 170191| TerraClimate, a high-resolution global dataset of monthly climate and climatic water balance from 1958–2015.Crossref | GoogleScholarGoogle Scholar |
Adelabu SA, Adepoju KA, Mofokeng OD (2020) Estimation of fire potential index in mountainous protected region using remote sensing. Geocarto International 35, 29–46.
| Estimation of fire potential index in mountainous protected region using remote sensing.Crossref | GoogleScholarGoogle Scholar |
Aponte C, de Groot WJ, Wotton BM (2016) Forest fires and climate change: causes, consequences and management options. International Journal of Wildland Fire 25, i–ii.
| Forest fires and climate change: causes, consequences and management options.Crossref | GoogleScholarGoogle Scholar |
Artés T, Oom D, de Rigo D, Durrant TH, Maianti P, Libertà G, San-Miguel-Ayanz J (2019) A global wildfire dataset for the analysis of fire regimes and fire behaviour. Scientific Data 6, 296
| A global wildfire dataset for the analysis of fire regimes and fire behaviour.Crossref | GoogleScholarGoogle Scholar |
Bartels SF, Chen HYH, Wulder MA, White JC (2016) Trends in post-disturbance recovery rates of Canada’s forests following wildfire and harvest. Forest Ecology and Management 361, 194–207.
| Trends in post-disturbance recovery rates of Canada’s forests following wildfire and harvest.Crossref | GoogleScholarGoogle Scholar |
Beamish A, Raynolds MK, Epstein H, Frost GV, Macander MJ, Bergstedt H, Bartsch A, Kruse S, Miles V, Tanis CM, Heim B, Fuchs M, Chabrillat S, Shevtsova I, Verdonen M, Wagner J (2020) Recent trends and remaining challenges for optical remote sensing of Arctic tundra vegetation: A review and outlook. Remote Sensing of Environment 246, 111872
| Recent trends and remaining challenges for optical remote sensing of Arctic tundra vegetation: A review and outlook.Crossref | GoogleScholarGoogle Scholar |
Bhalla A, Durham RL, Al-Tabaa N, Yeager C (2016) The development and initial psychometric validation of the eHealth readiness scale. Computers in Human Behavior 65, 460–467.
| The development and initial psychometric validation of the eHealth readiness scale.Crossref | GoogleScholarGoogle Scholar |
Bholowalia P, Kumar A (2014) EBK-means: A clustering technique based on elbow method and k-means in WSN. International Journal of Computer Applications 105, 17–24.
Bonney MT, He Y, Myint SW (2020) Contextualizing the 2019–2020 Kangaroo Island Bushfires: Quantifying Landscape-Level Influences on Past Severity and Recovery with Landsat and Google Earth Engine. Remote Sensing 12, 3942
| Contextualizing the 2019–2020 Kangaroo Island Bushfires: Quantifying Landscape-Level Influences on Past Severity and Recovery with Landsat and Google Earth Engine.Crossref | GoogleScholarGoogle Scholar |
Booij MJ (2002) Extreme daily precipitation in Western Europe with climate change at appropriate spatial scales. International Journal of Climatology 22, 69–85.
| Extreme daily precipitation in Western Europe with climate change at appropriate spatial scales.Crossref | GoogleScholarGoogle Scholar |
Bright BC, Hudak AT, Kennedy RE, Braaten JD, Henareh Khalyani A (2019) Examining post-fire vegetation recovery with Landsat time series analysis in three western North American forest types. Fire Ecology 15, 8
| Examining post-fire vegetation recovery with Landsat time series analysis in three western North American forest types.Crossref | GoogleScholarGoogle Scholar |
Cardil A, Monedero S, Schag G, de-Miguel S, Tapia M, Stoof CR, Silva CA, Mohan M, Cardil A, Ramirez J (2021) Fire behavior modeling for operational decision-making. Current Opinion in Environmental Science & Health 23, 100291
| Fire behavior modeling for operational decision-making.Crossref | GoogleScholarGoogle Scholar |
Center CCC (2020) ‘Blue Book on Climate Change in China (2020).’ (Science Press: Beijing)
Chen W, Moriya K, Sakai T, Koyama L, Cao C (2014) Post-fire forest regeneration under different restoration treatments in the Greater Hinggan Mountain area of China. Ecological Engineering 70, 304–311.
| Post-fire forest regeneration under different restoration treatments in the Greater Hinggan Mountain area of China.Crossref | GoogleScholarGoogle Scholar |
Chen S-t, Guo B, Zhang R, Zang W-q, Wei C-x, Wu H-w, Yang X, Zhen X-y, Li X, Zhang D-f, Han B-m, Zhang H-l (2021) Quantitatively determine the dominant driving factors of the spatial—temporal changes of vegetation npp in the hengduan mountain area during 2000–2015. Journal of Mountain Science 18, 427–445.
| Quantitatively determine the dominant driving factors of the spatial—temporal changes of vegetation npp in the hengduan mountain area during 2000–2015.Crossref | GoogleScholarGoogle Scholar |
Chen J, Wu T, Zou D, Liu L, Wu X, Gong W, Zhu X, Li R, Hao J, Hu G, Pang Q, Zhang J, Yang S (2022a) Magnitudes and patterns of large-scale permafrost ground deformation revealed by Sentinel-1 InSAR on the central Qinghai-Tibet Plateau. Remote Sensing of Environment 268, 112778
| Magnitudes and patterns of large-scale permafrost ground deformation revealed by Sentinel-1 InSAR on the central Qinghai-Tibet Plateau.Crossref | GoogleScholarGoogle Scholar |
Chen X, Chen W, Xu M (2022b) Remote-Sensing Monitoring of Postfire Vegetation Dynamics in the Greater Hinggan Mountain Range Based on Long Time-Series Data: Analysis of the Effects of Six Topographic and Climatic Factors. Remote Sensing 14, 2958
| Remote-Sensing Monitoring of Postfire Vegetation Dynamics in the Greater Hinggan Mountain Range Based on Long Time-Series Data: Analysis of the Effects of Six Topographic and Climatic Factors.Crossref | GoogleScholarGoogle Scholar |
Chuvieco E (2009) Global Impacts of Fire. In ‘Earth Observation of Wildland Fires in Mediterranean Ecosystems’. (Ed. E Chuvieco) pp. 1–10. (Springer, Berlin, Heidelberg)
| Crossref |
Crist EP (1985) A TM tasseled cap equivalent transformation for reflectance factor data. Remote Sensing of Environment 17, 301–306.
| A TM tasseled cap equivalent transformation for reflectance factor data.Crossref | GoogleScholarGoogle Scholar |
Danahy EE, Agaian SS, Panetta KA (2007) Algorithms for the resizing of binary and grayscale images using a logical transform. In ‘Image Processing: Algorithms and Systems V. Vol. 6497’. (Eds JT Astola, KO Egiazarian, ER Dougherty) (SPIE)
| Crossref |
Demek J, Embleton C (1978) ‘Guide to medium-scale geomorphological mapping.’ (Schweizerbart Science Publishers: Stuttgart, Germany)
Dymond CC, Mladenoff DJ, Radeloff VC (2002) Phenological differences in Tasseled Cap indices improve deciduous forest classification. Remote Sensing of Environment 80, 460–472.
| Phenological differences in Tasseled Cap indices improve deciduous forest classification.Crossref | GoogleScholarGoogle Scholar |
Fang L, Yang J, Zu J, Li G, Zhang J (2015) Quantifying influences and relative importance of fire weather, topography, and vegetation on fire size and fire severity in a Chinese boreal forest landscape. Forest Ecology and Management 356, 2–12.
| Quantifying influences and relative importance of fire weather, topography, and vegetation on fire size and fire severity in a Chinese boreal forest landscape.Crossref | GoogleScholarGoogle Scholar |
Frappart F, Wigneron J-P, Li X, Liu X, Al-Yaari A, Fan L, Wang M, Moisy C, Le Masson E, Aoulad Lafkih Z, Vallé C, Ygorra B, Baghdadi N (2020) Global Monitoring of the Vegetation Dynamics from the Vegetation Optical Depth (VOD): A Review. Remote Sensing 12, 2915
| Global Monitoring of the Vegetation Dynamics from the Vegetation Optical Depth (VOD): A Review.Crossref | GoogleScholarGoogle Scholar |
Fu Y, He HS, Zhao J, Larsen DR, Zhang H, Sunde MG, Duan S (2018) Climate and Spring Phenology Effects on Autumn Phenology in the Greater Khingan Mountains, Northeastern China. Remote Sensing 10, 449
| Climate and Spring Phenology Effects on Autumn Phenology in the Greater Khingan Mountains, Northeastern China.Crossref | GoogleScholarGoogle Scholar |
Girardin MP (2007) Interannual to decadal changes in area burned in Canada from 1781 to 1982 and the relationship to Northern Hemisphere land temperatures. Global Ecology and Biogeography 16, 557–566.
| Interannual to decadal changes in area burned in Canada from 1781 to 1982 and the relationship to Northern Hemisphere land temperatures.Crossref | GoogleScholarGoogle Scholar |
Gorelick N, Hancher M, Dixon M, Ilyushchenko S, Thau D, Moore R (2017) Google Earth Engine: Planetary-scale geospatial analysis for everyone. Remote Sensing of Environment 202, 18–27.
| Google Earth Engine: Planetary-scale geospatial analysis for everyone.Crossref | GoogleScholarGoogle Scholar |
Gouveia C, DaCamara CC, Trigo RM (2010) Post-fire vegetation recovery in Portugal based on spot/vegetation data. Natural Hazards and Earth System Sciences 10, 673–684.
| Post-fire vegetation recovery in Portugal based on spot/vegetation data.Crossref | GoogleScholarGoogle Scholar |
Guo Y, Zhang X, Wang Q, Chen H, Du X, Ma Y (2020) Temporal changes in vegetation around a shale gas development area in a subtropical karst region in southwestern China. Science of the Total Environment 701, 134769
| Temporal changes in vegetation around a shale gas development area in a subtropical karst region in southwestern China.Crossref | GoogleScholarGoogle Scholar |
Guo M, Li J, Yu F, Yin S, Huang S, Wen L (2021) Estimation of post-fire vegetation recovery in boreal forests using solar-induced chlorophyll fluorescence (SIF) data. International Journal of Wildland Fire 30, 365–377.
| Estimation of post-fire vegetation recovery in boreal forests using solar-induced chlorophyll fluorescence (SIF) data.Crossref | GoogleScholarGoogle Scholar |
Guo J, Wang J, Xu C, Song Y (2022) Modeling of spatial stratified heterogeneity. GIScience & Remote Sensing 59, 1660–1677.
| Modeling of spatial stratified heterogeneity.Crossref | GoogleScholarGoogle Scholar |
Hao B, Xu X, Wu F, Tan L (2022) Long-Term Effects of Fire Severity and Climatic Factors on Post-Forest-Fire Vegetation Recovery. Forests 13, 883
| Long-Term Effects of Fire Severity and Climatic Factors on Post-Forest-Fire Vegetation Recovery.Crossref | GoogleScholarGoogle Scholar |
Hawe RG, Fuquay DM (1969) Remote sensing of lightning in forest fire research. Remote Sensing of Environment VI, 1193
Hu L, Fan W, Ren H, Liu S, Cui Y, Zhao P (2018) Spatiotemporal Dynamics in Vegetation GPP over the Great Khingan Mountains Using GLASS Products from 1982 to 2015. Remote Sensing 10, 488
| Spatiotemporal Dynamics in Vegetation GPP over the Great Khingan Mountains Using GLASS Products from 1982 to 2015.Crossref | GoogleScholarGoogle Scholar |
Hu T, Hu H, Li F, Zhao B, Wu S, Zhu G, Sun L (2019) Long-term effects of post-fire restoration types on nitrogen mineralisation in a Dahurian larch (Larix gmelinii) forest in boreal China. Science of the Total Environment 679, 237–247.
| Long-term effects of post-fire restoration types on nitrogen mineralisation in a Dahurian larch (Larix gmelinii) forest in boreal China.Crossref | GoogleScholarGoogle Scholar |
Hu Y, Xu E, Dong N, Tian G, Kim G, Song P, Ge S, Liu S (2022) Driving Mechanism of Habitat Quality at Different Grid-Scales in a Metropolitan City. Forests 13, 248
| Driving Mechanism of Habitat Quality at Different Grid-Scales in a Metropolitan City.Crossref | GoogleScholarGoogle Scholar |
Huang C, Goward SN, Masek JG, Thomas N, Zhu Z, Vogelmann JE (2010) An automated approach for reconstructing recent forest disturbance history using dense Landsat time series stacks. Remote Sensing of Environment 114, 183–198.
| An automated approach for reconstructing recent forest disturbance history using dense Landsat time series stacks.Crossref | GoogleScholarGoogle Scholar |
Huo H, Sun C (2021) Spatiotemporal variation and influencing factors of vegetation dynamics based on Geodetector: A case study of the northwestern Yunnan Plateau, China. Ecological Indicators 130, 108005
| Spatiotemporal variation and influencing factors of vegetation dynamics based on Geodetector: A case study of the northwestern Yunnan Plateau, China.Crossref | GoogleScholarGoogle Scholar |
Jenks GF (1967) The data model concept in statistical mapping. International Yearbook of Cartography 7, 186–190.
Jin S, Sader SA (2005) Comparison of time series tasseled cap wetness and the normalized difference moisture index in detecting forest disturbances. Remote Sensing of Environment 94, 364–372.
| Comparison of time series tasseled cap wetness and the normalized difference moisture index in detecting forest disturbances.Crossref | GoogleScholarGoogle Scholar |
Jin Y, Randerson JT, Goetz SJ, Beck PSA, Loranty MM, Goulden ML (2012) The influence of burn severity on postfire vegetation recovery and albedo change during early succession in North American boreal forests. Journal of Geophysical Research: Biogeosciences 117, G01036
| The influence of burn severity on postfire vegetation recovery and albedo change during early succession in North American boreal forests.Crossref | GoogleScholarGoogle Scholar |
Jin X-Y, Jin H-J, Iwahana G, Marchenko SS, Luo D-L, Li X-Y, Liang S-H (2021) Impacts of climate-induced permafrost degradation on vegetation: A review. Advances in Climate Change Research 12, 29–47.
| Impacts of climate-induced permafrost degradation on vegetation: A review.Crossref | GoogleScholarGoogle Scholar |
João T, João G, Bruno M, João H (2018) Indicator-based assessment of post-fire recovery dynamics using satellite NDVI time-series. Ecological Indicators 89, 199–212.
| Indicator-based assessment of post-fire recovery dynamics using satellite NDVI time-series.Crossref | GoogleScholarGoogle Scholar |
Kennedy RE, Yang Z, Cohen WB (2010) Detecting trends in forest disturbance and recovery using yearly Landsat time series: 1. LandTrendr — Temporal segmentation algorithms. Remote Sensing of Environment 114, 2897–2910.
| Detecting trends in forest disturbance and recovery using yearly Landsat time series: 1. LandTrendr — Temporal segmentation algorithms.Crossref | GoogleScholarGoogle Scholar |
Kennedy RE, Yang Z, Cohen WB, Pfaff E, Braaten J, Nelson P (2012) Spatial and temporal patterns of forest disturbance and regrowth within the area of the Northwest Forest Plan. Remote Sensing of Environment 122, 117–133.
| Spatial and temporal patterns of forest disturbance and regrowth within the area of the Northwest Forest Plan.Crossref | GoogleScholarGoogle Scholar |
Kennedy RE, Yang Z, Gorelick N, Braaten J, Cavalcante L, Cohen WB, Healey S (2018) Implementation of the LandTrendr Algorithm on Google Earth Engine. Remote Sensing 10, 691
| Implementation of the LandTrendr Algorithm on Google Earth Engine.Crossref | GoogleScholarGoogle Scholar |
Key CH, Benson NC (2006) Landscape Assessment (LA): Sampling and Analysis Methods. In ‘FIREMON: Fire Effects Monitoring and Inventory System’ Gen. Tech. Rep. RMRS-GTR-164-CD. (Eds DC Lutes, RE Keane, JF Caratti, CH Key, NC Benson, S Sutherland, LJ Gangi) pp. LA-1–LA-55. (Ogden, UT: USDA Forest Service, Rocky Mountain Research Station) Available at https://www.fs.usda.gov/research/treesearch/24066
Kourtz PH (1968) Computers and Forest Fire Detection. The Forestry Chronicle 44, 22–24.
| Computers and Forest Fire Detection.Crossref | GoogleScholarGoogle Scholar |
Lee H-J, Choi YE, Lee S-W (2018) Complex Relationships of the Effects of Topographic Characteristics and Susceptible Tree Cover on Burn Severity. Sustainability 10, 295
| Complex Relationships of the Effects of Topographic Characteristics and Susceptible Tree Cover on Burn Severity.Crossref | GoogleScholarGoogle Scholar |
Li W, Jiang Y, Dong M, Du E, Wu F, Zhao S, Xu H (2021a) Species-specific growth-climate responses of Dahurian larch (Larix gmelinii) and Mongolian pine (Pinus sylvestris var. mongolica) in the Greater Khingan Range, northeast China. Dendrochronologia 65, 125803
| Species-specific growth-climate responses of Dahurian larch (Larix gmelinii) and Mongolian pine (Pinus sylvestris var. mongolica) in the Greater Khingan Range, northeast China.Crossref | GoogleScholarGoogle Scholar |
Li Y, Liu H, Zhu X, Yue Y, Xue J, Shi L (2021b) How permafrost degradation threatens boreal forest growth on its southern margin? Science of the Total Environment 762, 143154
| How permafrost degradation threatens boreal forest growth on its southern margin?Crossref | GoogleScholarGoogle Scholar |
Liu Z (2016) Effects of climate and fire on short-term vegetation recovery in the boreal larch forests of Northeastern China. Scientific Reports 6, 37572
| Effects of climate and fire on short-term vegetation recovery in the boreal larch forests of Northeastern China.Crossref | GoogleScholarGoogle Scholar |
Liu L, Lu S (2020) Spatial-Temporal Landscape Dynamics in the Hulunbeir Forest-Steppe Ecotone. Multifunctional Grasslands in a Changing World 1, 276
Liu Y, Xie M, Liu J, Wang H, Chen B (2022) Vegetation Disturbance and Recovery Dynamics of Different Surface Mining Sites via the LandTrendr Algorithm: Case Study in Inner Mongolia, China. Land 11, 856
| Vegetation Disturbance and Recovery Dynamics of Different Surface Mining Sites via the LandTrendr Algorithm: Case Study in Inner Mongolia, China.Crossref | GoogleScholarGoogle Scholar |
Luo W, Jasiewicz J, Stepinski T, Wang J, Xu C, Cang X (2016) Spatial association between dissection density and environmental factors over the entire conterminous United States. Geophysical Research Letters 43, 692–700.
| Spatial association between dissection density and environmental factors over the entire conterminous United States.Crossref | GoogleScholarGoogle Scholar |
Marlon JR, Bartlein PJ, Carcaillet C, Gavin DG, Harrison SP, Higuera PE, Joos F, Power MJ, Prentice IC (2008) Climate and human influences on global biomass burning over the past two millennia. Nature Geoscience 1, 697–702.
| Climate and human influences on global biomass burning over the past two millennia.Crossref | GoogleScholarGoogle Scholar |
Masson D, Knutti R (2011) Spatial-Scale Dependence of Climate Model Performance in the CMIP3 Ensemble. Journal of Climate 24, 2680–2692.
| Spatial-Scale Dependence of Climate Model Performance in the CMIP3 Ensemble.Crossref | GoogleScholarGoogle Scholar |
McKetta CW (1969) Some effects of terrain on the application of airborne infrared line scanners to forest fire detection. Doctoral dissertation.
Meng R, Dennison PE, Huang C, Moritz MA, D’Antonio C (2015) Effects of fire severity and post-fire climate on short-term vegetation recovery of mixed-conifer and red fir forests in the Sierra Nevada Mountains of California. Remote Sensing of Environment 171, 311–325.
| Effects of fire severity and post-fire climate on short-term vegetation recovery of mixed-conifer and red fir forests in the Sierra Nevada Mountains of California.Crossref | GoogleScholarGoogle Scholar |
Pickell PD, Hermosilla T, Frazier RJ, Coops NC, Wulder MA (2016) Forest recovery trends derived from Landsat time series for North American boreal forests. International Journal of Remote Sensing 37, 138–149.
| Forest recovery trends derived from Landsat time series for North American boreal forests.Crossref | GoogleScholarGoogle Scholar |
Powell SL, Cohen WB, Healey SP, Kennedy RE, Moisen GG, Pierce KB, Ohmann JL (2010) Quantification of live aboveground forest biomass dynamics with Landsat time-series and field inventory data: A comparison of empirical modeling approaches. Remote Sensing of Environment 114, 1053–1068.
| Quantification of live aboveground forest biomass dynamics with Landsat time-series and field inventory data: A comparison of empirical modeling approaches.Crossref | GoogleScholarGoogle Scholar |
Qiu J, Wang H, Shen W, Zhang Y, Su H, Li M (2021) Quantifying Forest Fire and Post-Fire Vegetation Recovery in the Daxin’anling Area of Northeastern China Using Landsat Time-Series Data and Machine Learning. Remote Sensing 13, 792
| Quantifying Forest Fire and Post-Fire Vegetation Recovery in the Daxin’anling Area of Northeastern China Using Landsat Time-Series Data and Machine Learning.Crossref | GoogleScholarGoogle Scholar |
Reygadas Langarica Y, Spera SA, Salisbury D, Galati V (2020) Mapping Forest Disturbances Across the Southwestern Amazon: Evaluation and Comparison of Optical Remote Sensing Algorithms. In ‘American Geophysical Union, Fall Meeting 2020, abstract #GC103-0003’. Available at https://ui.adsabs.harvard.edu/abs/2020AGUFMGC1030003R/abstract
Rupp TS, Chapin III FS, Starfield AM (2000) Response of subarctic vegetation to transient climatic change on the Seward Peninsula in north-west Alaska. Global Change Biology 6, 541–555.
| Response of subarctic vegetation to transient climatic change on the Seward Peninsula in north-west Alaska.Crossref | GoogleScholarGoogle Scholar |
San-Miguel-Ayanz J, Moreno JM, Camia A (2013) Analysis of large fires in European Mediterranean landscapes: Lessons learned and perspectives. Forest Ecology and Management 294, 11–22.
| Analysis of large fires in European Mediterranean landscapes: Lessons learned and perspectives.Crossref | GoogleScholarGoogle Scholar |
San-Miguel-Ayanz J, Durrant T, Boca R, Maianti P, Liberta G, Artes Vivancos T, Jacome Felix Oom D, Branco A, De Rigo D, Ferrari D, Pfeiffer H, Grecchi R, Nuitjen D (2020) Advance EFFIS report on forest fires in Europe, Middle East and North Africa 2019. EUR 30222 EN, Publications Office of the European Union, Luxembourg, JRC120692. Available at https://publications.jrc.ec.europa.eu/repository/handle/JRC120692
Seidl R, Thom D, Kautz M, Martin-Benito D, Peltoniemi M, Vacchiano G, Wild J, Ascoli D, Petr M, Honkaniemi J, Lexer MJ, Trotsiuk V, Mairota P, Svoboda M, Fabrika M, Nagel TA, Reyer CPO (2017) Forest disturbances under climate change. Nature Climate Change 7, 395–402.
| Forest disturbances under climate change.Crossref | GoogleScholarGoogle Scholar |
Shi L, Dech JP, Liu H, Zhao P, Bayin D, Zhou M (2019) Post-fire vegetation recovery at forest sites is affected by permafrost degradation in the Da Xing’an Mountains of northern China. Journal of Vegetation Science 30, 940–949.
| Post-fire vegetation recovery at forest sites is affected by permafrost degradation in the Da Xing’an Mountains of northern China.Crossref | GoogleScholarGoogle Scholar |
Siscawati M (1998) Underlying causes of deforestation and forest degradation in Indonesia: A case study on forest fire. In ‘Proceedings of the IGES International Workshop on Forest Conservation Strategies for the Asia and Pacific Region’ 21–23 July 1998. pp. 44–57 (Institute for Global Environmental Strategies) Available at https://www.iges.or.jp/en/publication_documents/pub/conferenceproceedings/en/744/1ws-7-mia.pdf
Song Y, Wright G, Wu P, Thatcher D, McHugh T, Li Q, Li SJ, Wang X (2018) Segment-Based Spatial Analysis for Assessing Road Infrastructure Performance Using Monitoring Observations and Remote Sensing Data. Remote Sensing 10, 1696
| Segment-Based Spatial Analysis for Assessing Road Infrastructure Performance Using Monitoring Observations and Remote Sensing Data.Crossref | GoogleScholarGoogle Scholar |
Su Y, Li T, Cheng S, Wang X (2020) Spatial distribution exploration and driving factor identification for soil salinisation based on geodetector models in coastal area. Ecological Engineering 156, 105961
| Spatial distribution exploration and driving factor identification for soil salinisation based on geodetector models in coastal area.Crossref | GoogleScholarGoogle Scholar |
Tadono T, Ishida H, Oda F, Naito S, Minakawa K, Iwamoto H (2014) Precise global DEM generation by ALOS PRISM. ISPRS Annals of the Photogrammetry, Remote Sensing and Spatial Information Sciences II-4, 71–76.
| Precise global DEM generation by ALOS PRISM.Crossref | GoogleScholarGoogle Scholar |
Takaku J, Tadono T, Tsutsui K (2014) Generation of High Resolution Global DSM from ALOS PRISM. International Archives of the Photogrammetry, Remote Sensing and Spatial Information Sciences XL-4, 243–248.
| Generation of High Resolution Global DSM from ALOS PRISM.Crossref | GoogleScholarGoogle Scholar |
Takaku J, Tadono T, Tsutsui K, Ichikawa M (2016) Validation of “AW3D” global DSM generated from ALOS PRISM. ISPRS Annals of the Photogrammetry, Remote Sensing and Spatial Information Sciences III-4, 25–31.
| Validation of “AW3D” global DSM generated from ALOS PRISM.Crossref | GoogleScholarGoogle Scholar |
Tang H, Li Z, Zhu Z, Chen B, Zhang B, Xin X (2015) Variability and climate change trend in vegetation phenology of recent decades in the Greater Khingan Mountain area, Northeastern China. Remote Sensing 7, 11914–11932.
| Variability and climate change trend in vegetation phenology of recent decades in the Greater Khingan Mountain area, Northeastern China.Crossref | GoogleScholarGoogle Scholar |
Thomas Ambadan J, Oja M, Gedalof ZE, Berg AA (2020) Satellite-Observed Soil Moisture as an Indicator of Wildfire Risk. Remote Sensing 12, 1543
| Satellite-Observed Soil Moisture as an Indicator of Wildfire Risk.Crossref | GoogleScholarGoogle Scholar |
Tucker CJ (1979) Red and photographic infrared linear combinations for monitoring vegetation. Remote Sensing of Environment 8, 127–150.
| Red and photographic infrared linear combinations for monitoring vegetation.Crossref | GoogleScholarGoogle Scholar |
van Wagtendonk JW, Root RR, Key CH (2004) Comparison of AVIRIS and Landsat ETM+ detection capabilities for burn severity. Remote Sensing of Environment 92, 397–408.
| Comparison of AVIRIS and Landsat ETM+ detection capabilities for burn severity.Crossref | GoogleScholarGoogle Scholar |
Verbesselt J, Hyndman R, Newnham G, Culvenor D (2010) Detecting trend and seasonal changes in satellite image time series. Remote Sensing of Environment 114, 106–115.
| Detecting trend and seasonal changes in satellite image time series.Crossref | GoogleScholarGoogle Scholar |
Viana-Soto A, Aguado I, Martínez S (2017) Assessment of Post-Fire Vegetation Recovery Using Fire Severity and Geographical Data in the Mediterranean Region (Spain). Environments 4, 90
| Assessment of Post-Fire Vegetation Recovery Using Fire Severity and Geographical Data in the Mediterranean Region (Spain).Crossref | GoogleScholarGoogle Scholar |
Viana-Soto A, Aguado I, Salas J, García M (2020) Identifying Post-Fire Recovery Trajectories and Driving Factors Using Landsat Time Series in Fire-Prone Mediterranean Pine Forests. Remote Sensing 12, 1499
| Identifying Post-Fire Recovery Trajectories and Driving Factors Using Landsat Time Series in Fire-Prone Mediterranean Pine Forests.Crossref | GoogleScholarGoogle Scholar |
Wang Z (2020) The Response of Soil Respiration to Wildfire Interference and Burned Area Management in the Permafrost Region of Da xing’an Mountains, Inner Mongolia (in Chinese). PhD thesis, Inner Mongolia Agricultural University.
Wang JF, Li XH, Christakos G, Liao YL, Zhang T, Gu X, Zheng XY (2010) Geographical detectors‐based health risk assessment and its application in the neural tube defects study of the Heshun Region, China. International Journal of Geographical Information Science 24, 107–127.
| Geographical detectors‐based health risk assessment and its application in the neural tube defects study of the Heshun Region, China.Crossref | GoogleScholarGoogle Scholar |
Wang J-F, Zhang T-L, Fu B-J (2016) A measure of spatial stratified heterogeneity. Ecological Indicators 67, 250–256.
| A measure of spatial stratified heterogeneity.Crossref | GoogleScholarGoogle Scholar |
Wang J, Wang C, Zang S (2017) Assessing re-composition of Xing’an larch in boreal forests after the 1987 fire, Northeast China. Remote Sensing 9, 504
| Assessing re-composition of Xing’an larch in boreal forests after the 1987 fire, Northeast China.Crossref | GoogleScholarGoogle Scholar |
Wang S, Zhong R, Liu L, Zhang J (2021) Ecological Effect of Ecological Engineering Projects on Low-Temperature Forest Cover in Great Khingan Mountain, China. International Journal of Environmental Research and Public Health 18, 10625
| Ecological Effect of Ecological Engineering Projects on Low-Temperature Forest Cover in Great Khingan Mountain, China.Crossref | GoogleScholarGoogle Scholar |
White J, Ryan K, Key C, Running S (1996) Remote Sensing of Forest Fire Severity and Vegetation Recovery. International Journal of Wildland Fire 6, 125–136.
| Remote Sensing of Forest Fire Severity and Vegetation Recovery.Crossref | GoogleScholarGoogle Scholar |
Wittenberg L, van der Wal H, Keesstra S, Tessler N (2020) Post-fire management treatment effects on soil properties and burned area restoration in a wildland-urban interface, Haifa Fire case study. Science of The Total Environment 716, 135190
| Post-fire management treatment effects on soil properties and burned area restoration in a wildland-urban interface, Haifa Fire case study.Crossref | GoogleScholarGoogle Scholar |
Xiao X, Boles S, Liu J, Zhuang D, Liu M (2002) Characterization of forest types in Northeastern China, using multi-temporal SPOT-4 VEGETATION sensor data. Remote Sensing of Environment 82, 335–348.
| Characterization of forest types in Northeastern China, using multi-temporal SPOT-4 VEGETATION sensor data.Crossref | GoogleScholarGoogle Scholar |
Xu C, Wang J (2016) Geodetector. Available at http://www.geodetector.cn/
Xu Q, Dong Y, Wang Y, Yang R, Xu C (2018) Determinants and identification of the northern boundary of China’s tropical zone. Journal of Geographical Sciences 28, 31–45.
| Determinants and identification of the northern boundary of China’s tropical zone.Crossref | GoogleScholarGoogle Scholar |
Yang J, Cooper DJ, Li Z, Song W, Zhang Y, Zhao B, Han S, Wang X (2020) Differences in tree and shrub growth responses to climate change in a boreal forest in China. Dendrochronologia 63, 125744
| Differences in tree and shrub growth responses to climate change in a boreal forest in China.Crossref | GoogleScholarGoogle Scholar |
Yang S, Lupascu M, Meel KS (2021) Predicting Forest Fire Using Remote Sensing Data And Machine Learning. Proceedings of the AAAI Conference on Artificial Intelligence 35, 14983–14990.
| Predicting Forest Fire Using Remote Sensing Data And Machine Learning.Crossref | GoogleScholarGoogle Scholar |
Yao Q, Brown PM, Liu S, Rocca ME, Trouet V, Zheng B, Chen H, Li Y, Liu D, Wang X (2017) Pacific-Atlantic Ocean influence on wildfires in northeast China (1774 to 2010). Geophysical Research Letters 44, 1025–1033.
| Pacific-Atlantic Ocean influence on wildfires in northeast China (1774 to 2010).Crossref | GoogleScholarGoogle Scholar |
Ying H, Zhang H, Zhao J, Shan Y, Zhang Z, Guo X, Rihan W, Deng G (2020) Effects of spring and summer extreme climate events on the autumn phenology of different vegetation types of Inner Mongolia, China, from 1982 to 2015. Ecological Indicators 111, 105974
| Effects of spring and summer extreme climate events on the autumn phenology of different vegetation types of Inner Mongolia, China, from 1982 to 2015.Crossref | GoogleScholarGoogle Scholar |
Yue Y, Liu H, Xue J, Li Y, Guo W (2020) Ecological indicators of near-surface permafrost habitat at the southern margin of the boreal forest in China. Ecological Indicators 108, 105714
| Ecological indicators of near-surface permafrost habitat at the southern margin of the boreal forest in China.Crossref | GoogleScholarGoogle Scholar |
Zhang Z, Wu Q, Xun X, Wang B, Wang X (2018) Climate change and the distribution of frozen soil in 1980–2010 in northern northeast China. Quaternary International 467, 230–241.
| Climate change and the distribution of frozen soil in 1980–2010 in northern northeast China.Crossref | GoogleScholarGoogle Scholar |
Zhang Y, Li D, Liu L, Liang Z, Shen J, Wei F, Li S (2021) Spatiotemporal Characteristics of the Surface Urban Heat Island and Its Driving Factors Based on Local Climate Zones and Population in Beijing, China. Atmosphere 12, 1271
| Spatiotemporal Characteristics of the Surface Urban Heat Island and Its Driving Factors Based on Local Climate Zones and Population in Beijing, China.Crossref | GoogleScholarGoogle Scholar |
Zhao FR, Meng R, Huang C, Zhao M, Zhao FA, Gong P, Yu L, Zhu Z (2016) Long-Term Post-Disturbance Forest Recovery in the Greater Yellowstone Ecosystem Analyzed Using Landsat Time Series Stack. Remote Sensing 8, 898
| Long-Term Post-Disturbance Forest Recovery in the Greater Yellowstone Ecosystem Analyzed Using Landsat Time Series Stack.Crossref | GoogleScholarGoogle Scholar |
Zheng K, Tan L, Sun Y, Wu Y, Duan Z, Xu Y, Gao C (2021) Impacts of climate change and anthropogenic activities on vegetation change: Evidence from typical areas in China. Ecological Indicators 126, 107648
| Impacts of climate change and anthropogenic activities on vegetation change: Evidence from typical areas in China.Crossref | GoogleScholarGoogle Scholar |
Zhu Z (2017) Change detection using landsat time series: A review of frequencies, preprocessing, algorithms, and applications. ISPRS Journal of Photogrammetry and Remote Sensing 130, 370–384.
| Change detection using landsat time series: A review of frequencies, preprocessing, algorithms, and applications.Crossref | GoogleScholarGoogle Scholar |
Zhu Z, Woodcock CE, Olofsson P (2012) Continuous monitoring of forest disturbance using all available Landsat imagery. Remote Sensing of Environment 122, 75–91.
| Continuous monitoring of forest disturbance using all available Landsat imagery.Crossref | GoogleScholarGoogle Scholar |
Zhu L, Meng J, Zhu L (2020) Applying Geodetector to disentangle the contributions of natural and anthropogenic factors to NDVI variations in the middle reaches of the Heihe River Basin. Ecological Indicators 117, 106545
| Applying Geodetector to disentangle the contributions of natural and anthropogenic factors to NDVI variations in the middle reaches of the Heihe River Basin.Crossref | GoogleScholarGoogle Scholar |