Associations between Australian climate drivers and extreme weekly fire danger
Rachel Taylor A * , Andrew G. Marshall B C , Steven Crimp A D , Geoffrey J. Cary A , Sarah Harris E and Samuel Sauvage BA
B
C
D
E
Abstract
We investigate the associations between major Australian climate drivers and extreme weekly fire danger throughout the year.
We use a composite-based approach, relating the probability of top-decile observed potential fire intensity to the positive and negative modes of the El Niño Southern Oscillation, Indian Ocean Dipole, Madden–Julian Oscillation, Southern Annular Mode, split-flow blocking and Subtropical Ridge Tasman Highs, both concurrently and at a variety of lag times.
The chance of extreme fire danger increases over broad regions of the continent in response to El Niño and positive Indian Ocean Dipole events, the negative mode of the Southern Annular Mode, split-flow Blocking Index and Subtropical Ridge Tasman High, and Madden–Julian Oscillation phases 5, 6, 2 and 8 in Austral summer, autumn, winter and spring respectively. These relationships exist not only concurrently, but also when a climate event occurs up to 6 months ahead of the season of interest.
These findings highlight the importance of considering the influence of diverse climate drivers, at a range of temporal lag periods, in understanding and predicting extreme fire danger.
The results of this study may aid in the development of effective fire management strategies and decision-making processes to mitigate the impacts of fire events in Australia.
Keywords: Australian Fire Danger Rating System, blocking highs, climate drivers, El Niño Southern Oscillation, fire intensity, fire risk, Indian Ocean Dipole, Madden–Julian Oscillation, Southern Annular Mode.
Introduction
Recent events and literature have highlighted an increasing frequency of extreme fire conditions over recent decades (Clarke et al. 2013; Clarke and Evans 2018; CSIRO and Bureau of Meteorology 2020; United Nations Environment Programme 2022), together with lengthening fire seasons (Clarke et al. 2013; Jolly et al. 2015; Dowdy 2018). These changes are expected to be exacerbated as climate change progresses, presenting increasingly severe challenges and impacts for the Earth system and human populations. As a bushfire-prone continent, Australia is at particular risk of more extreme fire conditions and more severe impacts driven by ongoing warming and drying (Murphy et al. 2013; Sharples et al. 2016)
There is some evidence that recent droughts, particularly in southern Australia, are unusual or unprecedented over the last 400 years (Freund et al. 2017). Observed warming and drying in Australia vary spatially and seasonally; however, southern Australia in particular has experienced a reduction in cool season rainfall in recent decades (Lawrence et al. 2022), connected to an increasing frequency and duration of droughts (Nicholls 2004). These rainfall deficits and droughts – projected to worsen in a warming climate (Lawrence et al. 2022) – are caused by modes of climate variability now forced beyond the natural range by anthropogenic climate change (Schiermeier 2018; van Oldenborgh et al. 2020; Philip et al. 2021). The El Niño Southern Oscillation (ENSO), Indian Ocean Dipole (IOD) and Southern Annular Mode (SAM) are examples of modes of variability that have contributed to severe fires in the past (van Oldenborgh et al. 2020; Wang and Cai 2020; Bureau of Meteorology 2021) with devastating environmental, human, social and economic consequences (Parkinson and Zara 2013; Mulkern 2019; Biddle et al. 2020; Borchers Arriagada et al. 2020; Dickman and McDonald 2020; Molyneaux et al. 2020; Quiggin 2020; Read and Denniss 2020; United Nations Environment Programme 2020; Canadell et al. 2021). However, many of these impacts could be mitigated through improved planning and preparedness, including greater antecedent fuel management, suppression and community preparedness, which are key activities for minimising the effects of the ‘worldwide wildfire problem’ (Gill et al. 2013; Mulkern 2019; Biddle et al. 2020).
Australia has recently adopted a new fire danger rating system that incorporates a measure of potential fire intensity to define fire danger conditions. This metric of fire danger is critical to operational fire management. As such, it is important to understand how it is affected by the multitude of climate drivers that impact Australian weather and other fire danger metrics. These drivers include the ENSO, IOD, SAM (Risbey et al. 2009), Madden–Julian Oscillation (MJO), alternative modes of split-flow blocking and persistent anticyclones in the Tasman sea region (Sub-Tropical Ridge Tasman Highs; STRH) (Marshall et al. 2021). By analysing the effects of climate modes as mechanisms potentially influencing extreme fire conditions with varying time lag periods – i.e. how a climate event influences fire danger in the coming months – we can contribute to improved prediction and better-informed early preparation for severe fire seasons. These insights can inform the need for earlier fuel reduction, enhanced firefighter and volunteer recruitment, and training and positioning of firefighters and response equipment, community preparedness activities and raising awareness for industry to potentially reduce the occurrence of large unplanned fires and mitigate some of the extreme impacts that Australia has experienced in recent years.
Data and methods
We examine concurrent relationships among climate drivers and fire intensity for each Austral season: summer is December–February (DJF); autumn is March–May (MAM); winter is June–August (JJA); spring is September–November (SON). Specifically, we evaluate the potential for upper-decile Potential Fire Intensity (PFI) according to phases of the ENSO, IOD, SAM, Blocking index (BI), STRH and MJO in each season. For seasonal timescale drivers (ENSO, IOD and SAM), we additionally analyse the relationships with potential for extreme PFI that occur when the driver is active 1–3 months (1–6 in the case of ENSO) ahead of the season of interest.
Potential Fire Intensity describes the expected fireline intensity, should a fire ignite, as a function of fuel type, fuel load and weather conditions. PFI data are taken from the Australian Fire Danger Rating System (AFDRS) hindcasts and climatologies, where the equations for the input variables differ by fuel type but fireline intensity I is calculated using Byram’s (1959) fireline intensity equation:
where H is the fuel heat of combustion (kJ/kg), w is the amount of fuel consumed in the fire front (kg/m2) and r is the rate of spread (m/s).
The AFDRS climatology historical weather and climate data are sourced from the Bureau of Meteorology Atmospheric high-resolution Regional Reanalysis for Australia (BARRA, Su et al. 2019). BARRA presents the best available weather reanalysis for Australia at the time of writing. Grass curing and drought factor are based on historical Bureau of Meteorology datasets. Forest fuel loads are represented by time since fire derived from fire history databases, and grass fuel loads are fixed based on climate zones (Sauvage et al. 2019). The climatology is limited by the short (10 year) analysis period, which prevents study of longer-term patterns, limits available information in environments with longer intervals between fire events and confines the analysis period to a warmer and wetter than average climate state (Benger et al. 2022). Extension of the climatology dataset would improve confidence in the AFDRS products and analyses. The system is still in a developmental stage and is continuously being improved on in a way that was not easily possible using the McArthur (1966) system. This means that the underlying fuel models may be further revised and the data used in this study may not be the final products, though they represent the latest data available at the time of analysis. Further operational and conceptual improvements could be gained from more advanced fuel state inputs as current AFDRS outlooks tend to over- or under-estimate PFI when curing is more or less advanced than the climatology (Benger et al. 2022).
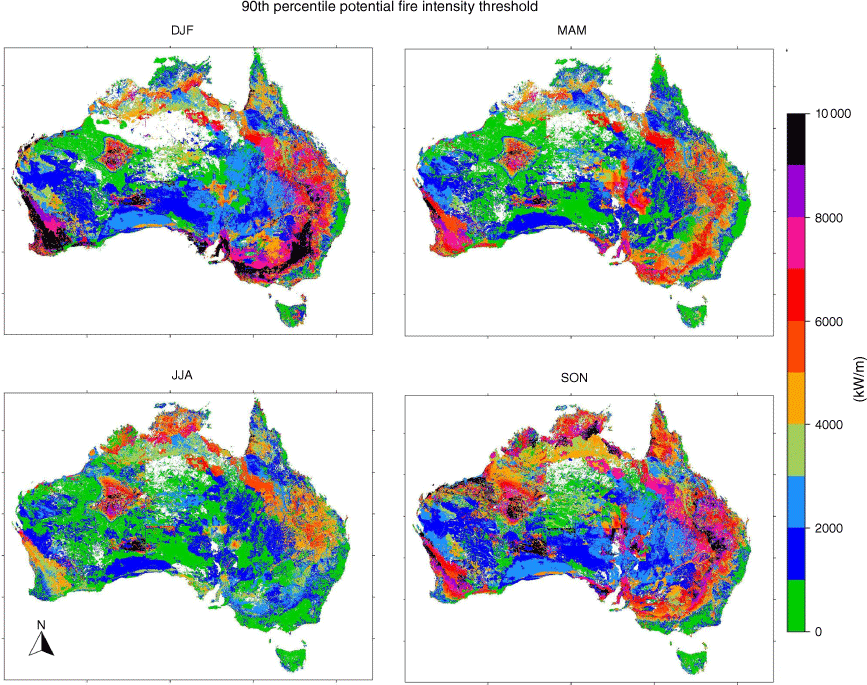
We define extreme PFI as a value above the 90th percentile for a given cell, with percentiles calculated from the full time series of climatology data (2003–2012, Gregory 2021, Fig. 1). Geographic variation of 90th percentile PFI across Australia (Fig. 1) is a function of spatial patterns of both climate and vegetation (Kenny et al. 2019). Fire intensity data in Fig. 1 are presented on a 0.05° grid (Jones et al. 2009) and calculated as 7-day running means. The weekly timescale aligns with the Bureau of Meteorology weather and fire weather forecasts and can be used by fire management agencies to make response decisions such as resource positioning and community alert levels. When examining the effect of a climate driver phase occurring 1–3 months ahead of the target season, 7-day running means are retained for the index defining each driver (Table 1) but the longer outlook may provide useful information for longer-term management decisions such as hazard reduction burning, resourcing requirements and community preparedness activities for an upcoming fire season.
The 90th percentile thresholds of weekly-mean PFI (kW/m) for DJF (top left), MAM (top right), JJA (bottom left) and SON (bottom right). White space denotes areas with insufficient data to calculate intensity thresholds.
| Driver | Index | Reference study | |
|---|---|---|---|
| MJO | Real-time Multivariate MJO series 1 and 2 | Wheeler and Hendon (2004) | |
| ENSO | NINO-3.4 | Trenberth (1997) | |
| IOD | Dipole Mode Index | Saji and Yamagata (2003) | |
| SAM | Antarctic Oscillation Index | Gong and Wang (1999) | |
| Split-flow blocking | Blocking Index | Pook and Gibson (1999) | |
| STRH | STRH Index | Marshall et al. (2014) |
All climate drivers (Table 1) were selected owing to their expected influence on potential fire intensity. We define a positive phase of each driver as when the index strength is greater than one standard deviation above the 2003–2012 mean, and vice versa for the negative phase (Marshall et al. 2014, 2021). The mean and standard deviation were calculated for all observations from 2003 to 2012. Thus, a total of 3653 weekly-mean data points at daily resolution were used to calculate the means and standard deviations for each climate driver index. The index phases were scaled relative to these means and standard deviations, then separated by season. Daily index values were used for analysis. Raw data used to construct the indices originate from the National Centers for Environmental Prediction and National Center for Atmospheric Research (NCEP/NCAR) Reanalysis 1 (Kalnay et al. 1996). Daily values are defined by the central day of the 7-day running mean. Following the finding by Marshall et al. (2021) removing effects of other climate drivers through linear regression had minimal effect on findings, we did not remove concurrent climate driver effects.
Many of the drivers analysed have a range of indices that can be chosen to quantify them. We adopted specific indices representing climate drivers, as defined by the Australian Bureau of Meteorology (Table 1). This ensures the greatest relevance of this study to Australian bushfire management activities and the research field. In addition, the indices used by the Bureau are well researched and known to have high relevance for explaining Australian climate variations. For instance, the relevance of the NINO-3.4 index for defining variation in the ENSO is supported by findings that Australian rainfall is more strongly affected by sea surface temperatures (SSTs) towards the central Pacific Ocean as opposed to the previously used NINO-3 region in the eastern Pacific (Wang and Hendon 2007; Ma et al. 2022). Other ENSO indices also show strong correlations with Australian rainfall (Risbey et al. 2009) and there are opportunities for further investigation into the effects of these, and of alternative indices for other drivers, on the probability of extreme PFI.
We use a composite analysis to assess fire danger probabilities as in Marshall et al. (2021). A correlation approach has been taken in some previous studies, but this has the potential to mask the asymmetric impacts of the positive and negative phases of climate drivers. Thus, the probability of extreme PFI is assessed in relation to the positive and negative phases of climate modes separately. We calculate the probability of extreme fire potential for each phase of each driver, using the method of Marshall et al. (2021). Specifically, we construct a list of ‘hits’ and ‘misses’ to assess the extent of association. A ‘hit’ occurs when PFI greater than the 90th percentile co-occurs with the climate driver of interest in the phase being evaluated. A ‘miss’ occurs when the given driver is in the phase of interest, but fire intensity is below the 90th percentile. The mean of this composite gives the absolute probability of an episode of extreme PFI. This probability is divided by the climatological probability of an episode of top-decile PFI, which is 0.1 by definition. This results in a probability ratio representing the difference in likelihood of extreme PFI associated with the driver of interest. Probability ratios greater than one represent increased likelihood of extreme fire intensity associated with the given climate driver mode, and probabilities of less than one a decreased likelihood.
Results and discussion
El Niño Southern Oscillation
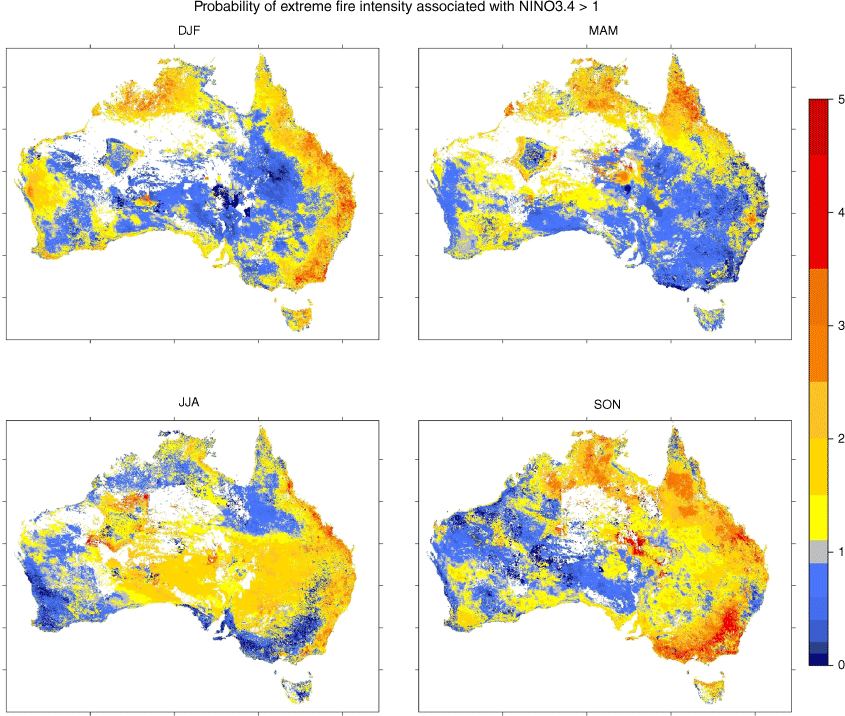
El Niño events are associated with increased probability of extreme PFI over much of Australia, with the greatest impacts occurring mainly in the east and southeast (Fig. 2), congruent with the strongest influence of El Niño on temperature and rainfall (e.g. Risbey et al. 2009). The highest probability ratios occur in southeast Australia in SON, which is a key season for impacts of mature El Niño events. Prominent increases in the chance of top-decile PFI also occur in the rest of eastern, central and northern Australia in SON, much of the east coast and western Australia in DJF, northern Australia in MAM and the majority of central and eastern Australia in JJA. MAM is generally the early development or late decay phase of El Niño. The rainfall and temperature impacts of El Niño are different during these two phases (Freund et al. 2021), which may have resulted in the lack of a strong El Niño PFI signal in southeastern Australia.
El Niño events 1–2 months ahead of DJF are associated with increased likelihood of extreme PFI broadly across Australia (Fig. 3). This signal gradually decays over the preceding 4 months except in areas of southern Australia, predominantly featuring woodland fuels. This may reflect the longer response time of coarse woodland fuel and deep litter layers to the drying effect of El Niño, whereas finer fuel types such as fine litter or grasses respond more rapidly in response to a weakening or reversal of El Niño closer to the target season (Sullivan et al. 2012).
Ratio of probabilities of upper-decile weekly PFI events for El Niño 0 (left column) to 6 (rightmost column) months ahead of the target season for DJF (top row), MAM (2nd row), JJA (3rd row) and SON (bottom row).
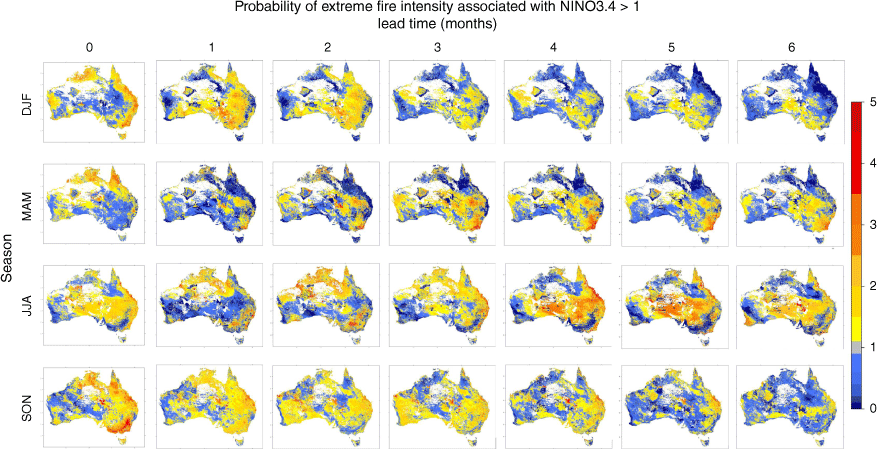
In MAM, there is a strengthening signal of El Niño increasing the chance of extreme PFI in southeast Australia over longer time-lag periods of up to 3 months. Rainfall reduction associated with El Niño is generally greatest in Austral spring, and this stronger signal may be the cause of the lead time of 3 months at which time the signal becomes strongest.
In JJA, the effect of El Niño events at 4 months’ lead time on the probability of extreme PFI closely replicates the concurrent JJA effect. However, up to 3 months ahead, El Niño events are associated with increased likelihood of top-decile PFI in northern Australia. This is pertinent because JJA is the active fire season in the far north. El Niño events leading up to JJA may increase the severity of northern Australian fire seasons through the effects on the strength and timing of the monsoon (Wang et al. 2003; Harris and Lucas 2019; Bureau of Meteorology 2021). Recent reanalyses suggest El Niño events do not significantly delay monsoon onset and that strong La Niña events are the more influential mechanism (Lisonbee and Ribbe 2021); however, some definitions of onset date are still found to be significantly correlated with the NINO3.4 index, and the relationships between El Niño and monsoon strength are still valid (Wang et al. 2003; Kim et al. 2006; Wang et al. 2008).
Probability of extreme SON PFI with preceding El Niño events remains mostly consistent with the concurrent association at lead times of up to 4 months, except for a tendency for the signal to become weaker in southeast Australia but more widespread across the south of the continent. El Niño events typically mature fully in these winter months, having their greatest impact on Australian rainfall in JJA and SON (Wang and Hendon 2007; Bureau of Meteorology 2021). This would serve to dry any existing fuel, rendering it more prone to early intense fires in SON (Riley et al. 2013; Harris and Lucas 2019). A marked decrease in the probability of extreme PFI at 5–6 months’ lead may again indicate the mixed or weak effects of developing and decaying El Niño events on Australian weather (Freund et al. 2021). This decrease could additionally be due to low soil moisture in summer–autumn leading to slower or less fuel growth in southern Australian forests (Burrows et al. 1995).
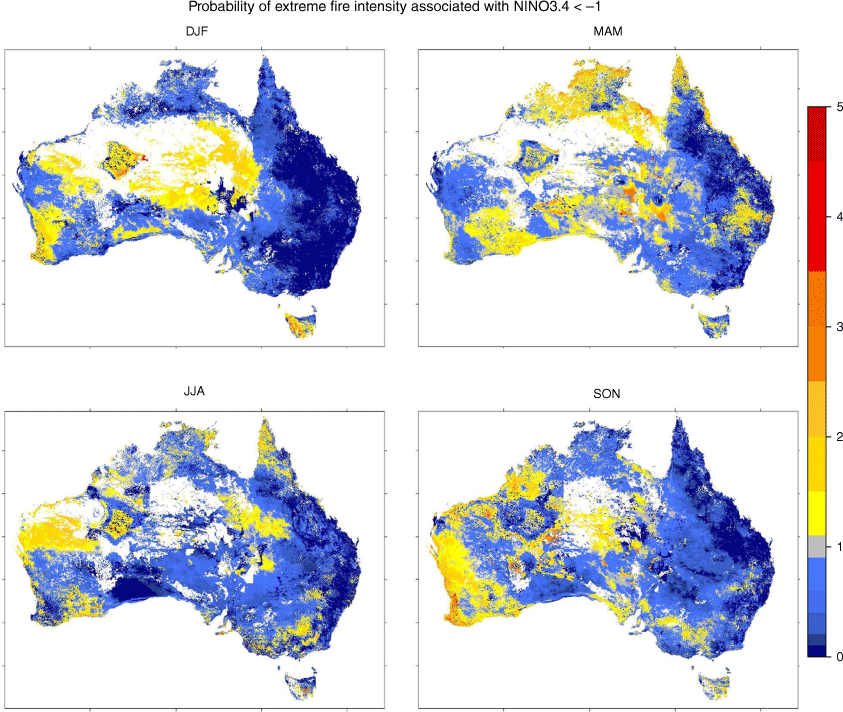
La Niña is associated with a decreased probability of extreme PFI across most of Australia in all seasons (Fig. 4). This is likely due to the tendency for La Niña to bring increased rainfall and lower maximum temperatures (e.g. Risbey et al. 2009). There are some isolated exceptions to this association, including in central and northern Australia in MAM, southwest Western Australia in SON, and west and southwest Tasmania. For much of the time, fire is constrained by insufficient fuel across large areas of central Australia, so La Niña events may bring sufficient rainfall and fuel growth that the likelihood of extreme PFI is increased (Burrows et al. 1995; Bird et al. 2016; Harris and Lucas 2019). In southwest Western Australia, the effect of La Niña is slight (Ceranic 2020), with the region generally receiving mean rainfall in the fifth or sixth deciles during La Niña years (Bureau of Meteorology 2022a). As recent evidence of the impact of this anomalous response, despite La Niña conditions persisting from 2020 to 2023 (NOAA 2023), parts of Western Australia experienced dry conditions and above-average fire potential in both the 2020–2021 (AFAC 2021) and 2021–2022 seasons (AFAC 2022). This was realised in events such as the 10 500 ha Wooroloo fire in February 2021 (9 News Staff 2021) and the 40 000 ha Wheatbelt fire in February 2022 (Vieira et al. 2022). Given the limited impact of ENSO on Western Australia, and a generally dry period in southwest Western Australia over the analysis period, it could be expected that southwest Western Australia would show an increased probability of extreme PFI even in La Niña events. In Tasmania, the anomalous easterly winds prevailing in a La Niña event drive increased rainfall in the northeast, but act to reduce the usual orographic rainfall in the northeast, leading to drier conditions that are the likely cause of elevated chances of extreme PFI during these events.
Lead relationships for La Niña events prior to DJF and MAM are difficult to analyse due to the timing of events in the record (Fig. 5). After the first year of the record (2003), there are no La Niña events until August 2007, after which La Niña events persist until June 2008. A similar clustering of events occurs later in the record, complicating the effect of stepping the index time back. This causes the first three lead analyses in DJF and all lead analyses in MAM to be identical to one another. These results will not be analysed in depth in this work, but future research could consider alternative definitions and longer records of La Niña events to more accurately assess their impact on following fire seasons.
Ratio of probabilities of upper-decile weekly PFI events for La Niña 0 (left column) to 6 (rightmost column) months ahead of the target season for DJF (top row), MAM (2nd row), JJA (3rd row) and SON (bottom row).
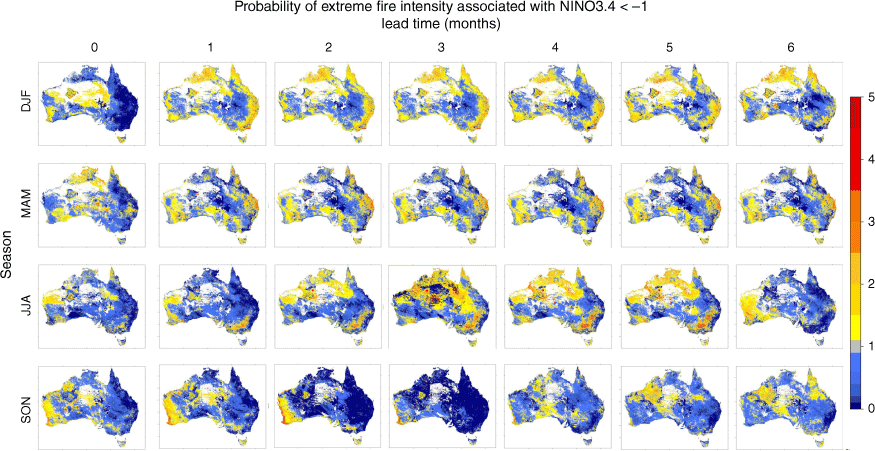
In the remaining times and seasons, a La Niña up to 6 months prior to the season of interest generally decreases the probability of extreme monthly-mean PFI over the majority of Australia, though with some notable exceptions (Fig. 4). Effects in the 3 months prior tend to mimic the effects of a concurrent La Niña event. Given that La Niña events typically last from autumn or winter through to the following autumn, this is not unexpected. One exception to this trend is when a La Niña event occurs at 2–5 months’ lead time preceding the JJA fire season in northern Australia. This is likely due to the tropical wet season being wetter and warmer than average, encouraging fuel growth before the dry season, making the fuel available to burn (Williams and Griffiths 1999; Williams et al. 2009; Harris and Lucas 2019). In other seasons, the results show some other notable increases in extreme PFI probability with lead time. La Niña events from winter–spring are associated with increased probability of extreme PFI in southwest Western Australia. This region is generally not impacted by La Niña events, being furthest from the influence of the Pacific. Additionally, the 2010–2011 La Niña event coincided with record-low rainfall in the southwest (Ceranic 2020), which would have impacted this analysis.
Indian Ocean Dipole
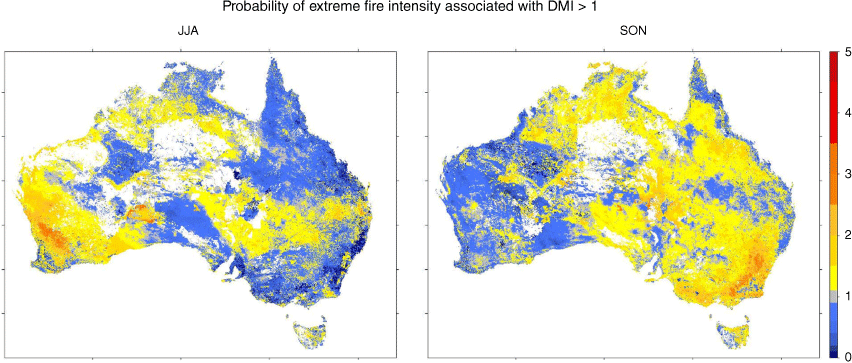
The IOD is active during JJA and SON, decaying rapidly with the onset of the monsoon around December. Its concurrent effects are therefore visible only in JJA and SON (Fig. 6). A positive IOD results in higher likelihood of extreme PFI across much of southwest Australia in JJA, but given that fires are typically not active in these areas in JJA, this is unlikely to have practical implications unless it influences the window of opportunity for planned burns, especially as climate change continues to bring temperature increases to the region. The positive IOD also increases the chance of extreme PFI in most of eastern Australia in SON. Similar effects were found by Harris and Lucas (2019) and Marshall et al. (2021). The reduced rainfall over southern Australia in a positive IOD (Risbey et al. 2009) is likely to cause fuel drying and reduced soil moisture, influencing the chance of extreme PFI.
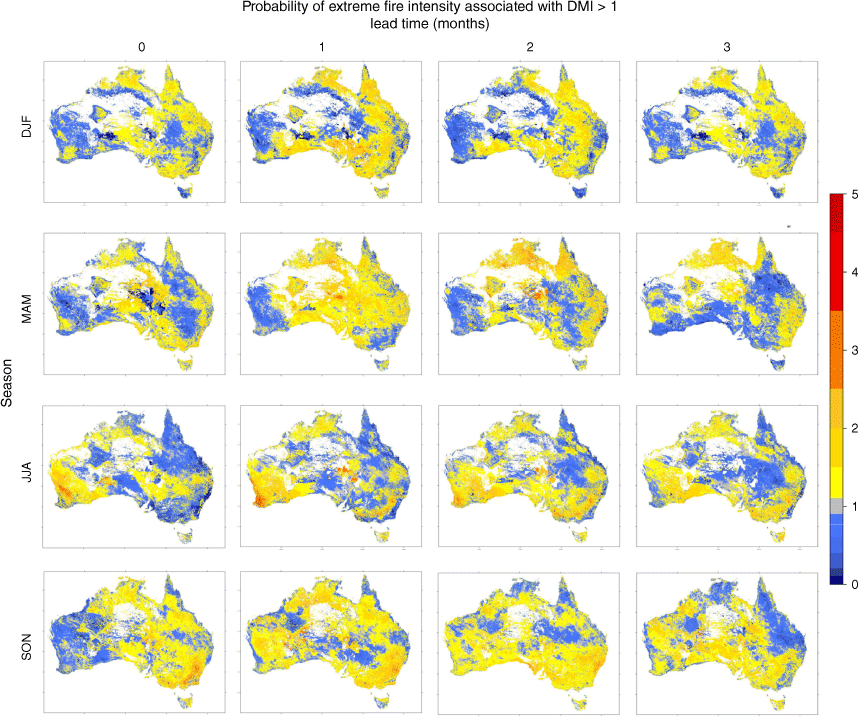
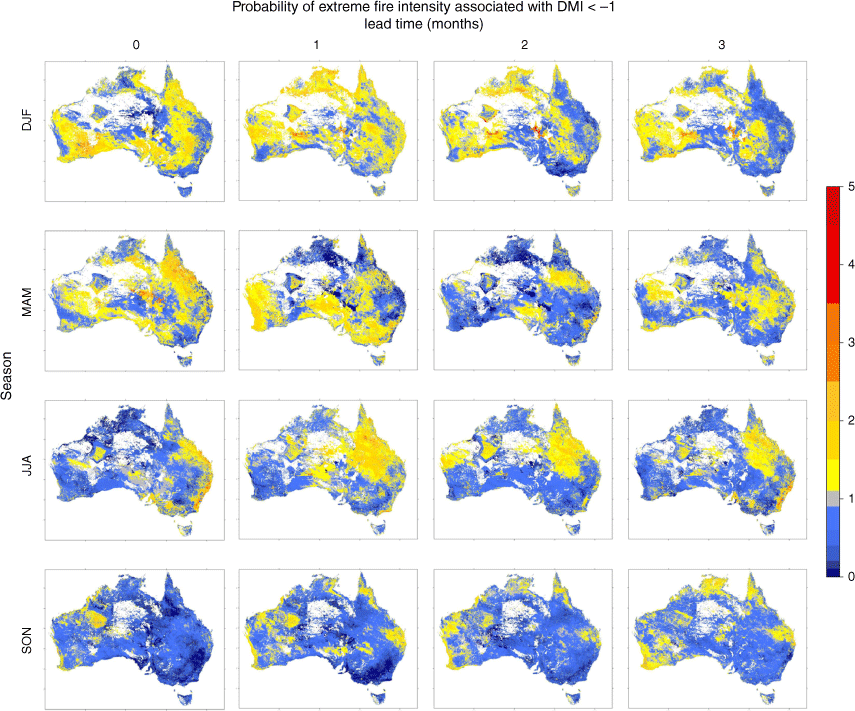
IOD events occurring in JJA and SON have considerable impact on upcoming fire seasons in southern and eastern Australia (Fig. 7). However, extra caution should be exercised when interpreting Fig. 7, as the IOD is inactive in many of the months depicted. Positive IOD events in SON, 3–4 months ahead of the DJF fire season in southern Australia, tend to be associated with slightly increased chances of extreme PFI across much of eastern and southern Australia. Leading up to JJA, positive IOD events are associated with marked increases in the probability of extreme PFI in southwest Western Australia, which is consistent with the decreased rainfall expected during positive IOD events. Increased chances of extreme PFI are also observed in Victoria, which is expected again owing to the rainfall patterns, but is not replicated in concurrent associations. Some of the major IOD events in the analysis period were associated with low rainfall in Victoria in winter, but higher rainfall in the spring, which may have contributed to this result because the grassland fuel types in the region respond quickly to changes in moisture and temperature. As expected, in the lead-up to SON, positive IOD events are associated with higher chances of extreme PFI across most of Australia, particularly the south. Drier conditions over southern Australia in winter associated with the positive IOD would not necessarily limit fuel growth, but rather dry out the existing fuels.
A negative IOD in JJA is associated with increased likelihood of extreme PFI on the east coast of Australia. This unexpected result (Australian Bureau of Meteorology 2016) is attributable to the large number of atypical negative IOD events between 2003 and 2012. JJA 2004, June and August 2005, August 2010 and June 2011 were identified as strong negative IOD events. In JJA 2004, a strong negative rainfall anomaly occurred on the New South Wales (NSW) coast and Queensland (Qld). In August 2005, low rainfall was again observed on the NSW coast. August 2010 brought negative rainfall anomalies in southwest Western Australia (WA), and July 2011 saw low rainfall in inland NSW. These anomalous rainfall events associated with negative IOD events made up a significant proportion of the sample and may have contributed to the unexpected results (Fig. 8).
Ratio of probabilities of upper-decile weekly PFI events for negative IOD events in JJA (left) and SON (right).
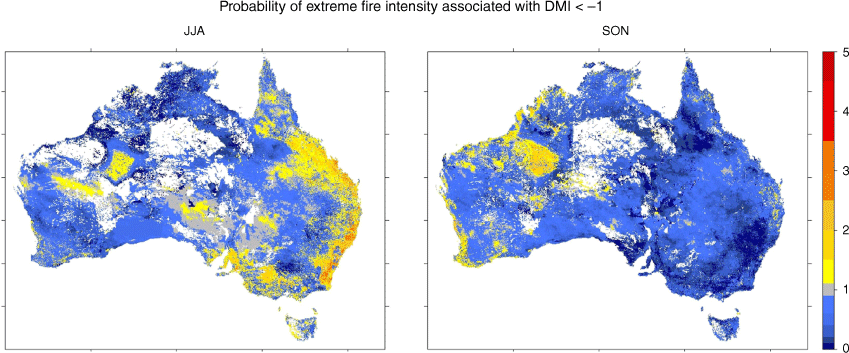
In SON, a negative IOD event relates to reduced likelihood of extreme PFI over most of Australia. This is also in agreement with the findings of Harris and Lucas (2019) and Marshall et al. (2021) and reflects the increased rainfall and lower temperatures associated with negative IOD events (Australian Bureau of Meteorology 2016).
Negative IOD events generally lead to lower probability of extreme PFI in the following months (Fig. 9), with some exceptions. A negative IOD in SON is associated with increased chances of extreme PFI in parts of central Australia where the increased rainfall may encourage fuel growth in this fuel-limited region, which then dries out rapidly with warmer, drier conditions. Increased probabilities of extreme PFI in Qld associated with negative IOD events leading up to JJA may signal that early-season intense fires could be expected in Qld when a negative IOD is present in winter. Leading up to SON, however, negative IOD events are associated with an almost uniform decrease in probabilities of extreme PFI across Australia.
Southern annular mode
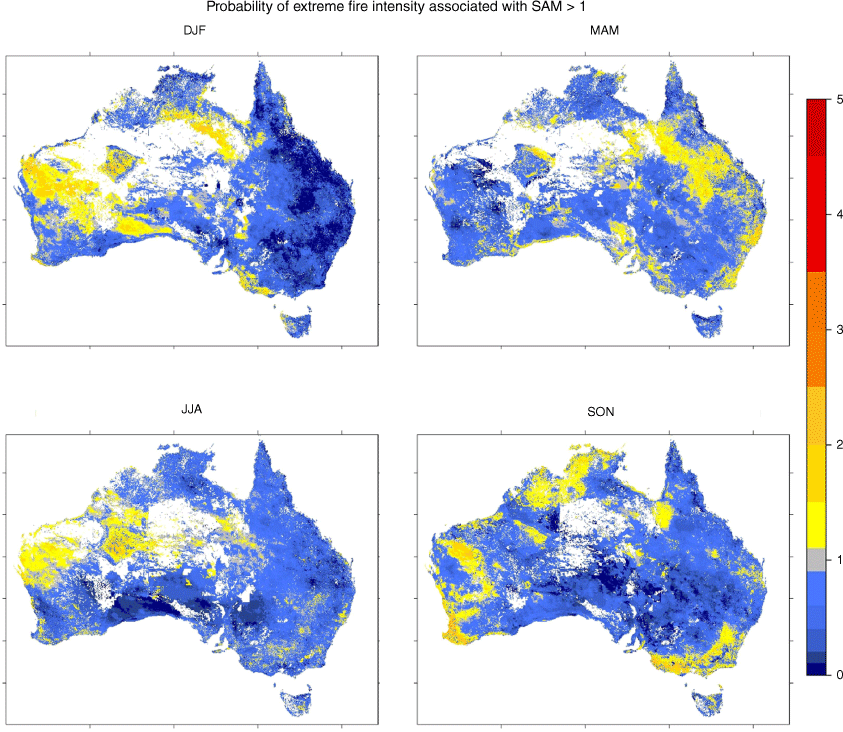
The SAM has complex impacts on Australian rainfall that vary with the seasons (Hendon et al. 2007). The positive SAM is associated with higher rainfall across much of southern Australia, especially in spring and summer. The results are consistent with this, displaying reduced probability of extreme PFI over most of the mainland, with increased probability in western Tasmania in DJF associated with weakened westerlies and reduced orographic rainfall (Fig. 10). Despite the reduction in southern Australian rainfall expected with positive SAM events in autumn and winter, the probability of extreme PFI does not increase in these regions.
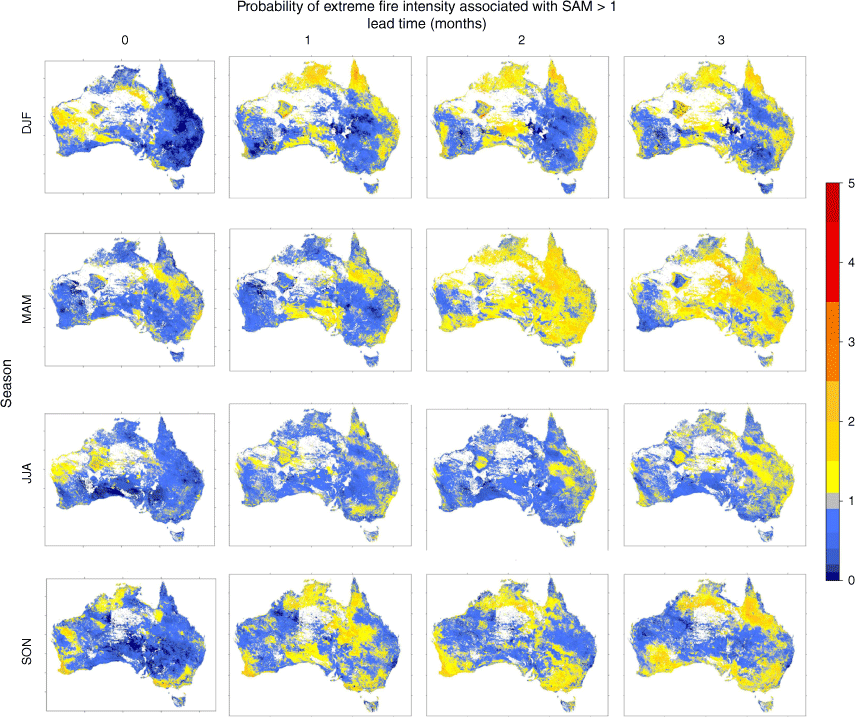
A positive SAM up to 3 months ahead of DJF is associated with increased probability of extreme PFI in areas of northern Australia and the east coast (Fig. 11). The strength and persistence of the signals are surprising, especially given the decreased probability ratios in these areas that occur with positive SAM events. Increased rainfall in spring and heightened fuel loads could be responsible for the increased probability ratios on the east coast, but no effect of the SAM on rainfall in the northern regions in spring has been recorded. Increased fuel loads across much of southern and eastern Australia could also be the cause for widespread increases in probability of extreme PFI in autumn associated with a positive SAM between December and March. Conversely, dry conditions between June and September/October could be the cause of increased spring PFI in southeast and southwest Australia as low rainfall throughout the winter months would encourage fuel curing without decreasing fuel load.
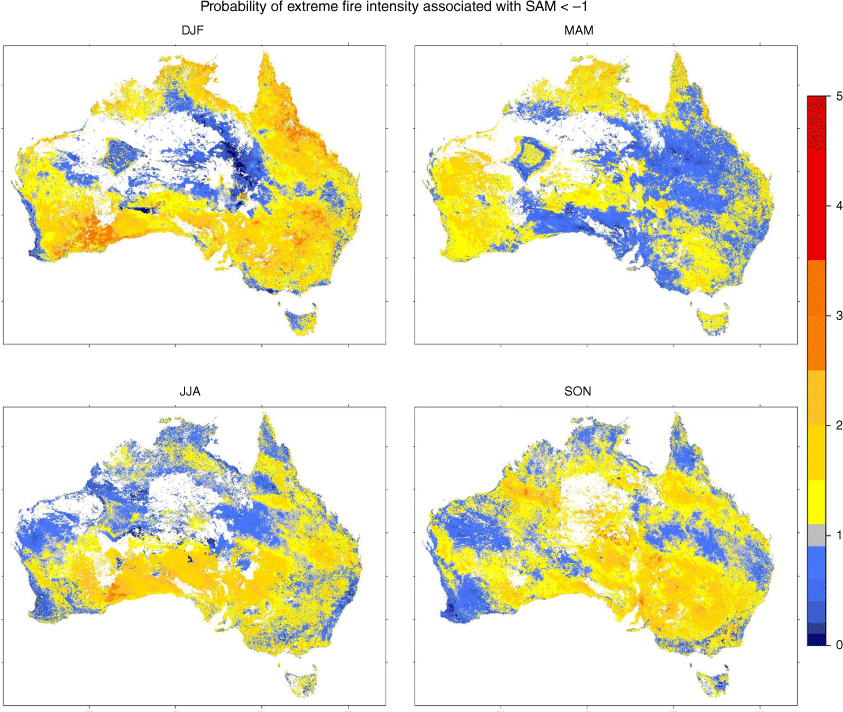
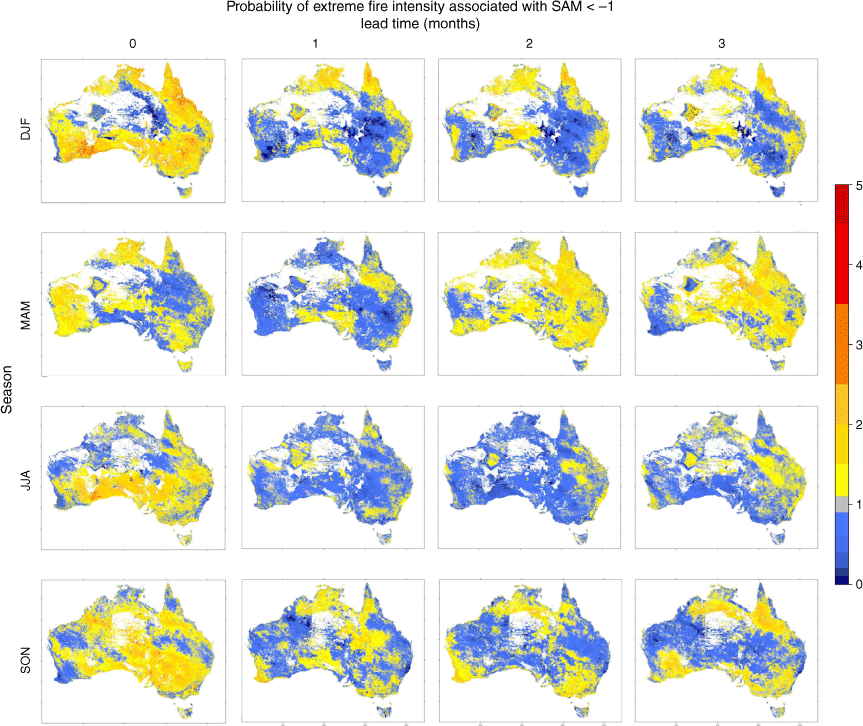
The negative phase of the SAM shows the opposite associations with the probability of extreme PFI (Fig. 12). Probability ratios increase over broad regions of Australia in all seasons. The greatest response is seen in summer, with weekly-mean extreme PFI being up to three times more likely in areas of southeast, southwest and northeast Australia. Probability increases of a similar magnitude are also observed in winter, but limited to the grassy regions of the Great Australian Bight. In spring, chances of extreme PFI increase from the northwest to southeast and in central Queensland. Increases in probability ratios are slightest in autumn and are mostly confined to the southwest and central north. The effect of the negative SAM on orographic rainfall in Tasmania is evident from the decreased probability ratios in western Tasmania in summer and winter. The increase in probability in this region in spring is not in agreement with the findings of Hendon et al. (2007), and the reasons for this are a topic for further investigation.
The probability of extreme summer PFI increases in the north and east of Australia when the SAM is negative in September–December, but decreases with negative SAM in November–January (Fig. 13). The negative SAM in November–January is instead associated with increased probability of extreme PFI in the southwest. Both these regions usually experience decreased rainfall during negative SAM events, and the differences in response times or seasonality could be due to differing fuel types. Much of eastern Australia is woodland, whereas the area of southwest Australia in consideration is mostly grassland (despite the coastal margin of southwest western Australia being forest), which would react more quickly to changes in moisture availability. Associations between autumn potential for extreme PFI and preceding negative SAM events are weak. In the 2 months leading up to autumn, there are increases in potential in the southwest, where increased potential also occurs concurrently with an autumn negative SAM. Winter chances of extreme PFI are similar whether a negative SAM event occurs during winter or up to 2 months in advance. When a negative SAM event occurs in autumn, this is associated with increased chances of extreme winter PFI in southwest Australia, excluding the most extreme tip of the continent. A negative SAM in autumn tends to produce drier conditions in the area of southeast Australia that experiences heightened chances of extreme PFI, and wetter conditions where the probability is reduced. As little fuel growth occurs between autumn and winter, it is possible that drier conditions associated with the effects of the autumn negative SAM cause fuel curing, which persists through to winter. When the negative SAM event occurs between winter and spring, this is not associated with particularly consistent impacts on the probability of extreme PFI. Spring probability ratios are slightly elevated across eastern Australia when a negative SAM event occurs in winter, and in parts of southern Australia when the SAM is negative between July and October. Overall though, spring chances of extreme PFI do not seem strongly influenced by preceding negative SAM events.
Persistent/blocking high pressure
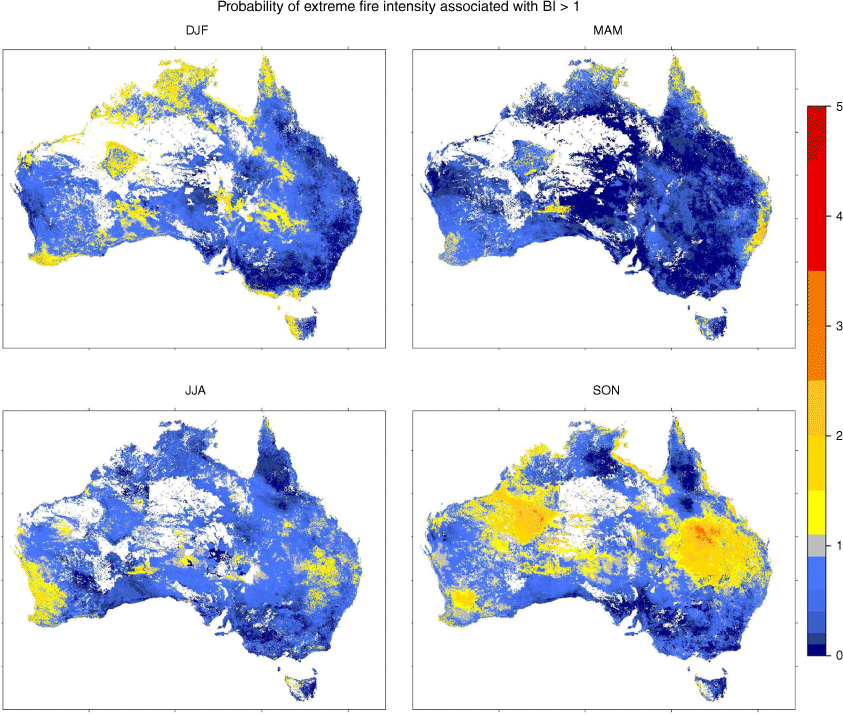
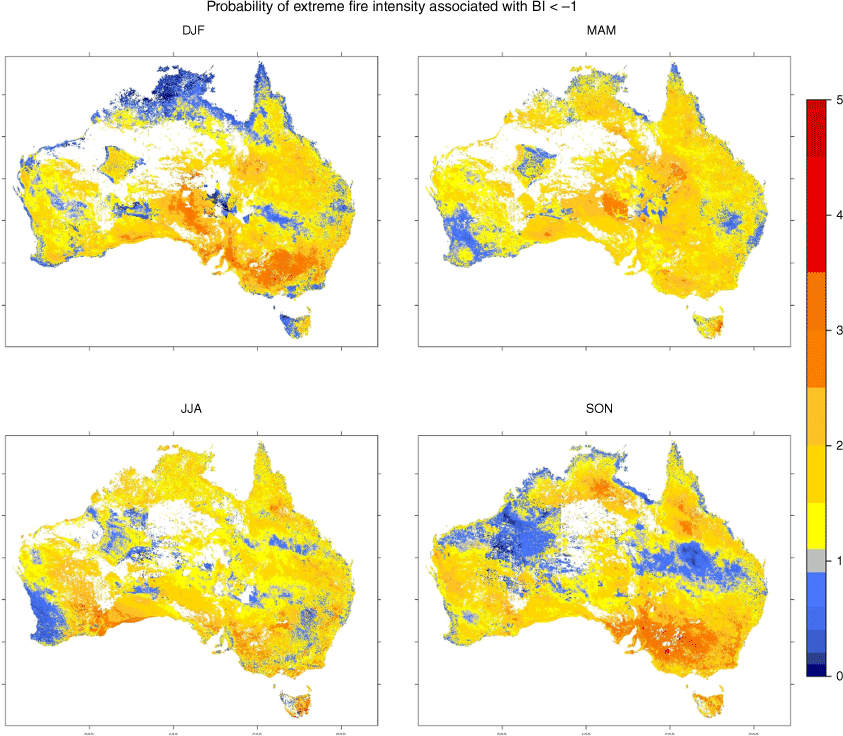
High blocking activity is associated with reduced probability of extreme PFI over the majority of Australia, associated with reduced mid-latitude westerly flow in all seasons except SON (Fig. 14). A notable exception to this pattern is that the probability of extreme PFI is increased in western Tasmania, which represents the reduced orographic rainfall compared with what this region would experience in normal or low split-flow-blocking activity. In SON, there are areas of heightened probabilities in central Queensland and the Great Sandy Desert. The increase in Queensland may be related to enhanced westerly flow encouraging hot, dry air advection over the region, which would also be induced by the increased strength or frequency of low pressure systems over southern Australia, with cyclonic winds also drawing hot air over northern Australia (Marshall et al. 2013). The potential of extreme PFI is also slightly increased in southwest Western Australia in DJF and JJA. In periods of low blocking, an almost exact opposite response is observed, including a decrease in the probability of extreme PFI in Queensland and the Great Sandy Desert region in SON and a slight increase in southwest Western Australia in JJA (Fig. 15). Pook et al. (2013) find a positive correlation between split-flow blocking and JJA rainfall in southwest Western Australia, which may explain this relationship.
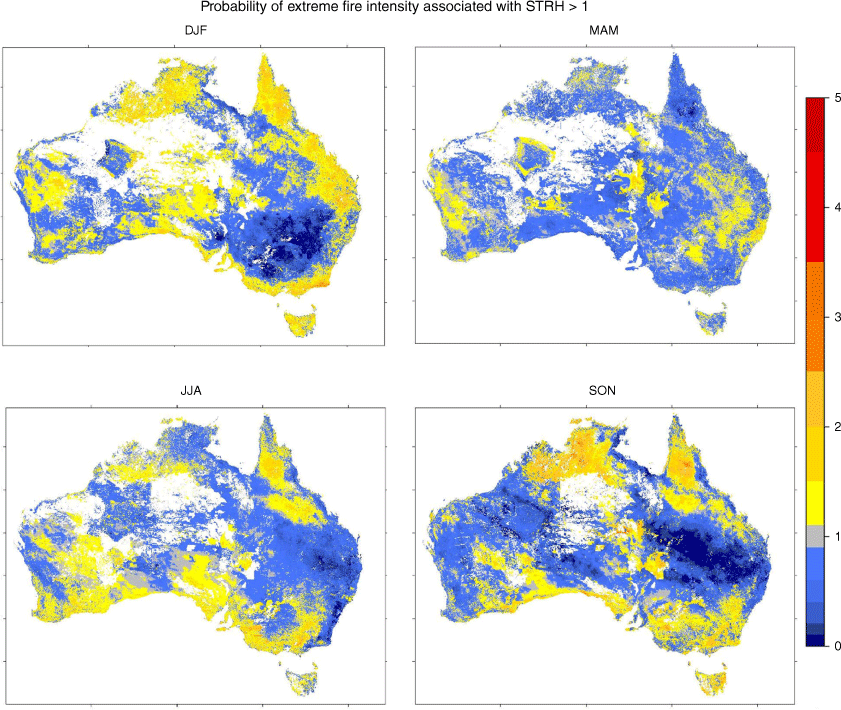
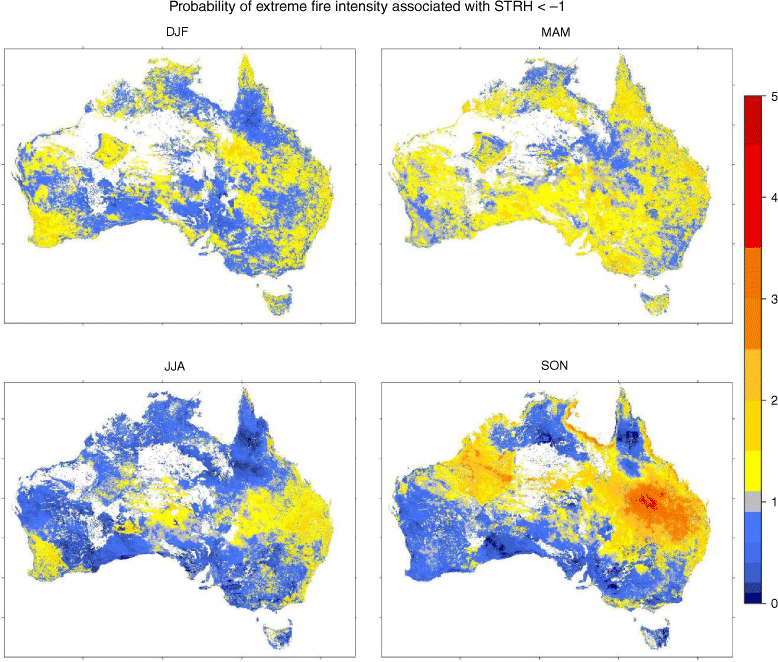
Episodes of anomalous high pressure in the Tasman Sea have their strongest relationships with chances of extreme PFI in DJF and SON, with weak relationships in MAM and JJA (Fig. 16). In DJF, strong blocking relates to increased chances of extreme PFI along the east and southeast coast, the Top End (Northern Territory), the Kimberly and Tasmania, with markedly reduced probabilities in central NSW. The signal is similar in SON, but with the reduced chances of extreme PFI occurring more in northern NSW and southern Qld, and more widespread increases in the probability of extreme PFI in southeast Australia. This signal is broadly reversed during periods of anomalous low pressure in the Tasman Sea (Fig. 17). Extreme PFI becomes up to four times more likely in Qld during SON, and increased probabilities of similar magnitude are present on the coast of the Gulf of Carpentaria.
We analysed the relationships between top-decile PFI and all phases of the MJO in all seasons. A selection of cases are presented here that demonstrate the strongest relationships to increased chances of extreme PFI.
DJF is the active fire season in southern Australia. The MJO phase 5 has the strongest relationships to increased chances of extreme PFI in DJF (Fig. 18). In phase 5, higher chances of above average rainfall are evident in Darwin and Arnhem Land. Average conditions prevail in most of central and southern Australia except in some areas of increased minimum and maximum temperature in western Australia. Average conditions in these central and southern regions are generally hot and dry in DJF; hence, the absence of hot or dry anomalies does not necessarily indicate mild fire conditions. The circulation anomalies in phase 5 show anomalous transport of hot, dry air from central Australia (or alternatively a lack of moisture-laden onshore flow) over the southern regions experiencing higher likelihood of extreme fire intensity. These northerly anomalies could also indicate an increase in the frequency of cyclonic fronts across the region, typical of severe fire weather days (e.g. Cruz et al. 2012; Reeder et al. 2015; Richardson et al. 2021). No significant anomalies in geopotential height are evident in this phase; however, in the preceding phase (4), strong positive anomalies exist over Tasmania, the Tasman Sea and the Southern Ocean, bringing high pressure and hot, dry conditions to southern Australia, likely enhancing curing and hence priming the environment for severe fire conditions. Given the period of MJO phases (approximately 4–21 days; Itterly et al. 2021), it is very likely that the preceding phase or phases would influence the chance of extreme PFI in the following phase.
Ratio of probabilities of upper-decile weekly PFI events for MJO phase 5 in DJF (top left), phase 6 in MAM (top right), phase 2 in JJA (bottom left) and phase 8 in SON (bottom right).
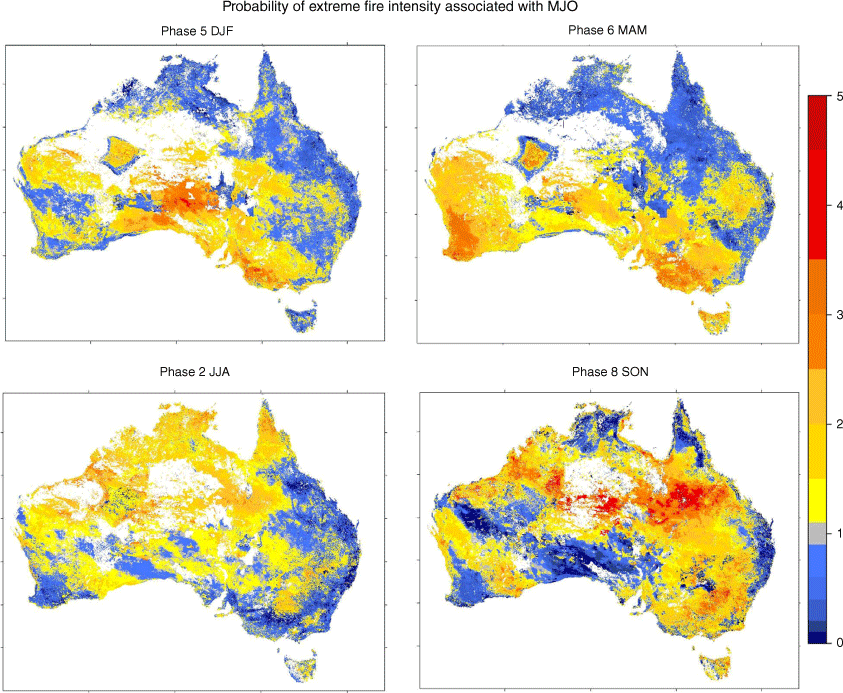
In MAM, MJO phase 6 is associated with the largest increase in chance of extreme PFI in extreme southern Australia and Tasmania where the fire season is active (Fig. 18). Phase 6 of the MJO is not associated with significant changes in rainfall, temperature or geopotential height over these regions in MAM save a slight easterly wind anomaly over Tasmania that may reduce orographic rainfall in the west of the state.
In JJA, despite many phases having higher overall chance of extreme PFI, these very high probabilities do not occur in the far north of Australia where the fire season is active. Phases 1, 2 and 3 show increased chance of extreme PFI in northern Australia, with associations in phase 2 being the most widespread (Fig. 18). Both maximum and minimum temperatures in northern Australia are increased in phase 2 in JJA, but rainfall is more likely to be above average in northeast Qld. Rainfall in southern Australia is significantly below average. This is associated with a higher prevalence of high pressure systems over southern Australia (Bureau of Meteorology 2022c), which produce northeasterly to southeasterly winds, increasing the risk of severe fire weather (Bureau of Meteorology 2022b).
SON is the fire danger season in northern and central Australia. Phase 8 of the MJO has a marked impact on the chance of extreme PFI in these areas in SON (Fig. 18). Much of northern and central Australia, as well as most of eastern Australia, experiences increased likelihood of extreme fire conditions associated with phase 8 in this season, with especially strong effects seen in central Queensland and the Top End/Tennant Creek areas. At this time, phase 8 is associated with below average rainfall in central Australia and lower minimum temperatures in northern Queensland, but no significant anomalies of maximum temperatures or geopotential (Bureau of Meteorology 2022c). Westerly wind anomalies suggest less moisture from onshore winds in Queensland, combined with possible warm, dry air advection for the centre. These patterns associated with the MJO may contribute to the relationships seen in Fig. 18.
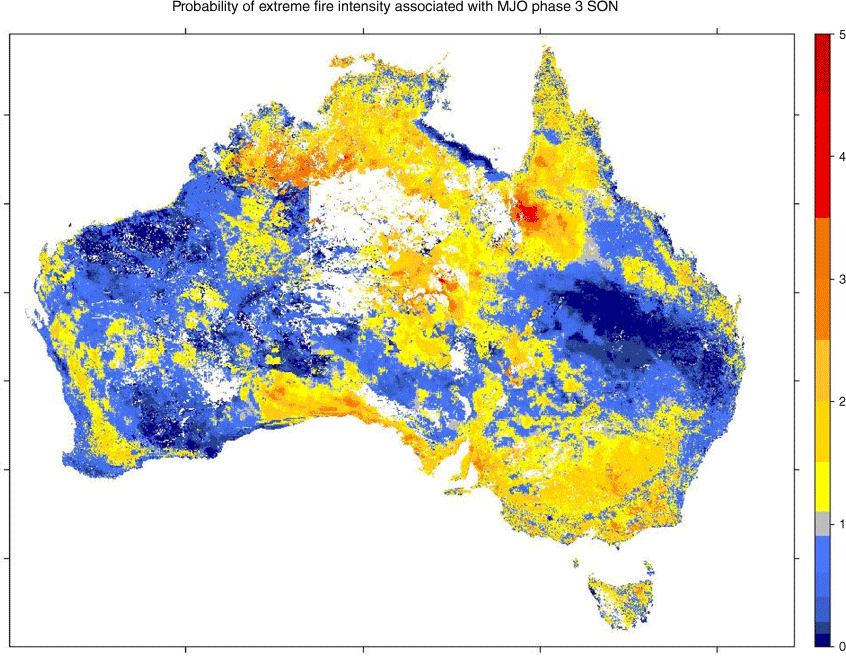
Recent research has found a strong relationship between temperature extremes in southeast Australia and phases 2 and 3 of the MJO in SON (Marshall et al. 2022). We find a modest response of the chance of extreme weekly PFI in southeast Australia to phase 3 in SON (Fig. 19). Multiple factors could contribute to this weaker than expected signal. Temperature is only one component determining PFI. Additionally, Marshall et al (2022) analyse data from 1990 to 2012 whereas we use data from 2003 to 2013. Given that the southeast Australian rainfall suppression associated with phases 2 and 3 of the MJO in SON has weakened over the past 15 years (Cowan et al. 2023), it could be expected that using only data from 2003 to 2013 as opposed to data starting in 1990, we would find a weaker overall relationship between this phase and PFI in SON.
Considerations and limitations
Our analyses are based on BARRA AFDRS climatology, which is fixed, using fuel models and available data as at February 2021. The operational hindcast and the outlook system (using the Bureau of Meteorology Australian Community Climate and Earth-System Simulator – Seasonal Version 2 (ACCESS-S2) forecasting system) were deployed operationally in March 2023 and can be periodically updated as the models are refined and new advances are made in our understanding of fire behaviour and the operational utility of the indices. This modular nature is a strength of the AFDRS compared with the relatively simple empirical equation behind the McArthur indices used previously. However, using AFDRS introduces a limitation in this study in that the results discussed here may not always reflect the current, operational AFDRS as the models are further refined and updated in future.
As previously noted in the Data and methods section, the period of available data spans 10 years from 2003 to 2012. This is substantially less than a classical climatology of 30 years and is an important consideration in regard to our findings. This temporal limitation provides fewer data points than ideal. Additionally, the climate state between 2003 and 2012 differed from the official climatology of 1981–2018. This aspect has been explored for the ACCESS-S2 subseasonal to seasonal forecasting model used by the Bureau of Meteorology, specifically regarding the AFDRS hindcast dataset. The resulting analysis found that the temperature of the hindcast period (2003–2017) was generally warmer than the 1981–2018 average, though the differences varied seasonally (Benger et al. 2022). Further, rainfall patterns also differed temporally and spatially from the climatological mean (Benger et al. 2023). Considering these differences, further analysis utilising a longer dataset would improve the robustness and reliability of the analysis.
Summary and conclusions
The potential for extreme potential fire intensity is influenced by concurrent and preceding climatic conditions. These conditions are modulated by the activity of a range of climate drivers, including the ENSO, IOD, SAM, MJO, split-flow blocking and persistent blocking in the Tasman Sea.
DJF is generally the season of maximum fire danger in central and southern Australia (e.g. Dowdy 2020). In these regions, the chance of extreme PFI is increased in concurrence with an El Niño event, negative SAM, negative BI and MJO phase 5. Subtropical Ridge Tasman Highs do not have a strong influence on the likelihood of upper decile PFI in this context, but in the months leading up to DJF, positive events increase the likelihood of occurrence in southeast Australia by a factor of up to 3. The IOD and El Niño are also influential in these preceding months, with El Niño and positive IOD events associated with increased chances of extreme PFI in south and southeast Australia up to 3 months in advance.
Historically, major fire season peaks in MAM have typically been restricted to far southern Australia including Tasmania. This may change under the effects of climate change (Clarke et al. 2013; Dowdy 2018; Jones et al. 2022). The chances of extreme PFI in far southern Australia in MAM increase in association with negative split-flow blocking, MJO phase 6, and to a lesser extent, negative anomalies of subtropical ridge Tasman high pressure systems and the SAM. ENSO does not have a marked effect in this season, likely because this is its development/decay period. However, El Niño events up to 6 months ahead of MAM are associated with increased chances of top decile PFI in southeast Australia. Both positive and negative BI leading up to MAM are associated to some extent with increased chances of extreme PFI in parts of far southern Australia despite positive split-flow blocking usually causing increased rainfall in southeastern Australia. The role of positive blocking ahead of MAM may be to increase fuel load, given that concurrent positive BI is strongly associated with below-average chances of extreme PFI.
JJA (as well as SON) is the predominant fire season peak in northern Australia (e.g. Dowdy 2020) where it typically brings dry weather after the monsoon. The climate drivers most associated with increased chances of extreme PFI in this region in JJA are negative BI and MJO phase 2. All phases of other drivers analysed show limited effect on northern Australia in JJA, although some slight or regional increases in probability are associated with positive STRH and El Niño. However, some climate drivers do have significant impacts on the chance of extreme PFI in other areas of Australia, which may be of importance either to preparatory activities or to lengthening fire seasons. In terms of pre-empting severe fire seasons, El Niño is associated with increased chances of extreme PFI up to 4 months ahead of JJA and La Niña 2–5 months. The effects of both these phases are complicated by the fact that these timeframes fall in the ENSO development/decay periods where they have impacts that are often different to the impacts of mature, ‘classical’ events. Slight increases in probability of top decile PFI in the Top End are also associated with preceding positive IOD and negative SAM events, and in Queensland in negative IOD events.
Spring peaks in the bushfire season typically extend from mainland southeastern and central Australia through to the far north. El Niño, positive IOD, both positive and negative BI, negative SAM, negative STRH and MJO phase 8 are all strongly associated with increased chances of extreme PFI in SON. The signals of positive BI and negative STRH are maximum over southern Qld and northern NSW. In the case of negative STRH, this may relate to decreased onshore flow and moisture transport, combined with transport of heat towards the subtropics (Marshall et al. 2021). In the case of positive BI, increased westerlies across central Australia may favour advection of warm, dry air over southern Queensland, increasing the chances of extreme PFI there. Conversely, negative BI results in increased probability of extreme PFI in southern and far northern Australia, consistent with the climatic anomalies in these areas. Negative SAM events act to increase probability ratios in western Tasmania. This in an unexpected result given the findings of Hendon et al. (2007) showing easterly wind anomalies in the high-minus-low composites of SAM polarities. It is possible, however, that the positive SAM serves to increase easterly winds, but the negative phase has slight or no effect on these winds. The exact mechanisms driving this conflicting result are a topic for future exploration. Up to 6 months ahead of SON, El Niño events act to increase SON chances of extreme PFI. Up to 3 months in advance, the signal emerges with positive IOD and negative BI. In these lead times from winter through to spring, the effect of the climate drivers would be expected to be consistent, to some extent, with their effect on rainfall and temperature. This is because increased rainfall over the dormant months would not be expected to increase fuel growth in most of Australia but instead reduce the availability of existing fuel. However, when growing conditions are improved over active seasons such and spring and summer, as is seen in cases of La Niña, positive SAM and positive BI, fuel loads are typically increased allowing for greater fuel availability in the active fire season.
In terms of pre-empting seasons with a higher likelihood of extreme conditions, the ENSO, IOD and BI have the greatest association with top-decile PFI at seasonal lead times. El Niño events in winter through summer are highly predictive of above-average occurrence of extreme fire conditions in southern Australia in the upcoming months. However, the threshold for top-decile PFI varies with season, so higher likelihood of extreme PFI in the off season does not necessarily reflect extreme risk. When the IOD is positive in winter, it is associated with higher chances of extreme PFI in much of southern and central Australia the following spring; however, a positive IOD in spring results in only minor increases in probability ratios for eastern Australia the following summer. A positive BI in summer–autumn is highly indicative of higher chances of severe fire conditions over most of Australia that autumn, and in winter–spring of higher probability in central and southern Australia that spring. The opposite associations generally occur with the opposite phases of these drivers, whereas STRH and SAM have limited preconditioning effects, and MJO is not expected to be predictive of upcoming fire seasons given its short period.
Our findings provide insights into the role of Australian subseasonal to seasonal modes of climate variability in modulating concurrent or future risk of extreme fire conditions. These climate drivers affect temperature, rainfall and circulation patterns with a secondary impact on fuel load. The results show that all drivers have a concurrent relationship with the probability of extreme potential fire intensity were a fire to ignite, while the ENSO, IOD and BI may also have predictive value. Given the predictability of these drivers by seasonal climate and weather models, the relationships found in this work may be of value for early preparation and planning by Australian fire management agencies. Fire season outlooks are currently issued quarterly, showing the chance of above or below normal fire danger potential across Australia. With the introduction of the AFDRS, these outlooks are also generated fortnightly by the Bureau and are available to registered users. The outlooks use the ACCESS-S2 subseasonal-to-seasonal climate simulation model to forecast weather conditions and input these in the AFDRS fuel models, outputting fire danger forecasts. Our analyses demonstrate that the polarity of climate drivers is a significant predictor of extreme fire danger conditions and forecasts of these modes have potential to be used either directly in the outlooks, or as a stand-alone statistical model to provide additional understanding of the driving factors affecting the conditions observed in the official outlook products. Further confidence in the relationships shown here could be attained by extending the analysed dataset beyond the 10 years currently available and this presents an opportunity for future investigation. Added value could also be derived from assessing the ability of a seasonal climate model to replicate the relationships found here. If a model showed skill in this area, this could provide an avenue for improved seasonal forecasting of extreme fire weather in Australia.
Data availability
The data that support this study were obtained from Samuel Sauvage by permission. Data may be shared on reasonable request to Samuel Sauvage via the National Computational Infrastructure.
References
AFAC (2021) Seasonal Bushfire Outlook Summer 2021. Available at https://www.afac.com.au/docs/default-source/bushfire-seasonal-outlook/seasonaloutlook_summer_2021_v1-0.pdf
AFAC (2022) Seasonal Bushfire Outlook Summer 2022. Available at https://www.afac.com.au/docs/default-source/bushfire-seasonal-outlook/seasonaloutlook_summer_2022_v1-0.pdf
Australian Bureau of Meteorology (2016) Indian Ocean influences on Australian climate. Available at http://www.bom.gov.au/climate/iod/
Benger N, Gregory P, Fox-Hughes P (2022) Progress towards a new national seasonal fire outlook. The Australian Journal of Emergency Management 37(4), 59-62 Available at https://knowledge.aidr.org.au/media/9665/ajem-18-2022-04.pdf.
| Google Scholar |
Benger N, Gregory P, Fox-Hughes P (2023) Interpretation of seasonal fire outlooks. Available at https://www.afacconference.com.au/conference-program-v1/interpretation-of-seasonal-fire-outlooks
Bird RB, Bird DW, Codding BF (2016) People, El Niño southern oscillation and fire in Australia: fire regimes and climate controls in hummock grasslands. Philosophical Transactions of the Royal Society B: Biological Sciences 371(1696), 20150343.
| Crossref | Google Scholar | PubMed |
Borchers Arriagada N, Palmer AJ, Bowman DM, Morgan GG, Jalaludin BB, Johnston FH (2020) Unprecedented smoke-related health burden associated with the 2019–20 bushfires in eastern Australia. Medical Journal of Australia 213, 282-283.
| Crossref | Google Scholar | PubMed |
Bureau of Meteorology (2021) What is el niño and what does it mean for Australia? Available at http://www.bom.gov.au/climate/updates/articles/a008-el-nino-and-australia.shtml [accessed 1 September 2022]
Bureau of Meteorology (2022a) 122 Years of Australian Rainfall. Available at http://www.bom.gov.au/climate/history/rainfall/ [accessed 31 August 2022]
Bureau of Meteorology (2022b) Bushfire Weather. Available at http://www.bom.gov.au/weather-services/fire-weather-centre/bushfire-weather/index.shtml [accessed 20 September]
Bureau of Meteorology (2022c) Madden–Julian Oscillation (MJO). Available at http://www.bom.gov.au/climate/mjo/#tabs=Averages [accessed 30 September]
Burrows ND, Ward B, Robinson AD (1995) Jarrah forest fire history from stem analysis and anthropological evidence. Australian Forestry 58(1), 7-16.
| Crossref | Google Scholar |
Canadell JG, Meyer CP, Cook GD, Dowdy A, Briggs PR, Knauer J, Pepler A, Haverd V (2021) Multi-decadal increase of forest burned area in Australia is linked to climate change. Nature Communications 12(1), 6921.
| Crossref | Google Scholar | PubMed |
Ceranic I (2020) La Nina set to bring more cyclones to WA’s north, but extra rain is unlikely to help the south-west. Australian Broadcasting Commission. Available at https://www.abc.net.au/news/2020-09-12/la-nina-set-to-bring-rain-but-south-west-wa-will-likely-miss-out/12651612 (Accessed 12 September)
Clarke H, Evans JP (2018) Exploring the future change space for fire weather in southeast Australia. Theoretical and Applied Climatology 136, 513-527.
| Crossref | Google Scholar |
Clarke H, Lucas C, Smith P (2013) Changes in Australian fire weather between 1973 and 2010. International Journal of Climatology 33(4), 931-944.
| Crossref | Google Scholar |
Cowan T, Wheeler MC, Marshall AG (2023) The combined influence of the Madden–Julian Oscillation and El Niño Southern Oscillation on Australian rainfall. Journal of Climate 36, 313-334.
| Crossref | Google Scholar |
Cruz MG, Sullivan AL, Gould JS, Sims NC, Bannister AJ, Hollis JJ, Hurley RJ (2012) Anatomy of a catastrophic wildfire: the Black Saturday Kilmore East fire in Victoria, Australia. Forest Ecology and Management 284, 269-285.
| Crossref | Google Scholar |
CSIRO and Bureau of Meteorology (2020) State of the Climate 2020, Australia. Available at http://www.bom.gov.au/state-of-the-climate/index.shtml
Dickman C, McDonald T (2020) Some personal reflections on the present and future of Australia’s fauna in an increasingly fire-prone continent. Ecological Management & Restoration 21(2), 86-96.
| Crossref | Google Scholar |
Dowdy AJ (2018) Climatological variability of fire weather in Australia. Journal of Applied Meteorology and Climatology 57(2), 221-234.
| Crossref | Google Scholar |
Dowdy AJ (2020) Seamless climate change projections and seasonal predictions for bushfires in Australia. Journal of Southern Hemisphere Earth Systems Science 70(1), 120-138.
| Crossref | Google Scholar |
Freund M, Henley BJ, Karoly DJ, Allen KJ, Baker PJ (2017) Multi-century cool- and warm-season rainfall reconstructions for Australia's major climatic regions. Climate of the Past 13(12), 1751-1770.
| Crossref | Google Scholar |
Freund MB, Marshall AG, Wheeler MC, Brown JN (2021) Central Pacific El Niño as a precursor to summer drought-breaking rainfall over southeastern Australia. Geophysical Research Letters 48(7), e2020GL091131.
| Crossref | Google Scholar |
Gill AM, Stephens SL, Cary GJ (2013) The worldwide ‘wildfire’ problem. Ecological Applications 23(2), 438-454.
| Crossref | Google Scholar | PubMed |
Gong D, Wang S (1999) Definition of Antarctic oscillation index. Geophysical Research Letters 26(4), 459-462.
| Crossref | Google Scholar |
Harris S, Lucas C (2019) Understanding the variability of Australian fire weather between 1973 and 2017. PLoS One 14(9), e0222328.
| Crossref | Google Scholar | PubMed |
Hendon HH, Thompson DWJ, Wheeler MC (2007) Australian rainfall and surface temperature variations associated with the southern hemisphere annular mode. Journal of Climate 20(11), 2452-2467.
| Crossref | Google Scholar |
Itterly K, Taylor P, Roberts JB (2021) Satellite perspectives of sea surface temperature diurnal warming on atmospheric moistening and radiative heating during MJO. Journal of Climate 34, 1203-1226.
| Crossref | Google Scholar |
Jolly WM, Cochrane MA, Freeborn PH, Holden ZA, Brown TJ, Williamson GJ, Bowman DMJS (2015) Climate-induced variations in global wildfire danger from 1979 to 2013. Nature Communications 6, 7537.
| Crossref | Google Scholar | PubMed |
Jones DA, Wang W, Fawcett R (2009) High-quality spatial climate data-sets for Australia. Australian Meteorological and Oceanographic Journal 58(4), 233-248.
| Crossref | Google Scholar |
Jones MW, Abatzoglou JT, Veraverbeke S, Andela N, Lasslop G, Forkel M, Smith AJP, Burton C, Betts RA, van der Werf GR, Sitch S, Canadell JG, Santín C, Kolden C, Doerr SH, Le Quéré C (2022) Global and regional trends and drivers of fire under climate change. Reviews of Geophysics 60(3), e2020RG000726.
| Crossref | Google Scholar |
Kalnay E, Kanamitsu M, Kistler R, Collins W, Deaven D, Gandin L, Iredell M, Saha S, White G, Woollen J, Zhu Y, Leetmaa A, Reynolds R, Chelliah M, Ebisuzaki W, Higgins W, Janowiak J, Mo KC, Ropelewski C, Wang J, Jenne R, Joseph D (1996) The NCEP/NCAR 40-year reanalysis project. Bulletin of the American Meteorological Society 77(3), 437-471.
| Crossref | Google Scholar |
Kenny B, Matthews S, Grootemaat S, Hollis J, Sauvage S, Fox-Hughes P (2019) Australian Fire Danger Rating System Research Prototype: National fuel map. In ‘6th International Fire Behavior and Fuels Conference’, Sydney, Australia. (International Association of Wildland Fire) Available at https://www.researchgate.net/publication/332901037_Proceedings_for_the_6th_International_Fire_Behavior_and_Fuels_Conference_Australian_Fire_Danger_Rating_System_Research_Prototype_National_fuel_map
Kim K-Y, Kullgren K, Lim G-H, Boo K-O, Kim B-M (2006) Physical mechanisms of the Australian summer monsoon: 2. Variability of strength and onset and termination times. Journal of Geophysical Research: Atmospheres 111(D20), D20105.
| Crossref | Google Scholar |
Lawrence J, Mackey B, Chiew F (2022) Australasia. In ‘Climate Change 2022: Impacts, Adaptation and Vulnerability. Contribution of Working Group II to the Sixth Assessment Report of the Intergovernmental Panel on Climate Change’. (Eds HO Pörtner, DCR Tignor, MES Poloczanska, K Mintenbeck, A Alegría, M Craig, S Langsdorf, S Löschke, V Möller, A Okem, B Rama) pp. 1581–1688. (Cambridge University Press: Cambridge, UK and New York, USA)
Lisonbee J, Ribbe J (2021) Seasonal climate influences on the timing of the Australian monsoon onset. Weather and Climate Dynamics 2(2), 489-506.
| Crossref | Google Scholar |
Ma Y, Sun J, Dong T, Yu W, Dong W (2022) More profound impact of CP ENSO on Australian spring rainfall in recent decades. Climate Dynamics 60, 3065-3079.
| Crossref | Google Scholar |
Marshall AG, Hudson D, Hendon HH, Pook MJ, Alves O, Wheeler MC (2013) Simulation and prediction of blocking in the Australian region and its influence on intra-seasonal rainfall in POAMA-2. Climate Dynamics 42, 3271-3288.
| Crossref | Google Scholar |
Marshall AG, Hudson D, Wheeler MC, Alves O, Hendon HH, Pook MJ, Risbey JS (2014) Intra-seasonal drivers of extreme heat over Australia in observations and POAMA-2. Climate Dynamics 43(7), 1915-1937.
| Crossref | Google Scholar |
Marshall AG, Gregory PA, de Burgh-Day CO, Griffiths M (2021) Subseasonal drivers of extreme fire weather in Australia and its prediction in ACCESS-S1 during spring and summer. Climate Dynamics 58, 523-553.
| Crossref | Google Scholar |
Marshall AG, Wang G, Hendon HH, Lin H (2022) Madden–Julian Oscillation teleconnections to Australian springtime temperature extremes and their prediction in ACCESS-S1. Climate Dynamics 61, 431-447.
| Crossref | Google Scholar |
McCoy L, Field, D (2022) Lessons from NSW RFS trial of the Australian fire danger rating system. The Australian Journal of Emergency Management 37(4), 55-58 https://search.informit.org/doi/10.3316/informit.738269919163057.
| Google Scholar |
Molyneaux R, Gibbs L, Bryant RA, Humphreys C, Hegarty K, Kellett C, Gallagher HC, Block K, Harms L, Richardson JF, Alkemade N, Forbes D (2020) Interpersonal violence and mental health outcomes following disaster. BJPsych Open 6(1), E1.
| Crossref | Google Scholar |
Mulkern A (20 May 2019) Firefighter suicides rise in the wake of deadly wildland blazes. Scientific American. Available at https://www.scientificamerican.com/article/firefighter-suicides-rise-in-the-wake-of-deadly-wildland-blazes/
Murphy BP, Bradstock RA, Boer MM, Carter J, Cary GJ, Cochrane MA, Fensham RJ, Russell‐Smith J, Williamson GJ, Bowman DMJS (2013) Fire regimes of Australia: a pyrogeographic model system. Journal of Biogeography 40(6), 1048-1058.
| Crossref | Google Scholar |
Nicholls N (2004) The changing nature of Australian droughts. Climatic Change 63(3), 323-336.
| Crossref | Google Scholar |
NOAA (2023) Assessing the Global Climate in March 2023. https://www.ncei.noaa.gov/news/global-climate-202303
Parkinson D, Zara C (2013) The hidden disaster: domestic violence in the aftermath of natural disaster. The Australian Journal of Emergency Management 28(2), 28-35.
| Crossref | Google Scholar |
Philip SY, Kew SF, van Oldenborgh GJ, Anslow FS, Seneviratne SI, Vautard R, Coumou D, Ebi KL, Arrighi J, Singh R, van Aalst M, Pereira Marghidan C, Wehner M, Yang W, Li S, Schumacher DL, Hauser M, Bonnet R, Luu LN, Lehner F, Gillett N, Tradowsky J, Vecchi GA, Rodell C, Stull RB, Howard R, Otto FEL (2021) Rapid attribution analysis of the extraordinary heatwave on the Pacific Coast of the US and Canada June 2021. Earth System Dynamics Discussions 2021, 1-34.
| Crossref | Google Scholar |
Pook MJ, Gibson T (1999) Atmospheric blocking and storm tracks during SOP-1 of the FROST Project. Australian Meteorological Magazine 48, 51-60.
| Google Scholar |
Pook MJ, Risbey JS, McIntosh PC, Ummenhofer CC, Marshall AG, Meyers GA (2013) The seasonal cycle of blocking and associated physical mechanisms in the Australian region and relationship with rainfall. Monthly Weather Review 141(12), 4534-4553.
| Crossref | Google Scholar |
Quiggin J (10 January 2020) Australia is promising $2 billion for the fires. I estimate recovery will cost $100 billion. CNN. Available at https://edition.cnn.com/2020/01/10/perspectives/australia-fires-cost/index.html
Read P, Denniss R (2020) With costs approaching $100 billion, the fires are Australia’s costliest natural disaster. The Conversation. Available at https://theconversation.com/with-costs-approaching-100-billion-the-fires-are-australias-costliest-natural-disaster-129433
Reeder MJ, Spengler T, Musgrave R (2015) Rossby waves, extreme fronts, and wildfires in southeastern Australia. Geophysical Research Letters 42(6), 2015-2023.
| Crossref | Google Scholar |
Richardson D, Black AS, Monselesan DP, Risbey JS, Squire DT, Tozer CR, Canadell JG (2021) Increased extreme fire weather occurrence in southeast Australia and related atmospheric drivers. Weather and Climate Extremes 34, 100397.
| Crossref | Google Scholar |
Riley KL, Abatzoglou JT, Grenfell IC, Klene AE, Heinsch FA (2013) The relationship of large fire occurrence with drought and fire danger indices in the western USA, 1984–2008: the role of temporal scale. International Journal of Wildland Fire 22(7), 894-909.
| Crossref | Google Scholar |
Risbey JS, Pook MJ, McIntosh PC, Wheeler MC, Hendon HH (2009) On the remote drivers of rainfall variability in Australia. Monthly Weather Review 137(10), 3233-3253.
| Crossref | Google Scholar |
Saji NH, Yamagata T (2003) Possible impacts of Indian Ocean Dipole mode events on global climate. Climate Research 25, 151-169.
| Crossref | Google Scholar |
Sauvage S, Fox‐Hughes P, Matthews S, Kenny B, Hollis J, Grootemaat S, Jakob D, Su C-H, Eizenberg N, Steinle P (2019) A preliminary climatology of the Australian Fire Danger Rating Prototype. In ‘Proceedings for the 6th International Fire Behavior and Fuels Conference’. (International Association of Wildland Fire: Missoula, Montana, USA)
Schiermeier Q (2018) Droughts, heatwaves and floods: How to tell when climate change is to blame. Nature 560(7717), 20-22.
| Crossref | Google Scholar | PubMed |
Sharples JJ, Cary GJ, Fox-Hughes P, Mooney S, Evans JP, Fletcher M-S, Fromm M, Grierson PF, McRae R, Baker P (2016) Natural hazards in Australia: extreme bushfire. Climatic Change 139(1), 85-99.
| Crossref | Google Scholar |
Su CH, Eizenberg N, Steinle P, Jakob D, Fox-Hughes P, White CJ, Rennie S, Franklin C, Dharssi I, Zhu H (2019) BARRA v1.0: the Bureau of Meteorology Atmospheric high-resolution Regional Reanalysis for Australia. Geoscientific Model Development 12(5), 2049-2068.
| Crossref | Google Scholar |
Sullivan AL, McCaw WL, Cruz MG, Matthews S, Ellis PF (2012) Fuel, fire weather and fire behaviour in Australian ecosystems. In ‘Flammable Australia: fire regimes, biodiversity and ecosystems in a changing world’. (Eds RA Bradstock, M Gill, RJ Williams) pp. 51–77. (CSIRO Publishing: Melbourne, Vic, Australia)
Trenberth Kevin (1997) The Definition of El Niño. Bulletin of the American Meteorological Society 78(12), 2771-2778.
| Crossref | Google Scholar |
United Nations Environment Programme (2020) Ten impacts of the Australian bushfires. Available at https://www.unep.org/news-and-stories/story/ten-impacts-australian-bushfires
United Nations Environment Programme (2022) Spreading like Wildfire – The Rising Threat of Extraordinary Landscape Fires. A UNEP Rapid Response Assessment, Nairobi, Kenya. Available at https://www.unep.org/resources/report/spreading-wildfire-rising-threat-extraordinary-landscape-fires
van Oldenborgh GJ, Krikken F, Lewis S, Leach NJ, Lehner F, Saunders KR, Van Weele M, Haustein K, Li S, Wallom D (2020) Attribution of the Australian bushfire risk to anthropogenic climate change. Natural Hazards and Earth System Sciences 21, 941-960.
| Crossref | Google Scholar |
Vieira I, Dupe C, de Ruyter T (2022) Bushfires in WA: Monster blaze still wreaking havoc across Wheatbelt. Available at https://thewest.com.au/news/bushfires/bushfires-in-wa-monster-blaze-still-wreaking-havoc-across-wheatbelt-c-5598237
Wang B, Wu R, Li T (2003) Atmosphere–Warm Ocean Interaction and Its Impacts on Asian–Australian Monsoon Variation. Journal of Climate 16(8), 1195-1211.
| Crossref | Google Scholar |
Wang B, Yang J, Zhou T, Wang B (2008) Interdecadal changes in the major modes of Asian–Australian monsoon variability: strengthening relationship with ENSO since the late 1970s. Journal of Climate 21(8), 1771-1789.
| Crossref | Google Scholar |
Wang G, Cai W (2020) Two-year consecutive concurrences of positive Indian Ocean Dipole and Central Pacific El Niño preconditioned the 2019/2020 Australian ‘Black Summer’ bushfires. Geoscience Letters 7(1), 19.
| Crossref | Google Scholar |
Wang G, Hendon HH (2007) Sensitivity of Australian rainfall to Inter–El Niño variations. Journal of Climate 20(16), 4211-4226.
| Crossref | Google Scholar |
Wheeler Matthew, Hendon Harry (2004) An All-Season Real-Time Multivariate MJO Index: Development of an Index for Monitoring and Prediction. Monthly Weather Review 132(8), 1917-1932.
| Crossref | Google Scholar |
Williams RJ, Bradstock RA, Cary GJ, Enright NJ, Gill AM, Leidloff A, Lucas C, Whelan RJ, Andersen AN, Bowman DJ (2009) ‘Interactions between climate change, fire regimes and biodiversity in Australia: a preliminary assessment.’ Report to the Department of Climate Change and the Department of the Environment, Water, Heritage and the Arts, Canberra, Australia.
9 News Staff (6 February 2021) WA homes destroyed by Wooroloo bushfire rises to 86 as second ‘suspicious’ blaze controlled. 9 News. Available at https://www.9news.com.au/national/western-australia-perth-north-east-bushfires-emergency-fifth-day-emergency/458b8192-a9c3-4701-a05a-71fa2fc0a9ce


