

Catchment modelling of sediment, nitrogen and phosphorus nutrient loads with SedNet/ANNEX in the Tully–Murray basin
J. D. Armour A B , L. R. Hateley A and G. L. Pitt AA Queensland Department of Natural Resources and Water, Mareeba, Qld 4880, Australia.
B Corresponding author. Email: john.armour@qld.gov.au
Marine and Freshwater Research 60(11) 1091-1096 https://doi.org/10.1071/MF08345
Submitted: 15 December 2008 Accepted: 1 September 2009 Published: 17 November 2009
Abstract
A long-term, annual-average catchment biophysical model (SedNet/ANNEX) was used to calculate sediment, nitrogen (N) and phosphorus (P) loads in the Tully–Murray catchment of north-eastern Australia. A total of 119 000 t year–1 of suspended sediment, equivalent to 430 kg ha–1 year–1, was calculated to be exported to the Great Barrier Reef (GBR). Most of the sediment (64%) was generated from hill-slope erosion. The modelled load of dissolved inorganic N (1159 t year–1 or 4.2 kg N ha–1 year–1) was similar to that from other wet tropics catchments in Queensland with similar areas of sugarcane. Sugarcane produced 77% of this load. The annual loads of total N and total P were 2319 t and 244 t, respectively. Simulations (scenarios) were run to evaluate the impact of improved land management on pollutant loads to the GBR. A combination of improved cultivation and fertiliser management of sugarcane and bananas (99% of cropping land) and restoration of the most degraded riparian areas reduced sediment by 23 000 t year–1 (18%) and dissolved inorganic N by 286 t year–1 (25%). However, this reduction is much less than the reduction of 80% that may be needed in the catchment to meet target chlorophyll loads in the marine environment.
Introduction
The Tully–Murray has been identified as a high risk catchment for the Great Barrier Reef (GBR) because of declining water quality in an environment with a high annual average rainfall of 1591 (Upper Murray) to 4095 mm (Tully) (Anonymous 2003; Kroon 2009). The area is 2780 km2, comprising the Tully (1680 km2) and Murray (1100 km2) catchments. The hydrological computer model Sediment River Network/Annual Nutrient Export (SedNet/ANNEX) (Wilkinson et al. 2004) was used to describe the current condition and to simulate a range of scenarios generating sediment, and nitrogen (N) and phosphorus (P) budgets in the Tully–Murray catchment (Armour et al. 2007b).
Models such as SedNet/ANNEX are a simplified representation of the complex, interrelated processes that occur in landscapes and streams. However, they provide a framework for combining, analysing and extrapolating the best available biophysical data. They are also useful in assessing the reduction of loads to receiving waters from changes in land management (e.g. improvements to nutrient management and revegetation of riparian areas). Importantly, because SedNet/ANNEX is a long-term, annual-average model, caution is needed when comparing the results with monitored loads.
The work reported here is a regionally focussed refinement of earlier modelling for the entire GBR (Hateley et al. 2006). More detailed data, particularly soil and water quality data, became available and were incorporated into the existing model. The movement of sediment, N and P in and from the Tully–Murray catchment was simulated, and sediment and nutrient ‘hotspots’ from different land-use classes and subcatchments were identified within the catchment. Scenarios were constructed for these priority land-use classes by spatial techniques that examined the effects of changed land management on sediment and nutrient loads.
Materials and methods
Description of SedNet/ANNEX
The sediment budget is derived from three sources: soil erosion on land (hill-slope erosion), the density of gullies in the landscape (gully erosion) and riverbank (bank) erosion. A detailed description of the modelling algorithms and concepts is available (Wilkinson et al. 2004). The ANNEX component of the model calculated particulate and dissolved nutrient loads separately (Young et al. 2001; Wilkinson et al. 2004). Particulate nutrient loads (particulate P (PP) and particulate N (PN)) originate from hill-slope, gully and bank erosion. Dissolved nutrient loads are delivered from all diffuse sources, including fertilised agricultural land and point sources such as sewage treatment plants. The nutrient species simulated are dissolved inorganic N (DIN), dissolved organic N (DON), filtered reactive P (FRP) and dissolved organic P (DOP). Particulate and dissolved nutrients are reported individually and are combined as total N (TN) and total P (TP).
Changes to base condition datasets and parameters
Improvements based on better data were made to hydrology, erosion and diffuse pollutant datasets in comparison to Hateley et al. (2006).
Hydrology
The flow regionalisation parameters were improved by using local data derived from four unregulated gauges. Three regulated gauges were then used to modify the unregulated flow to incorporate patterns in flow regulation. Earlier work was regionalised at a larger scale using unregulated flow data from seven north Queensland catchments, Daintree to Herbert (Hateley et al. 2006).
DEM and land use
A 25-m Digital Elevation Model (DEM) improved the delineation of catchment boundaries and the calculation of slope for bank and hill-slope erosion, compared with the earlier 100-m DEM. Land-use data was derived from 2004 data (QLUMP 2004) as well as recent expansion of plantation forestry, rather than 1999 data. Rainforest that is largely undisturbed dominates the Tully–Murray basin (71% of the basin, Table 6; fig. 1 in Kroon 2009). Sugarcane is the main agricultural land use on the floodplain (36 700 ha, 13%), followed by beef production from permanent pasture (5%) and 7900 ha of bananas (Table 6).
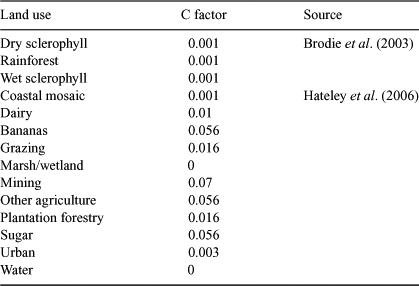
Cover and the soil erodibility factors of the Revised Universal Soil Loss Equation (RUSLE) were recalculated from improved regional datasets and are outlined below. The C factor (crop and cover management) of RUSLE were assigned to grouped land-use categories with the same values as Hateley et al. (2006), apart from rainforest and wet and dry sclerophyll (Table 1). A lower C factor (0.001, rather than 0.01) was used for these areas, on the basis of our observation of sediment generation from such undisturbed areas of a wet catchment and the comparison of the modelled loads with current WQ monitoring data (Bainbridge et al. 2009).
|
The K factor (soil erodibility) was recalculated by the method of Lu et al. (2003) for 68 soil types using the analytical data from published soil surveys (Wilson and Baker 1990; Cannon et al. 1992; Malcolm et al. 1999). The recalculation reduced the K factors to ~51% of the Hateley et al. (2006) values. N, P and clay concentrations were also obtained from the analytical data from published soil surveys. Lower surface N values than those of Hateley et al. (2006) were used to accommodate the decline in organic matter, and hence total N, due to clearing and cultivation for land-use classes of sugarcane, pasture and banana.
The sewerage treatment plant from the town of Tully was the only point source of pollutants incorporated in the model. The concentrations in the effluent were filterable reactive phosphorus (FRP) 0.32 mg L–1, DOP 0.01 mg L–1, DIN 1.12 mg L–1 and DON 0.4 mg L–1. Loads (kg year–1) were FRP 186, DOP 6, DIN 652 and DON 233 (B. Roberts, unpubl. data).
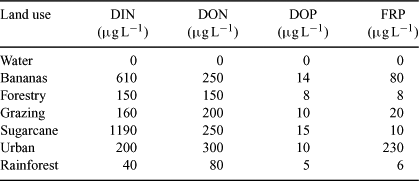
Dissolved nutrient concentrations were assigned to land-use classes in the ANNEX land-use layer (Table 2). DIN and FRP concentrations for sugarcane were based on modelled data (Roebeling et al. 2009). They were adjusted for the proportion of the four broad soil categories used in the work that occur in the catchment (proportions were: Soil 1, 0.25; Soil 2, 0.29; Soil 4, 0.46). The previous values of DIN were 2000 μg L–1 for sugarcane and 1100 μg L–1 for bananas (Hateley et al. 2006).
|
Scenarios
Current condition describes the current management practices for all major industries. They include a N application rate of 170 kg ha–1 year–1, green cane harvesting and retention of the trash blanket on the soil surface for sugarcane and 335 kg N ha–1 year–1 with grassed inter-rows for bananas production.
Scenarios examined the effect of changes in land management on sediment and nutrient generation and transport (Table 3). They were developed from expert opinion of a panel of scientists and local industry representatives and concentrated on the sugarcane and banana industries and riparian vegetation. This is a reflection of the area of intensive agricultural land use and community concern described by Bohnet and Kinjun (2009). A series of changes to the model input datasets were made to calculate the impacts on water quality.

|
Sugarcane scenario S1 represented the production system from the 1970s when the crop was burnt before harvest, in contrast to the current practice of retaining the crop trash on the soil surface. Scenario S2 modelled the use of zero tillage to establish the plant crop and B1 simulated zonal tillage for planting bananas. Scenarios S3 to S5 represented an increasingly experimental rate of N application. S3, based on the Six Easy Steps program of Bureau of Sugar Experiment Stations (BSES), is considered to be a logical and incremental improvement to sugarcane nutrient management from current practice (Schroeder et al. 2007). S4 is based on the replacement of N removed in the preceding crop (Thorburn 2004), whereas S5 relies on fixation of N by soil biota for particular sugarcane cultivars and a small application of N (30 kg ha–1; J. Reghenzani, pers. comm.). Scenarios S4 and especially S5 need considerable local research to determine whether this technique is viable under local conditions. The DIN and FRP concentrations for banana production (scenario B2) were reduced by 30% on the basis of an extrapolation of current research in the Tully catchment and earlier work in the Johnstone catchment of the wet tropics (Armour and Daniels 2001; Armour et al. 2007a).
Scenario R1 simulated the restoration of the most degraded 20% (lowest amount of riparian cover) of stream sections of mainly 3rd- and 4th-order streams around the central floodplain, with a total length of 124 km. The Best Management Practice (BMP) scenario comprised a modified N and P fertiliser program and reduced tillage for sugarcane and bananas as well as riparian restoration
Results
Hydrology
The modelled mean annual flow was 2 700 000 ML year–1 at Euramo, the most downstream gauging site representing 97% of the Tully catchment, which is only 8% less than a mean of 2 925 000 ML year–1 from the most recent 32 years of gauged flow data.
Current condition for sediment and nutrients
The predicted total sediment supply (suspended sediment and stream bed load generated and delivered to streams) to the Tully–Murray catchment was 183 000 t year–1 (Table 4) and includes bed load of 33 000 t year–1. Hill-slope erosion was the dominant process with 116 000 t year–1 or 64% of the total sediment supply. Contributions from bank and gully erosion were 57 000 t year–1 (31%) and 10 000 t year–1 (5%), respectively. Of the 150 000 t of suspended sediment generated within the catchment, 119 000 t year–1 (79%, equivalent to 430 kg ha–1 year–1) was exported to the GBR. Deposition of suspended sediment was mainly on the floodplain (21% of that generated), with only a small amount in the Koombooloomba Dam in the upper catchment (<1%). Bed-load contribution to the GBR was 9000 t year–1 after 24 000 t year –1 was deposited in the channel network. The contribution of forest was 57% of the total load from 71% of the area.

|
The modelled mean suspended sediment concentration on an annual basis for the catchment was 44 mg L–1.
The total N load exported to the coast was 2319 t year–1 (8.3 kg ha–1 year–1). DIN comprised 47% of the TN load or 4.2 kg ha–1 year–1 (Table 4). The proportions of PN and DON were similar. The TP load exported to the coast was 244 t year–1 (0.9 kg ha–1 year–1) and dominated by PP (65%). FRP was 22% of the load.
On an area basis, sugarcane contributed 77% of the catchment load of DIN (888 t year–1, 24 kg ha–1 year–1). Sugarcane occupied just 13% of the area in the Tully–Murray catchment and had an areal delivery ratio (ADR) of 5.8. ADR was calculated by dividing the percentage of DIN contributed by sugarcane by the percentage area of sugarcane in the catchment. Bananas contributed 8% of the total DIN exported to the coast (12 kg ha–1 year–1), with an ADR of 2.9. The ADR values for DIN in the other land-use classes were all <1. Forest areas contributed little to the DIN load (0.5 kg ha–1 year–1) to the coast, as would be expected because of the absence of fertiliser application in these areas. On a subcatchment basis, the highest contribution of DIN was from around Tully, Euramo and Jumbun, where sugarcane is the main land use (fig. 1 in Kroon 2009).
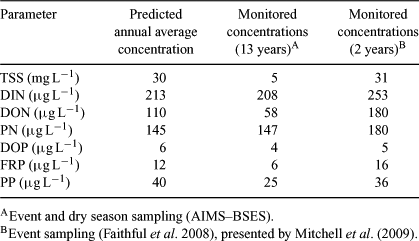
Comparison of water quality data from monitoring and modelling
The model results were compared with monitoring data at four sites where the subcatchments generated by the model aligned with the monitoring sites from long-term monitoring during dry and wet seasons and 2 years of wet-season sampling (referred to as AIMS–BSES and Faithful et al. (2008) in Mitchell et al. 2009). The sites were Tully River (Euramo, end of system), Banyan Creek (Dean Rd), Jarra Creek and Jumbun.
The long-term average concentrations of total suspended solids (TSS) and forms of N and P were calculated from annual loads and annual discharge (Table 5). There was a very good agreement between the predicted and measured concentrations for all parameters at Euramo, and generally a good agreement at Banyan Creek (Dean Rd) and Jarra Creek (data not shown). At Jarra Creek (Dean Rd), the predicted TSS concentration was 40 mg L–1, compared with 9–17 mg L–1 for the monitored data, and these differences were reflected in the PN and PP concentrations. The predicted sediment concentration from largely undisturbed forest at Jumbun was much higher (53 mg L–1) than that measured by Bainbridge et al. (2009) (5 mg L–1), although both concentrations were low.
|

|
Scenarios
The adoption of green-cane harvesting (scenario S1) has reduced the export of sediment from 173 000 t year–1 to 29 000 t year–1 under the current condition (Table 6), a reduction to 1/6 of 1970s’ rates. There were similar reductions in PP (from 270 to 40 t year–1) and PN (from 1000 to 150 t year–1). This comparison assumes that the area of sugarcane production and other crops is the same as the current condition. The adoption of zero tillage for sugarcane (S2) was estimated to further reduce suspended sediment by 44%, from 29 000 t year–1 to 16 000 t year–1, with proportional reductions in PN and PP. An equivalent scenario for bananas with reduced cultivation from zonal tillage (B1) was predicted to reduce suspended sediment from the industry by 65% from 5700 t year–1 to 2000 t year–1.
Scenarios S3, S4 and S5, which evaluated reductions in N fertiliser application to sugarcane, all decreased DIN contributions to the coast compared with the current condition. Scenario S3 decreased DIN from sugarcane by 29%, S4 by 59% and S5 by 86%. Corresponding DIN export rates were 17, 10 and 3 kg N ha–1 year–1. These represent decreasing N fertiliser applications for increasingly experimental management that must be validated under local conditions. Scenario B2 for bananas simulated a reduction in N application of 30%, with a corresponding reduction in the DIN contribution from 91 to 66 t year–1 (or 27%).
Restoration of the most degraded 20% of stream sections to 100% riparian vegetation cover reduced bank erosion by 14 000 t or 24% from the current condition.
The BMP scenario, which included a modified N and P fertiliser program and reduced tillage for sugarcane and bananas and riparian restoration, reduced DIN exported from the whole catchment to the coast by 286 t year–1 (25%) and exported sediment by 23 000 t year–1 (18%). There was a similar reduction in particulate forms of N and P.
Discussion
Modelled flows and calculated annual average concentrations of sediment, N and P were generally very similar to the monitored values. This indicates that the model provided a good representation of the catchment hydrology and water quality.
The generation and delivery of sediment in the catchment was low and mostly generated by hill-slope erosion. The suspended sediment exported to the GBR was 430 kg ha–1 year–1, which was the lowest calculated by SedNet/ANNEX for wet tropical streams in Queensland (Daintree 910, Mossman 1280, Barron 450, Russell-Mulgrave 1250, Johnstone 1070 and Herbert 550 kg ha–1 year–1; Hateley et al. 2006). Thus, improved sediment management is a lower priority in the catchment, a conclusion supported by local water quality monitoring programs (Bainbridge et al. 2009; Mitchell et al. 2009).
The improved datasets used in the present work (localised flow regionalisation, more detailed DEM and reduction in the RUSLE parameters of cover and soil erodibility) have resulted in a lower TSS contribution (119 000 t year–1) than that reported by Hateley et al. (2006) (186 000 t year–1). The TSS contribution to the GBR was 780 kg ha–1 year–1 for the sugarcane and banana industries, compared with 430 kg ha–1 year–1 for the entire catchment. In the sugar industry, much of the improvement over time in sediment contribution can be attributed to the adoption of green-cane harvesting, with sediment contributions six times higher before its adoption. Further reductions in suspended sediment and the associated loads of PN and PP are possible with the cultivation practices of zero tillage for sugarcane and zonal tillage for banana production (scenarios S2, B1 and BMP). Adoption of these improved cultivation techniques has started.
The modelled load of DIN (4.2 kg N ha–1 year–1) was similar to those in other wet tropical catchments in Queensland from the Daintree to Herbert (average of 4.4 kg N ha–1 year–1; Hateley et al. 2006). However, it is much higher than the modelled loads from other Queensland rivers such as the dry tropical Burdekin (0.2 kg N ha–1 year–1) and Fitzroy (0.04 kg N ha–1 year–1), and 47% higher than that from the Pioneer (3 kg N ha–1 year–1) (Rohde et al. 2006; Packett et al. 2009). This N, which is immediately bioavailable to aquatic ecosystems, should be a priority for improved management. As much as 77% of this was calculated to be produced by the sugarcane industry, demonstrating the importance of improved N management for this major land use. This finding is consistent with the monitoring data from this catchment and the adjacent Johnstone River (Hunter and Walton 2008). On a spatial basis, N management in the subcatchments around Tully, Euramo and Jumbun is a priority because of high DIN loads and the proximity to the GBR.
DIN loads from the sugar industry could be reduced by as much as 29% by adoption of Six Easy Steps, which is currently being delivered by BSES in Tully and other catchments. The program is an integrated approach to nutrient management for all nutrients that aims to combine sustainable production with minimising environmental impacts. Further reductions in DIN loads to the GBR are possible by using N replacement (S4) and N fixation (S5), provided that these practices are economically and practically feasible. These N management techniques need further research and development work under local conditions. Neither incorporates improved management of P, a contaminant of concern for the GBR. Total P export was ~1/10 of the TN export and mostly from particulate P (65%), which illustrates the importance of sediment control from fertilised cropping lands. However, while a reduction of 25% in DIN loads by the sugarcane and banana industries may be readily achievable, Brodie et al. (2009) have reported that a reduction of 80% may be needed in the Tully–Murray to meet target chlorophyll loads in the marine environment. They discuss the implications of this disparity.
TN loads of 8.3 kg ha–1 year–1 were 70% of that reported in the Johnstone River (Hunter and Walton 2008), but 70% higher than the load calculated for the north of South America (Howarth et al. 1996). TP loads of 0.9 kg ha–1 year–1 were ~40% of those in the Johnstone and the Amazon Rivers. However, as stated earlier, management of sediment with associated reduction in TN and TP is a lower priority than DIN based on modelling and monitoring.
Modelling of the catchment could be improved by better prediction of sediment loads from steep, wet forested areas. This will require a considerable research effort to calibrate the RUSLE under these conditions by measuring sediment generation rates. An improvement already underway is the development of daily time step models such as waterCAST (formerly E2; Argent et al. 2005), rather than average annual models such as SedNet/ANNEX. The daily time step is required to integrate with models for marine receiving waters.
Recent research has identified that over-bank flows in the Tully–Murray that are not measured by the Euramo gauging station can contribute extra volumes of water, sediment and nutrient to the GBR (Wallace et al. 2009). These additional loads may result in an underestimate by gauging of the annual average N load of ~40–75% and the P load of ~30–50%. However, this does not alter the importance of improved management of N by the sugarcane industry.
Acknowledgements
The study was funded by the Queensland Department of Natural Resources and Water and Terrain NRM Tully Water Quality Improvement Plan with funding from the Department of the Environment, Water, Heritage and the Arts.
Bainbridge, Z. T. , Brodie, J. , Faithful, J. W. , Sydes, D. A. , and Lewis, S. E. (2009). Identifying the land-based sources of suspended sediments, nutrients and pesticides discharged to the Great Barrier Reef from the Tully–Murray Basin, Queensland, Australia. Marine and Freshwater Research 60, 1081–1090.
Brodie, J. , Lewis, S. , Bainbridge, Z. , Mitchell, A. , Waterhouse, J. , and Kroon, F. (2009). Target setting for pollutant discharge management of rivers in the Great Barrier Reef catchment area. Marine and Freshwater Research 60, 1141–1149.
Howarth, R. W. , Billen, G. , Swaney, D. , Townsend, A. , and Jaworski, N. , et al. (1996). Regional nitrogen budgets and riverine N & P fluxes for the drainages to the North Atlantic Ocean: natural and human influences nitrogen cycling in the North Atlantic Ocean and its watersheds. Biogeochemistry 35, 75–139.
| Crossref | GoogleScholarGoogle Scholar | CAS |
Mitchell, A. , Reghenzani, J. , Faithful, J. , Furnas, M. , and Brodie, J. (2009). Relationships between land use and nutrient concentrations in streams draining a ‘wet-tropics’ catchment in northern Australia. Marine and Freshwater Research 60, 1097–1108.
Roebeling, P. C. , van Grieken, M. E. , Webster, A. J. , Biggs, J. , and Thorburn, P. (2009). Cost-effective water quality improvement in linked terrestrial and marine ecosystems: a spatial environmental–economic modelling approach. Marine and Freshwater Research 60, 1150–1158.
Wallace, J. , Stewart, L. , Hawdon, A. , Keen, R. , Karim, F. , and Kemei, J. (2009). Flood water quality and marine sediment and nutrient loads from the Tully and Murray catchments in north Queensland, Australia. Marine and Freshwater Research 60, 1123–1131.