

Flood water quality and marine sediment and nutrient loads from the Tully and Murray catchments in north Queensland, Australia
Jim Wallace A B , Lachlan Stewart A , Aaron Hawdon A , Rex Keen A , Fazlul Karim A and Joseph Kemei AA CSIRO Land and Water, Townsville, Qld 4814, Australia.
B Corresponding author. Email: jim.wallace@csiro.au
Marine and Freshwater Research 60(11) 1123-1131 https://doi.org/10.1071/MF08356
Submitted: 19 December 2008 Accepted: 22 May 2009 Published: 17 November 2009
Abstract
Current estimates of sediment and nutrient loads from the Tully–Murray floodplain to the Great Barrier Reef lagoon are updated by taking explicit account of flood events. New estimates of flood discharge that include over-bank flows are combined with direct measurements of sediment and nutrient concentrations in flood waters to calculate the loads of sediment and nutrient delivered to the ocean during 13 floods that occurred between 2006 and 2008. Although absolute concentrations of sediment and nutrient were quite low, the large volume of water discharged during floods means that they make a large contribution (30–50%) to the marine load. By not accounting for flood flows correctly, previous estimates of the annual average discharge are 15% too low and annual loads of nitrogen and phosphorus are 47% and 32% too low respectively. However, because sediments may be source-limited, accounting for flood flows simply dilutes their concentration and the resulting annual average load is similar to that previously estimated. Flood waters also carry more dissolved organic nitrogen than dissolved inorganic nitrogen and this is the opposite of their concentrations in river water. Consequently, dissolved organic nitrogen loads to the ocean may be around twice those previously estimated from riverine data.
Introduction
Concern over anthropogenically enhanced loads of sediment and nutrients to the Great Barrier Reef (GBR) lagoon has led to the development of ‘water quality improvement plans’ (WQIPs) for several catchments adjacent to the Coral Sea, including the Tully and Murray catchments (Kroon 2008). These plans identify the current status of constituent loads, along with a set of management practices to reduce them. In the Tully and Murray catchments in northern Queensland, Australia, the current sources and annual average loads of sediment and nutrient have been estimated using flow and concentration data (Furnas 2003) and the SedNet model (Brodie et al. 2003; Hateley et al. 2006; Armour et al. 2007, 2009). Both of these approaches (measurement and modelling) provide estimates of the annual average load delivered to the ocean by flows from rivers in the GBR catchments. However, particularly in the wet tropics, many catchments are subject to frequent flooding, when the water that runs over bank bypasses the river gauges. This ungauged over bank flow may carry a significant load to the ocean that is additional to the current river-based load estimates.
The present paper quantifies over-bank flood loads in the Tully and Murray catchments. Flood water sediment and nutrient concentration data were obtained during nine floods that occurred between 2006 and 2008. The flood discharge estimates for these events were derived from measurements of catchment-wide rainfall, rather than the flows recorded in the Tully and Murray Rivers. Flood concentration and discharge data were then combined to estimate the loads of sediment and nutrient delivered to the GBR lagoon during over-bank floods. The contribution of the floods is compared with previous estimates of the annual average loads derived from gauged river discharge, and sediment and nutrient concentrations measured at the mouth of the Tully River.
Materials and methods
Location, rainfall and hydrology
The current study was carried out in the Tully–Murray floodplain in northern Queensland, Australia (Fig. 1). The combined area of the Tully and Murray catchments is 2072 km2 of which 40% (832 km2) is within the floodplain boundary (Karim and Wallace 2008). The catchment topography varies from steep rainforest-covered mountainous areas in the west, to the low relief floodplain containing agriculture in the east. The mean annual rainfall is between 2000 and 4000 mm, depending on the location in the catchment. Most of the rainfall (60–80%) occurs during the wet season from December to April. The Tully and Murray Rivers are the two main waterways in this area that export sediment and nutrients to the GBR lagoon.

|
Gauged mean daily discharge and stage height data for the Tully River at Euramo (station 113006A), the Murray River at Upper Murray (station 114001A) and Cochable Creek (station 113004A) (Fig. 1), were obtained from the Queensland Department of Natural Resources and Water.
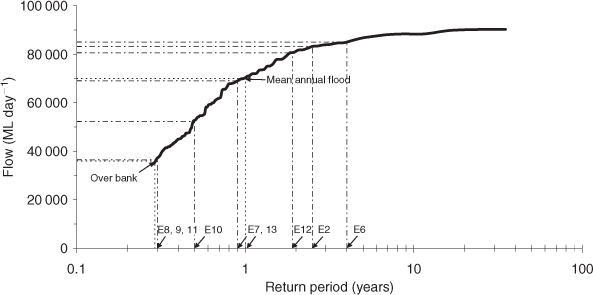
Flooding is common on the Tully–Murray floodplain, with the river going over bank three to four times a year on average (Fig. 2; Wallace et al. 2007). The mean annual flood has a discharge about twice the bank-full discharge. Because the topography of the Tully–Murray floodplain is very flat and the rivers are quite close, water from the two rivers often merges during a flood.
|
Between 2006 and 2008, nine over-bank flood events in the Tully–Murray floodplain ranged in size from short-duration (1 day) just over-bank events (Nos 8, 9 and 11) with a return period about three times per year, to a 10-day over-bank flood (No. 6) with a return period of 1 in 4 years (Fig. 2). There were four other floods in 2006 (for which no water quality data were recorded), making a total of 13 floods in 3 years, so the floods sampled are a representative range of the current flood size and frequency in these catchments.
Flood sediment and nutrient load estimation
Estimates of the loads of sediment and nutrient that are exported from catchments to the ocean are generally based on the product of river discharge and the concentration of the material of interest. However, during over-bank floods, standard river gauges do not record the true catchment discharge very accurately and the size of the gauge underestimates increases with the size of the flood (Wallace et al. 2008). Furthermore, the concentration of sediment and nutrients in flood waters may well be different from the concentrations recorded within rivers during channelised flow. To make an accurate estimate of export during floods it is therefore necessary to measure the concentrations of the materials of interest in over-bank flood waters and to multiply these by the correct flood discharge. The following sections describe how these estimates and measurements were made in the Tully and Murray catchments.
Flood discharge estimation
Two corrections need to be applied to a standard river gauge in order to obtain the correct discharge from an entire catchment during a flood. The first is simply a correction to the measured daily discharge, Qg,d, from the catchment area above the gauge, Aa, to allow for run-off generated from the area downstream of the river gauge, Ab, as follows,
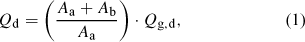
where Qd is the discharge from the entire catchment. However, when the water level is over bank, Qg,d will be an underestimate of the discharge from Aa because river and over-land flow that originates in the floodplain above the gauge can bypass it during floods. The true flood event run-off (Qevent) can be derived from daily rainfall, Pg,d, if an appropriate run-off coefficient, RC, can be derived for over bank events, in which case,
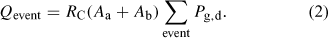
Flood run-off coefficients for the nine over-bank events between 2006 and 2007 were estimated using the NAM (Nedbor-Afstromings Model) rainfall-run-off model (DHI 2008), which was applied in four subcatchments upstream of the Tully–Murray floodplain and two subcatchments on the floodplain. The NAM model accounts for losses due to evaporation and infiltration into the soil and was calibrated using the flow data gauged in the upper catchments at Cochable Creek and Upper Murray (Fig. 1). Because most floods occur well into the wet season when the soils in the catchment are highly saturated and ground water tables close to the surface, soil moisture was set to 90% and groundwater depth to 0.5 m for the over-bank events. Using this method, flood event run-off coefficients were found to increase with rainfall from 0.60 to 0.95 and were similar to the flood RC values derived using a flood hydrograph decomposition method described by Wallace et al. (2008).
Daily rainfall data from 17 rainfall measurement stations located within the Tully and Murray catchments were averaged to give the catchment and subcatchment daily mean rainfall inputs (Wallace et al. 2008).
Flood water quality sampling
Water samples were collected during 9 of the 13 over-bank flood events that occurred in the Tully–Murray floodplain between 2006 and 2008. Samples were taken from flood water on the floodplain at distances ranging from 200 to 1200 m north of the Murray River (Fig. 1). The number of sample locations (15) was chosen to try and ensure that the mean concentrations of sediment or nutrient measured at any time had a coefficient of variation of <50% (see Wallace et al. 2007 for details). For the nine flood events studied, an average of 35 samples was collected per event, equivalent to six samples per day.
Water samples at these sites were collected by either fixed installation (fully automatic, semi-automatic and rising stage samplers) or manual sampling. The automated samplers were activated by the presence of flood water, and retrieved and stored water samples at regular intervals during the flood events. Three automated samplers were in operation on the floodplain, one fully automatic (ISCO) refrigerated sampler and two custom made semi-automatic, unrefrigerated samplers. Eight fixed rising-stage samplers also collected samples during the flooding events. Further details of the design, construction and operation of the fixed installation samplers are given by Hawdon et al. (2007).
As soon as practicable after flooding had started (usually 1–3 days), the inundated floodplain was accessed using a small boat, and water samples from the semi-automatic collection systems were retrieved. At this time, additional manual water quality, flood depth and water turbidity measurements were also collected. All water samples were packed in ice for transport to the laboratory where they were subsequently analysed for turbidity, total suspended sediment (TSS), and nitrogen and phosphorus species. The complete sampling methodology, preservation techniques and analytical methods were in accordance with American Public Health Association standards (APHA 1998).
Estimation of marine loads during floods
The daily loads of suspended sediment and nitrogen and phosphorus species exported to the GBR lagoon as a result of the flooding events were calculated by multiplying the above corrected over-bank daily discharge volumes by the measured daily average concentration of the constituent of interest. This assumes that all of the flood waters reach the ocean and this is supported by our hydrological and hydro-dynamic modelling. On days where concentration data were not measured, values were linearly interpolated between previous and later measurements. Loads of suspended sediment, nitrogen and phosphorus for each flood event were taken as the sum of the daily loads in each event. Event mean concentrations of suspended sediment, nitrogen and phosphorus were calculated by dividing the total event load by the total event discharge. A flood ‘event’ was defined as the period during which flood water was detected by our instruments on the floodplain. Further details of the estimation of marine loads are given by Wallace et al. (2008).
Results and discussion
Suspended sediment concentrations
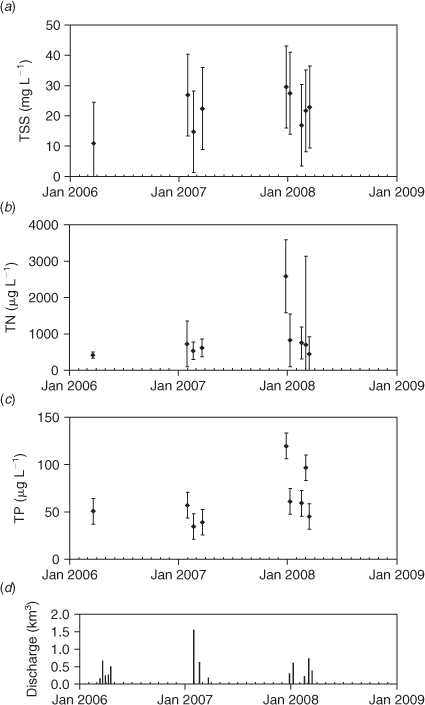
TSS concentration varied during the nine flood events when water quality was measured (Fig. 3a). This figure shows the event mean concentrations whereas details of the daily concentration fluctuations are given by Wallace et al. (2007, 2008). TSS concentrations in flood waters were low (10–30 mg L–1) and similar to the average value for high flows from subcatchments in the Tully–Murray area (25 mg L–1) reported by Bainbridge et al. (2009). These measured TSS concentrations are somewhat less than the mean annual average figures quoted by Furnas (2003) and Armour et al. (2009) for water in the Tully River (i.e. 32 and 44 mg L–1 respectively).
|
TSS concentrations were highest in the first flood of each season, and this resembles peaks that are observed in river flows (e.g. see Furnas 2003) that are referred to as the ‘first flush’. These initial flows of the wet season have high sediment concentrations because they tend to pick up fine sedimentary material that has accumulated on the land surface during the relatively dry periods between wet seasons. It is also possible for high concentrations in the first flush to be due to the mobilisation of fine sediments that have accumulated in catchment watercourses during the relatively sedate flow conditions of the dry season. Following the onset of the first flood rains, high flow velocities and volumes could remobilise these fine sediments, giving rise to high initial TSS concentrations. Further evidence for the existence of the first flush phenomenon in floods is given by Wallace et al. (2008) who concluded that first flush run-off is likely to mobilise a relatively consistent, catchment-wide (land-surface and in-stream) store of labile sediment. This conclusion is supported by catchment-wide sediment modelling, where the majority of the ocean sediment flux is derived from the rainforest in the upper catchment (Armour et al. 2007, 2009).
Nutrient concentrations
Total nitrogen (TN) and total phosphorus (TP) event mean concentrations were highest on the first day of each flood event and tended to decline in subsequent events (Fig. 3b, c). Peak concentrations of TN were ~2600 μg L–1 in the first flood event of 2008, but this peak declined to ~700 μg L–1 in the subsequent floods in that year. The first flush concentration in 2008 (2600 μg L–1) was much higher than the first flush in 2007 (720 μg L–1) and this may be associated with the 2008 first flood being quite small, with only about one-fifth of the water volume of the first flood in 2007. The consistently lower TN concentrations in floods after the first flood of the season may be because much of the nutrient that can be washed off in floods has already been removed by the first over-bank event in each season.
TP event mean concentrations were more than an order of magnitude lower than TN concentrations (Fig. 3c). TP concentrations were highest in 2008, with the first flood containing the peak concentration (120 μg L–1), so the ‘first flush’ phenomenon is just as pronounced (relatively) for phosphorus as it is for nitrogen.
The speciation within the TN concentration varies between the first and subsequent floods (Fig. 4a). In the first floods of the wet season, most of the nitrogen was in the form of dissolved inorganic nitrogen (DIN; ammonia, nitrite and nitrate). Dissolved organic nitrogen (DON) formed the next largest constituent, with the smallest contribution from particulate nitrogen (PN). However, in all subsequent floods, DON was the largest fraction of the TN load. For channelised flows in the Tully River, most nitrogen is in the form of DIN, similar to the first flush flood waters reported here (Fig. 4a; Furnas 2003). However, the dominant concentration of DON in flood waters after the first flood of the season is in sharp contrast to the speciation of nitrogen in river waters and this will affect the speciation of the total load to the ocean (see later).

|
The speciation within the TP concentration showed a dominance of particulate phosphorus (PP) in both the first flush flood and subsequent floods (Fig. 4b). Filterable reactive phosphorus (FRP) is the next largest component, with dissolved organic phosphorus (DOP) concentrations tending to be the lowest. The speciation in phosphorus in flood waters is similar to that observed in river waters (see Furnas 2003; data shown in Fig. 4b).
Flood discharge
For the 13 flood events between 2006 and 2008, floods ranged in duration from 3 to 13 days, with return periods of 0.3 and 4 years respectively (Table 1). Very large amounts of water left the Tully and Murray catchments each year as over bank flow; annual totals range from 2.0 to 2.7 km3. The gauging efficiency of the Tully River gauge (measured discharge/corrected discharge) averaged 0.69 for all flood events, implying that the over-bank flood discharge is ~46% greater than the measured flow (on average). The area correction for the Tully catchment accounts for 6% of this increase, so the remaining 40% is due to over-bank flows bypassing the river gauge. The Upper Murray gauge efficiency only averages 0.17, with the area correction adding 236% to the gauged flow and bypass flow adding a further 206% (on average). The over-bank flood discharge for the Murray is therefore over four times the measured flow, mainly because of the small area (30%) upstream of this gauge. For the combined Tully and Murray catchments, the over-bank flood discharge during all 13 flood events between 2006 and 2008 was 77% greater than the measured flow; 24% of this was due to the area correction and 53% due to bypass flow.

|
Fluxes to the GBR lagoon
A range of published values for the total load of suspended sediment, nitrogen and phosphorus are available for the Tully and Murray catchments (Table 2). Several of these studies include subcatchments that are outside the Tully and Murray hydrological catchments, i.e. to the south, the Whitfield, Dellachy, Meunga and Kennedy Creeks; and to the north, the North Hull River. To make comparisons on the same areal basis, we have therefore scaled any figures reported for the larger catchment area (e.g. by Furnas 2003 and Armour et al. 2007) down to the Tully and Murray hydrological catchments only (i.e. from 2790 to 2072 km2). Sediment and nutrient load estimates for these catchments vary by a factor of 3–4. The average loads derived from data are lower than those derived using the SedNet model; however, this difference may not be significant, given the high coefficient of variation (~40%) in these averages.

|
Table 3 shows the estimated total load of suspended sediment, nitrogen and phosphorus contained in the flood water for the nine flood events analysed in the study. Estimates of TN, phosphorus and sediment loads for the four events in 2006 where there are no flood water quality measurements were estimated using the event mean concentrations derived from the other nine events. Table 3 also shows the annual average total loads derived from all of the other published studies in the Tully–Murray catchments (taken from Table 2). The values of annual average speciation in nitrogen and phosphorus for the published estimates were calculated using the mean speciation fractions reported by Furnas (2003) and Armour et al. (2007).

|
Total annual suspended sediment export during over-bank floods varied between 40 and 56 thousand tonnes, with an uncertainty of about ±50%. The flood load, which occurs in only 4–5% of the year, was therefore 36–50% of the total annual average load. The flood loads are much greater (by 77%) than those that would have been obtained had the suspended sediment export calculation been based on gauged discharge alone (see also Wallace et al. 2007).
Table 3 also gives the estimates of TN and TP that left the Tully and Murray catchments during floods. The TP loads are much lower (<10%) than the nitrogen loads, which is consistent with previous measurement and modelling exercises for these catchments (Furnas 2003; Armour et al. 2007). The amount of nitrogen carried in flood water is 92–127% of the annual average riverine nitrogen load and the phosphorus in flood waters is 70–104% of the annual average riverine phosphorus load. However, again TN and phosphorus export estimates based on gauged discharges alone are only just over half of those estimated when the flood load is included.
The relative proportions of the constituent nitrogen species differ markedly between flood waters and river water (Table 3). In flood waters, DON averaged 42% of TN, compared with 21% in river water. DIN averaged 38% of TN in flood waters and 48% in river water. A similar result was noted in the estimates of nutrient fluxes associated with the cyclone Larry floods in 2006 (Wallace et al. 2007). Thus, the tonnage of DON that is exported to the GBR lagoon during floods can exceed the tonnage of DIN (e.g. as in 2007).
The water quality difference between the flood waters and ‘average’ river flows implies that the main nutrient load in flood waters (especially after the first flush) is in the form of DON rather than DIN, the major sources of which may be quite different. DON is not usually considered as a potential source of enhanced nutrient load to the ocean because its flux from the land is assumed to have not changed significantly since European settlement and/or it is of low biological availability. However, there is evidence that some forms of DON (amino acids, e.g. glycine, glutamic acid and urea) can be broken down by bacteria and macroalgae (Tyler et al. 2001). Furthermore, Wiegner et al. (2006) have also demonstrated that ~23% of the DON in rivers in eastern USA is bio-available. Recent work in tidal marshes by Mozdzer (2006) has also demonstrated that macrophytes such as Phragmites australis and Spartina alterniflora are capable of directly assimilating DON at rates as high as 20% of those at which they assimilate DIN (ammonia). Significant fractions of DON are also available for assimilation by marine bacteria (Stepanauskas et al. 1999) and phytoplankton (Seitzinger et al. 2002). The implication is, therefore, if DON is present in flood water at concentrations similar to or greater than DIN and it can be assimilated at reasonable rates, then it will have a significant effect on biological systems (fresh water, estuarine and marine) in addition to DIN.
There remains the question of whether DON fluxes that may originate mainly from natural sources (e.g. rainforests) have changed over the last 100 years or so. This is possible because of removal of wetlands and the installation of land drainage systems in coastal floodplains. Over 70% of the coastal wetlands in the Tully and Murray catchments have been removed in the past century, so it is likely that less of the flood waters remain on the floodplain. Furthermore, land drainage will have sped up run-off rates and amounts, especially during floods. There is some evidence for these effects from the work by McCulloch (2006), who has shown from analysis of corals in the GBR lagoon that run-off volumes per unit rainfall may have doubled since European settlement. Provided DON levels have not decreased over the same period, then nitrogen loads to the ocean could have increased substantially due to DON alone.
In the 2006–2008 floods, the overall amount of TP exported ranged from 119 to 176 t (Table 3), an order of magnitude lower than for nitrogen. However, as with nitrogen, there are differences between the estimated relative contributions of the constituent species found in flood water and river water. FRP is estimated to form ~16% of the annual phosphorus export via the river, whereas the results of the present study indicate that flood events export 31%. The annual average amount of PP in river water (70%) is higher than the equivalent figure for floods (52%). The main differences in the phosphorus species in flood and river water therefore appear to be the lower particulate and higher dissolved fractions in flood waters.
The above marine loads are for 3 years where the annual discharge exceeds the long-term (1972–2008) annual average discharge (i.e. annual flows in 2006, 2007 and 2008 were 1.14, 1.32 and 1.21 times the long-term average respectively). We therefore estimated the long-term average contribution of over-bank floods and compared this with the average of all published estimates in Table 4. To do this, the 1972–2008 daily discharge records for the Tully and Murray Rivers were separated into over-bank flow and bank flow, depending on whether the daily discharge was greater or less than the flow rate at the Euramo and Upper Murray gauges associated with the initial detection of water on the floodplain by our automatic water samplers (31 400 and 2333 mL day–1 respectively). For the published estimates, in-bank and over-bank loads were calculated using the proportions of flow that occurred above and below the above inundation threshold (Table 4). The over-bank flood loads were then updated using the corrected flood discharge and flood event mean sediment, nitrogen and phosphorus concentrations measured in the present study. This analysis shows that, on average, 34% of the TSS load is delivered during over-bank floods and that correcting this total annual load to allow for flood discharge has very little effect (Table 4). This is because the potential load enhancement due to the increased flood discharge is compensated by more dilute TSS concentrations in flood waters (e.g. average TSS concentration in flood waters was ~22 mg L–1, compared with ~30 mg L–1 in river water). However, this is not the case for nitrogen and phosphorus, where a higher concentration of these materials in flood waters leads to a 47% increase in the estimated annual average TN load and a 32% increase in the annual average TP load (Table 4). About half of this total load of nitrogen and phosphorus is delivered to the ocean during over-bank floods. When flooding is taken into account, annual average sediment loads do not increase significantly, whereas nutrient loads increase markedly. This implies that sediment fluxes may be limited by their sources in the catchment, whereas nutrients fluxes are more related to discharge, i.e. they are transport limited.

|
Conclusions
We have shown that over-bank floods can make a large contribution to the marine load of sediment and nutrients, despite the relatively low concentrations of these materials in flood waters. Because much of this load is not recorded by standard river gauges, current marine load estimates of material fluxes (based on gauged flows, measured river concentrations and modelling) from Australian wet tropical catchments with frequent flooding are probably too low, by quite significant amounts, depending on the estimation method and constituent. For example, current annual average loads of phosphorus and nitrogen from the Tully and Murray catchments are 30–50% too low. In contrast, sediment loads do not increase when flooding is taken into account and this may be because this material is source-limited whereas nutrient fluxes are transport-limited.
WQIPs (e.g. Davis 2006; Drewry et al. 2008; Kroon 2008) require marine loads to be monitored in order to ‘measure’ the effect of land-based changes in nutrient use and management. However, the present study has shown that annual marine loads will be very dependent on the number and size of over-bank flood events in any year. This will make the monitoring of any trends in ocean loads difficult as the trend may be small in relation to natural interannual variability. Further analysis is required to quantify how large a change in load needs to be over a given period before it can be detected within the interannual variability. Despite the relatively high number of water quality samples, our load estimates still have a high uncertainty, e.g. up to ±69% for DIN. This means that monitoring of marine loads will also take a significant number of samples, preferably of both river and flood flows – otherwise there will be very large uncertainties in mean ocean loads, making it difficult (or even impossible) to detect any load reductions owing to land-use or management changes.
Current WQIPs (e.g. Davis 2006; Drewry et al. 2008; Kroon 2008) focus on farm interventions in agriculture that will potentially reduce DIN loads. However, it appears that flood waters can carry more DON than DIN and this is the opposite of their concentrations in river water. Consequently, DON loads to the ocean may be about twice those previously estimated from riverine data. It is possible that this DON load may have increased because of land drainage and it may also be biologically available, so reductions in DON (and sediment) loads that arise outside the floodplain may also be needed to meet marine water quality targets. Reducing DON loads will require interventions different from those used in agriculture to reduce DIN, e.g. measures that slow down and reduce drainage, such as the introduction and/or rehabilitation of riparian zones and wetlands (e.g. Kroon 2008).
Acknowledgements
We thank the Australian Government Department of the Environment and Water Resources, Heritage and the Arts (DEWHA), TERRAIN Natural Resource Management Ltd, the RRRC Marine and Tropical Science Research facility (MTSRF) and the CSIRO Water for a Healthy Country for co-funding support for this study. We are also grateful for the assistance of the Australian Centre for Tropical Freshwater Research (ACTFR) for processing our water quality. We also acknowledge the supply of rainfall data from the Australian Bureau of Meteorology (BOM) and river flow data from the Department of Natural Resources and Water (DNRM). We are grateful to CSIRO colleagues and the external reviewers for their very helpful comments on the draft manuscript.
Armour, J. D. , Hateley, L. R. , and Pitt, G. L. (2009). Catchment modelling of sediment, nitrogen and phosphorus nutrient loads with SedNet/ANNEX in the Tully–Murray basin. Marine and Freshwater Research 60, 1091–1096.
Kroon, F. J. (2009). Integrated research approach to improving water quality in the Great Barrier Reef Region. Marine and Freshwater Research 60, i–iii.
Seitzinger, S. P. , Sanders, R. W. , and Styles, R. (2002). Bioavailability of DON from natural and anthropogenic sources to estuarine plankton. Limnology and Oceanography 47, 353–366.
| CAS |
Wiegner, T. N. , Seitzinger, S. P. , Gilbert, P. M. , and Brink, D. A. (2006). Bioavailability of dissolved organic nitrogen and carbon from nine rivers in the eastern United States. Aquatic Microbial Ecology 43, 277–287.
| Crossref | GoogleScholarGoogle Scholar |
