

Sewage-derived nitrogen dispersal and N-fixation in Port Phillip Bay in south-eastern Australia
Gregory D. Parry A * and Kerry P. Black B
A
B
Abstract
Extreme values of nitrogen isotope ratios (δ15N) in biota identify areas influenced by sewage discharges and nitrogen fixation.
To measure the ecological footprint of the Western (sewage) Treatment Plant (WTP) by using δ15N measurements and an NPZ model, and to identify regions where nitrogen is fixed in Port Phillip Bay, in south-eastern Australia.
δ15N was measured in situ for four intertidal species at 27 sites around the perimeter of the bay and simultaneously in an alga and a mussel deployed at 42 sites throughout the bay. The intertidal species were also transplanted from an area of low 15N to areas of high 15N.
δ15N was elevated for all species adjacent to the WTP and along the north-western shoreline of Port Phillip Bay and for ~10–15 km offshore. Transplanted algae adopted the δ15N of their new environment in 6–12 weeks, whereas the half-life of tissue turnover of 15N in intertidal filter-feeders was 90–234 days. Nitrogen fixation contributed to N available in two geographically isolated seagrass-dominated bays.
Spatial patterns of δ15N of deployed alga and phytoplankton-consuming mussels were similar to the modelled distribution of dissolved inorganic nitrogen and the modelled distribution of flagellates, respectively.
Preferred species for on-going N monitoring are identified.
Keywords: algae, δ15N, eutrophication, invertebrates, modelling, nutrient dynamics, N-fixation, seagrass, stable isotopes.
Introduction
Dissolved inorganic nitrogen (DIN) is the limiting nutrient in most marine systems (Ryther and Dunstan 1971), including Port Phillip Bay (Harris et al. 1996). DIN is required to sustain marine productivity, but excessive concentrations have detrimental environmental effects. The positive effects of nutrients on the productivity of Port Phillip Bay were evident when input of DIN was reduced by a prolonged drought (1997–2010) that coincided with upgraded sewage treatment at the Western Treatment Plant (WTP). This sustained reduction in DIN inputs resulted in a 69% reduction in fish biomass in central Port Phillip Bay (Parry and Hirst 2016) and in an 80–90% reduction in seagrass cover at locations where DIN became limiting (Ball et al. 2014; Hirst et al. 2016). Detrimental effects of high nutrients in Port Phillip Bay include establishment of exotic algae that require higher nutrient conditions than do native species (Carnell and Keough 2014) and noxious algal blooms (Parry et al. 1989). Elevated nutrient concentrations near the WTP also cause increases of attached and drifting seaweed, with a high 15N signal (Rodriguez 2019), at least 10 km offshore on the north-west of the bay (Chidgey and Edmunds 1997; Rodriguez 2019). In the 1980s, large amounts of this seaweed washed ashore on beaches on the north-west of Port Phillip Bay (Davies and Brown 1986), but this high marine productivity did not lead to low dissolved oxygen near the seabed (Mickelson 1990), even near WTP outlets, where infaunal diversity and biomass remained high (Poore and Kudenov 1978; Coleman and Gason 2000). Sewage treatment upgrades resulted in a ~90% decline in the amount of drifting seaweed near the WTP between 1995 and 2018 (Rodriguez 2019).
Understanding the main sources of DIN, their dispersal and temporal variation is key to understanding the ecology of many marine systems. Nutrient footprints may be determined by direct measurements of nutrient concentrations, distributions of algae and fauna, computer models or with nitrogen isotopes. The latter requires distinctive isotope signals, but all methods have weaknesses such as cost, model quality or seasonal influences. For example, during the Port Phillip Bay study in 1969–1973 (Melbourne and Metropolitan Board of Works 1973), direct measurements showed that nutrient concentrations were elevated near WTP, and benthic fauna within ~10 km offshore was distinct from that elsewhere, but the distribution of this fauna also correlated well with sediment type and depth (Poore and Kudenov 1978; Currie and Parry 1999). In this paper, the nutrient footprint of the WTP is estimated using elevated δ15N in biota, supported by nutrient measurements and a calibrated NPZ model.
Nitrogen isotope tracking (15N/14N or δ15N), which integrates exposure to nitrogen over weeks to months, has become widely used around sources with a distinctive 15N signature (Fong 2008; Connolly et al. 2009). Low values of δ15N result from nitrogen fixation (N-fixation) (Welsh 2000), whereas high values result from isotopic fractionation during secondary and tertiary sewage treatment (Costanzo et al. 2001; Savage 2005; Thornber et al. 2008). Fractionation occurs because 14NH3 volatilises more readily than does 15NH3, and 14NO3− is reduced more readily than is 15NO3− by denitrifying bacteria (McClelland and Valiela 1998; deBruyn and Rasmussen 2002; Savage 2005). High δ15N values in biota near sewage outfalls provide a time-integrated tracer of the plume (Costanzo et al. 2001; Gartner et al. 2002; Thornber et al. 2008) and the transfer of nutrients into the food web (Hansson et al. 1997; Gaston et al. 2004; Pitt et al. 2009; Miller et al. 2010). Sedentary taxa, including macroalgae (Costanzo et al. 2001, 2005; Gartner et al. 2002; Rogers 2003; Savage and Elmgren 2004; Fertig et al. 2009; Morris et al. 2009; Dailer et al. 2010, 2012; Parry 2021) and filter-feeders, including ascidians and sponges (Gartner et al. 2002), and bivalves (Rogers 2003; Carmichael et al. 2004; Piola et al. 2006; Gustafson et al. 2007; Fertig et al. 2009) have all been used to measure the biological footprint of sewage-derived 15N.
In this study, δ15N was measured in situ by using four intertidal species around the perimeter of the bay and an alga and mussels deployed throughout the bay. The four intertidal species were also transplanted from a site with a low δ15N to sites near the WTP where δ15N was expected to be high. The period the alga and mussels were deployed was modelled using the Bubbles NPZ model (Black et al. 2016, 2022; Jenkins and Black 2019, 2021).
The objectives of the study were as follows:
To use multiple techniques to establish the footprint of nutrients from a sewerage-treatment plant (WTP) on Port Phillip Bay, including identification of sites with a low δ15N where nitrogen fixation may be important.
To estimate the time periods over which 15N is integrated by different species.
To investigate species suitable for ongoing cost-efficient monitoring of the nutrient footprint of WTP.
Materials and methods
Study site
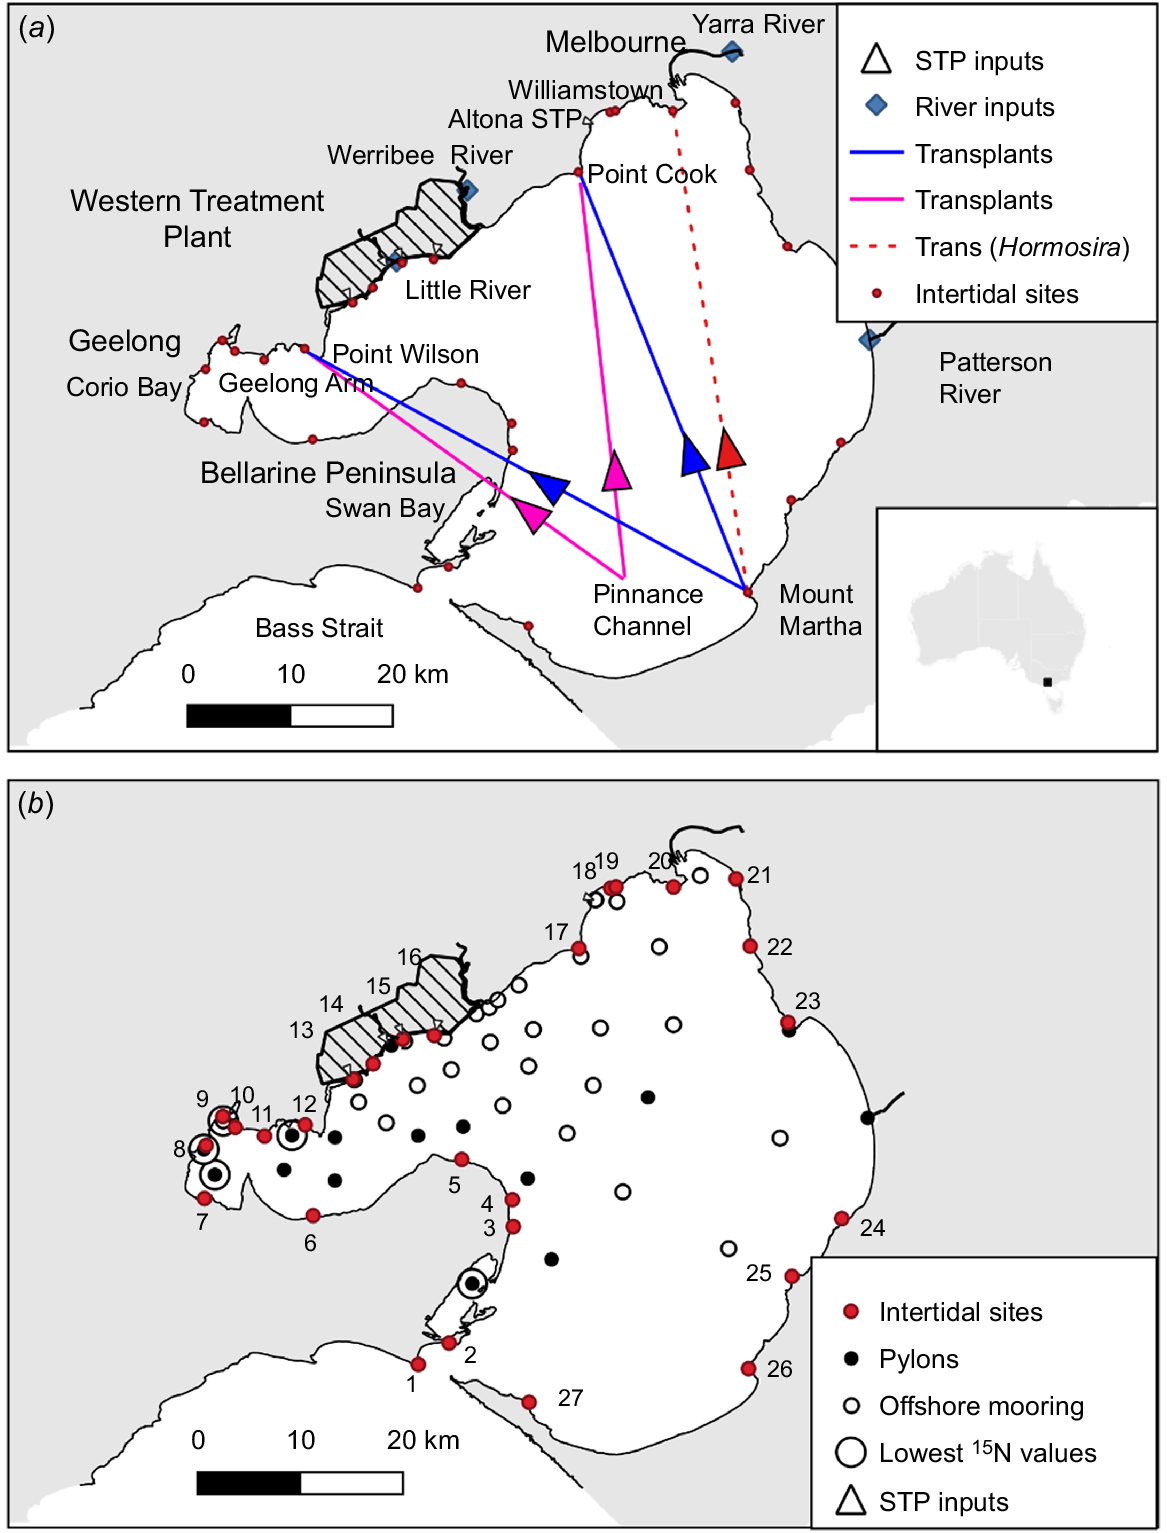
Port Phillip Bay is a 1930 km2 marine embayment in south-eastern Australia. The Yarra River, which passes through Melbourne, enters the north of the bay, whereas the bay is connected to Bass Strait by a narrow (3 km) entrance to the south (Fig. 1). The Western Treatment Plant (WTP) treats sewage from 55% of Melbourne’s population of 5 million and discharges ~400 ML day−1 of tertiary sewage at four outlets located along 10 km of the north-western shoreline of Port Phillip Bay in the Geelong Arm (Fig. 1). The WTP is the world’s largest lagoon sewage treatment plant (108 km2); however, between 2004 and 2012, approximately half the sewage was treated by activated sludge plants (ASPs). Most effluent is discharged from the northernmost outlet (15 East), which receives all the effluent from the ASPs and some effluent from the lagoons. The other three outlets (Lake Borrie, 145 West and Murtcaim) received effluent only from the extensive lagoon system, and the residence time of sewage in these lagoons is longer (up to 50 days).
Sampling sites in Port Phillip Bay. (a) Location of the STP inputs and of sampling sites on river inputs. The locations of all transplant sites are shown, including Williamstown, where only Hormosira was transplanted. Arrows indicate direction of transplantation. (b) Offshore sites (○) where Botryocladia and Mytilus were deployed, including offshore sites adjacent to pylons with Mytilus attached (●). Numbered sites (red) show where δ15N was measured for intertidal species. Intertidal sites: 1. Point Lonsdale; 2. Queenscliff pilots pier; 3. St Leonards pier; 4. Indented Head; 5. Portarlington; 6. Avila Road; 7. Eastern Beach; 8. Pivot; 9. Geelong Grammar; 10. West of Avalon Beach; 11. Point Lillias; 12. Point Wilson quarry; 13. Murtcaim outlet; 14. Kirk Point; 15. 145 West outlet; 16. 15 East outlet; 17. Point Cook; 18. Altona pier; 19. North of Altona pier; 20. Williamstown; 21. St Kilda pier; 22. Brighton; 23. Ricketts Point; 24. Davey Bay; 25. Snapper Point; 26. Mount Martha; 27. Sorrento (Collins Settlement). Five larger circles show the five moorings or pylons with the lowest δ15N values.
The outfalls discharge the treated effluent close to shore onto inter-tidal sand flats. The freshwater discharge is buoyant and thereby highly influenced by wind. The circulation in the bay is three-dimensional with up/downwelling around the shorelines (Black et al. 1993), but the WTP plume often travels along the north-western shoreline towards the Yarra River, especially during the winter when the winds are mostly from the westerly quadrant. Similar behaviour is seen in this paper because the experiments were conducted in winter from early July to early September (Table 1).
| (a) | ||
|---|---|---|
| Sites | Frequency | |
| 15 East, 145 West, Lake Borrie, Murtcaim, Little River, Werribee River, Yarra River | Weekly | |
| Patterson River | Monthly | |
| Altona STP | Once (August only) | |
| (b) | ||
|---|---|---|
| Sites | Frequency | |
| Intertidal sites 1, 5–8, 12, 14, 17–18, 20 | Weekly | |
| Offshore sites 1–42 | Monthly | |
| (c) | ||
|---|---|---|
| Sites | Sampling dates | |
| Intertidal biota (Capreolia, Hormosira, Galeolaria and Mytilus) | ||
| Sites 1–27 | 9–15 September 2012 | |
| Sites 1, 3–12, 14 and 17 | 9–15 September 2011 A, 12–18 March 2012, 19–30 June 2012 | |
| Offshore biota (Botryocladia and Mytilus, including Mytilus on pylons) | ||
| Sites 1–42 | 2–3 September 2012 | |
Nutrient, freshwater and δ15N inputs and bay nutrients
Between July and September 2012, while Botryocladia and Mytilus were deployed in Port Phillip Bay, salinity, nutrient concentrations (NOX, NH4+, PO4−3) and δ15N of NO3− and NH4+ were measured at nine major discharges (Table 1a), whereas salinity and nutrients were measured at 10 intertidal sites on the western shoreline and at the 42 offshore mooring sites (Fig. 1, Table 1b). The frequency of each of these measurements is shown in Table 1a, b. Flow rates of all discharges (measured by Melbourne Water, and at Altona STP by City West Water) and mean DIN concentrations were used to calculate the mean daily load of ammonium, nitrate and of δ15N (Table 2).
| Site | Load N (tonnes N day−1) | Mean (concentration- weighted) δ15N | |||||||||||||||
|---|---|---|---|---|---|---|---|---|---|---|---|---|---|---|---|---|---|
| Flow (ML day−1) A | [NH4+] (μM) B | [NO3−] (μM) C | As NH4+ (A × B) | As NO3− (A × C) | As DIN | δ15N-NH4+ | δ15N-NO3− | ||||||||||
| Mean | s.e. | Mean | s.e. | Mean | s.e. | Mean | s.e. | Mean | s.e. | Mean | s.e. | Mean | s.e. | ||||
| Altona STP | 9.8 | 0.2 | 126.2 | 20.7 | 510.7 | 46.2 | 0.02 | 0.003 | 0.07 | 0.008 | 0.09 | 33 | 0.5 | 10.9 | 0.4 | 15.3 | |
| Werribee River | 404.4 | 97.5 | 5.4 | 0.9 | 141.7 | 20.7 | 0.03 | 0.012 | 0.80 | 0.311 | 0.83 | 28.9 | 5.1 | 12.4 | 0.7 | 13.0 | |
| 15 East | 456.1 | 7.7 | 757.1 | 73.6 | 910.7 | 55.2 | 4.83 | 0.552 | 5.82 | 0.451 | 10.65 | 19.2 | 2.9 | 15.9 | 0.6 | 17.4 | |
| 145 West | 75.4 | 7.6 | 1476.5 | 215.3 | 155.1 | 18.8 | 1.56 | 0.384 | 0.16 | 0.036 | 1.72 | 25.2 | 1.6 | 16.1 | 2 | 24.3 | |
| Little River | 387.8 | 97.4 | 7 | 23.6 | 0.04 | 0.13 | 0.17 | 13.2 | 6.1 | 7.7 | |||||||
| Lake Borrie | 22.1 | 2.6 | 13.9 | 1.5 | 293.7 | 33.1 | 0.00 | 0.001 | 0.09 | 0.021 | 0.10 | 33.2 | 1.8 | 32 | 0.4 | 32.1 | |
| Murtcaim | 1 | 0.1 | 10.8 | 1 | 81.4 | 13.5 | 0.00 | 0.000 | 0.00 | 0.000 | 0.00 | 22.9 | 2 | 24.3 | 2.2 | 24.1 | |
| Yarra River (Princes Bridge) | 5632.4 | 251.7 | 3.7 | 0.3 | 48 | 1.2 | 0.29 | 0.037 | 3.78 | 0.264 | 4.08 | 20.3 | 7.4 | 7.1 | 0.2 | 8.0 | |
| Patterson River | 3.5 | 1.2 | 73.8 | 13.5 | 14.8 | 10.6 | 0.4 | ||||||||||
Standard errors are shown for all estimates. The mean load-weighted δ15N for each input is shown.
Salinity was measured in the laboratory with a YSI Pro2030, calibrated against 0.582% KCl solution. Nutrient concentrations, and δ15N of NO3− and NH4+, were measured using water samples filtered in the field by using 0.45 μm syringe filters, then frozen until analysed. Nutrient samples were analysed by the Water Studies Centre, Monash University. δ15N of NO3− and NH4+ were analysed at Colorado Plateau Stable Isotope Laboratory (CPSIL), Northern Arizona University (Parry 2013). Nutrient samples with salinities of >10‰ were excluded from the estimates to ensure only undiluted nutrient and δ15N inputs were measured. This threshold was chosen on the basis of plots of the relationships between nutrient concentrations versus salinity and salinity versus the difference between sampling time and low tide (Parry 2013).
During the field study, the nine major discharges to the Bay exhibited elevated mean concentrations of nutrients and δ15N of NH4+ and NOx (Table 2). The largest dissolved inorganic nitrogen (DIN) inputs to Port Phillip Bay came from the 15 East outlet of the WTP (10.6 tonnes N day−1), the Yarra River (4.1 tonnes N day−1), 145 West outlet of the WTP (1.7 tonnes N day−1) and the Werribee River (0.83 tonnes N day−1). All other inputs were less than 100 kg N day−1 (Table 2). Notably, WTP discharges more NH4+ than NOx, while rivers and drains are dominated by NOx.
The values of δ15N in DIN were two to three times higher at the WTP discharges (17–32‰) than in the Yarra River (8‰) and Werribee River (13‰, Table 2). Discharge from Altona STP was mid-range, with δ15N = 15‰, but flows were small (Table 2).
Spatial distribution of δ15N and δ13C in biota
The red alga Botryocladia sonderi and the mussel Mytilus galloprovincialis were deployed in early July 2012 on moorings throughout Port Phillip Bay. Two months later in early September (Table 1C), δ15N and δ13C (algae only) were measured for these two offshore species and for four intertidal species.
The intertidal species were the algae, Hormosira banksia and Capreolia implexa, the filter-feeding serpulid worm, Galeolaria caespitosa, and the (intertidal or shallow subtidal) filter-feeding mussel, Mytilus galloprovincialis. In total, 27 sites around the perimeter of the bay were monitored (Fig. 1). Seasonal changes in δ15N were also measured for these four species at 15 sites on the west of the bay (Table 1C).
The offshore species Botryocladia and Mytilus were deployed on the same 42 moorings. Moorings were located throughout the bay and 15 were deployed 50 m from channel markers where Mytilus was also sampled in situ (Fig. 1). Four moorings, two in Corio Bay and two in the east of the bay, were lost.
Offshore moorings consisted of rope held on the seabed with a steel weight connected to a 200-mm diameter polystyrene float 1–1.5 m below the sea surface and a small surface buoy. Botryocladia and Mytilus were attached 0.5–1.0 m below the subsurface buoy. At each site, Botryocladia was deployed with two different methods. Botryocladia stems were inserted into 30 cm lengths of surgical rubber tubing and held there using small cable ties and it was also placed in an open-ended plastic cylinder enclosed by a mesh bag held tight by a cable tie (Parry 2013). Samples obtained from both deployment methods consisted of 4–12 newly grown (pink, shiny, clean and distal) vesicles that were dissected from each plant.
Mytilus was obtained from a mussel farm at Pinnace Channel near the open-ocean entrance to the Bay (Fig. 1) and 20 were deployed in mesh oyster bags on each mooring.
Following collection, Capreolia was shaken in seawater to remove as much sand as possible, then any epiphytes and any substrate still attached to its holdfasts were carefully removed under a dissecting microscope. Galeolaria and Mytilus were dissected in the laboratory with fine scissors. At each site, opercular adductor muscles and feeding crowns were removed from 30 Galeolaria and a composite sample of each tissue was sampled and analysed. Similarly, at each site the posterior adductor muscle and a sample of gill tissue (approximately 1 cm × 1 cm) was dissected from five Mytilus individuals and a composite sample of each tissue was analysed. At each site, a sample of 10 penultimate Hormosira vesicles, with smaller newly grown distal vesicles attached, were collected. Two samples were analysed from each site. One consisted of old growth in the 10 larger (5–10 mm diameter) penultimate vesicles and the other consisted of new growth from all the attached (<5 mm diameter) distal vesicles, typically 15–20 small vesicles per sample.
All samples for δ15N and δ13C analysis were dried at 60°C for 24–48 h, then ground in a mortar and pestle. Values of δ15N and δ13C for algae and invertebrates were measured at the Water Studies Centre, Monash University.
Transplant experiments
Transplant experiments were conducted to determine the period over which Capreolia, Hormosira, Galeolaria and Mytilus integrate the 15N signal by transferring them to higher-background 15N sites. Changes in their δ15N were monitored weekly initially, then at longer intervals, for 4–5 months. Between 9 and 12 June 2012, all four species were transplanted from areas of low 15N (Mount Martha and Pinnace Channel) to areas of high 15N (Point Cook and Point Wilson). The latter sites were the closest intertidal reefs north and south of the WTP. In addition, Hormosira was transplanted to Williamstown (slightly north of Point Cook) because there was no in situ Hormosira at Point Cook, so conditions there may not have been suitable for it. Mytilus was transplanted from a mussel farm at Pinnace Channel and deployed on short 1-m moorings in water 1–1.5 m deep. Other taxa were transplanted from Mount Martha on rocks that were placed adjacent to the same taxa as those growing in situ, except where there was no in situ Hormosira at Point Cook.
Turnover of isotopes in tissue is usually approximated by an exponential relationship (McIntyre and Flecker 2006), as adopted here for transplanted Galeolaria and Mytilus. These exponential curves are of the form y = a+bekt, where a, b and k are constants and t = time. The half-life of tissue turnover is given by T1/2 = loge2/k, where e is the base for natural logarithms (Gustafson et al. 2007; Ankjærø et al. 2012). Exponential curves were not fitted to describe changes in δ15N of the algae Capreolia and Hormosira because most change in these species occurred in the week after their transplantation. For Galeolaria, changes after 3 months no longer fitted an exponential curve; hence, the curve was fitted excluding the last two sampling dates (Parry 2013).
Application of Bubbles NPZ Model
The three-dimensional nutrient–phytoplankton–zooplankton (NPZ) model Bubbles has been shown to provide close predictions of nutrients and planktonic productivity (Black et al. 2016; Jenkins and Black 2019, 2021). When calibrated against field data in Port Phillip Bay, the model predicted the concentration of the 12 most abundant phytoplankton, down to individual species and total diatoms and flagellates.
Most recently, Bubbles was calibrated over a 10-year period from 2010 to 2019 inclusive (Black et al. 2022). Calibration compared the model to monthly measurements from the EPA (Victoria) at six sites that encompass the main hydrodynamic and biological zones around Port Phillip Bay, from the lower currents of Corio Bay to the higher nutrient loads near WTP, the Yarra River, and the ocean-influenced Sands region at Dromana. The 10-year period experienced a range of wet and dry years. The model simulations are annual, starting from 1 July of each year. The model uses a cold start where key variables such as the initial N values are set from data at six sites interpolated onto all model cells. Consequently, the first 1–2 weeks of the simulation are still coming into balance with the actual baywide conditions, so the initial 2 weeks of model runs were excluded from the analyses in this paper.
The model was checked against 12 individual species of phytoplankton, total diatoms and total flagellates, nutrient concentrations, ratio of N species, seabed N and Si fluxes/concentrations, temperature, salinity and Chl-a for a total of 22 different parameters. The model output is written to a stand-alone file at 1 hourly intervals over the 10-year period. In this paper, the required data were extracted and analysed for the period of the 15N experiments.
Model Bubbles uses output from a three-dimensional, stratified ocean/atmosphere hydrodynamic model to specify the currents for advection and diffusion. Bubbles considers the N cycle via growth and decay of phytoplankton and zooplankton, immediate remineralisation, seabed denitrification and losses to the atmosphere.
The model was used to:
Estimate the footprint of WTP-sourced DIN, because direct measurements of DIN during the study were available only on three potentially unrepresentative days.
Predict the distribution of phytoplankton that takes up N sourced from the WTP to compare with δ15N of mussels that feed on this phytoplankton.
Compare the measured δ15N footprints of the WTP with the DIN and phytoplankton footprints of the WTP predicted by the model. Some differences between the model and δ15N measurements were expected where isotope fractionation occurred during uptake of N or seabed denitrification, because these were not modelled.
Results
Nutrient measurements
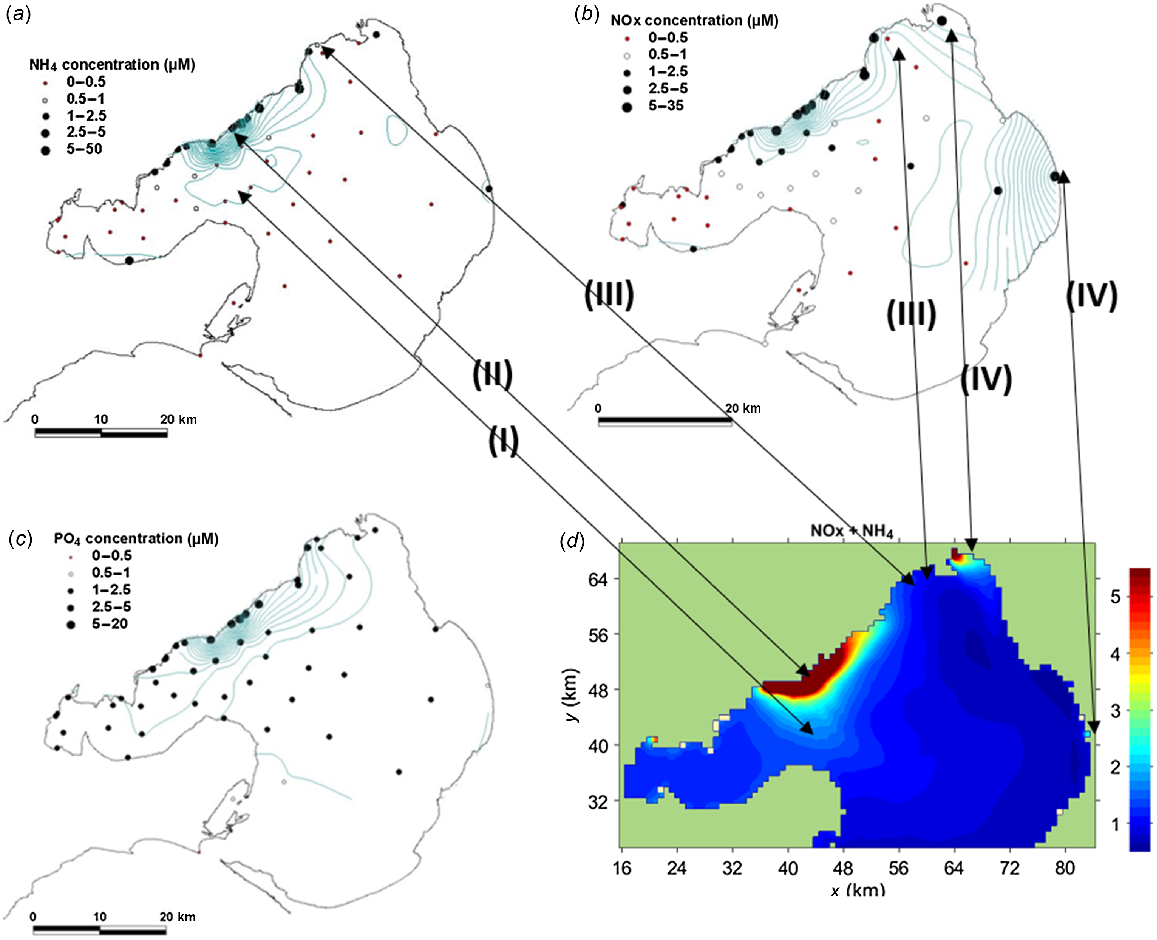
Offshore water sampling was undertaken three times between July and September 2012. When combined with simultaneous intertidal sampling, these showed that NH4+, NOx and PO4−3 concentrations were high along the north-western coast adjacent to and north of the WTP. NOx was also high near the Patterson and Yarra rivers (Fig. 2), whereas the WTP was the dominant source of DIN. Concentrations of all nutrients declined offshore from the WTP, but NH4+ and NOx declined more sharply than did PO4−3 (Fig. 2).
Mean nutrient concentrations based on onshore (N = 8) and offshore (N = 3) measurements between June and September 2012 for (a) NH4+, (b) NOx and (c) PO4−3. (d) Output from Bubbles model for NH4+ + NOx (μM) in the period 14 July 2012 to 4 September 2012. The arrows show the key similarities, namely (I) bulge in plume towards Bellarine Peninsula, (II) high concentration around WTP, (III) low concentrations to the west of the Yarra River near Altona, (IV) Yarra River and Patterson River plumes.
Nutrient concentrations at the 10 intertidal sites showed the anticipated high values north of the WTP (Sites 14, 17, 18 and 20, Table 3, Fig. 3c). A secondary DIN peak occurred on the southern side of the Geelong Arm at Site 6 (Fig. 3c).
| Site | Site code | N | Total DIN (μM) | NOx (μM) | NH4 (μM) | PO4 (μM) | |||||
|---|---|---|---|---|---|---|---|---|---|---|---|
| Mean | s.e. | Mean | s.e. | Mean | s.e. | Mean | s.e. | ||||
| Point Lonsdale | 1 | 8 | 0.95 | 0.16 | 0.78 | 0.16 | 0.17 | 0.05 | 0.27 | 0.01 | |
| Portarlington | 5 | 8 | 0.41 | 0.10 | 0.23 | 0.06 | 0.18 | 0.05 | 1.65 | 0.09 | |
| Avila Road | 6 | 8 | 4.43 | 2.62 | 1.01 | 0.26 | 3.42 | 2.41 | 1.33 | 0.22 | |
| Eastern Beach | 7 | 8 | 0.51 | 0.14 | 0.21 | 0.05 | 0.30 | 0.12 | 1.76 | 0.04 | |
| Pivot | 8 | 8 | 1.76 | 0.57 | 1.33 | 0.53 | 0.44 | 0.10 | 2.00 | 0.08 | |
| Point Wilson quarry | 12 | 8 | 0.61 | 0.29 | 0.33 | 0.18 | 0.29 | 0.12 | 1.80 | 0.11 | |
| Kirk Point | 14 | 8 | 9.60 | 4.13 | 3.79 | 1.85 | 5.80 | 2.77 | 5.51 | 0.88 | |
| Point Cook | 17 | 8 | 3.63 | 1.11 | 2.07 | 0.99 | 1.56 | 0.28 | 2.66 | 0.12 | |
| Altona pier | 18 | 8 | 1.65 | 0.43 | 0.86 | 0.30 | 0.79 | 0.17 | 1.92 | 0.16 | |
| Williamstown | 20 | 8 | 1.41 | 0.30 | 0.92 | 0.29 | 0.49 | 0.03 | 1.79 | 0.07 | |
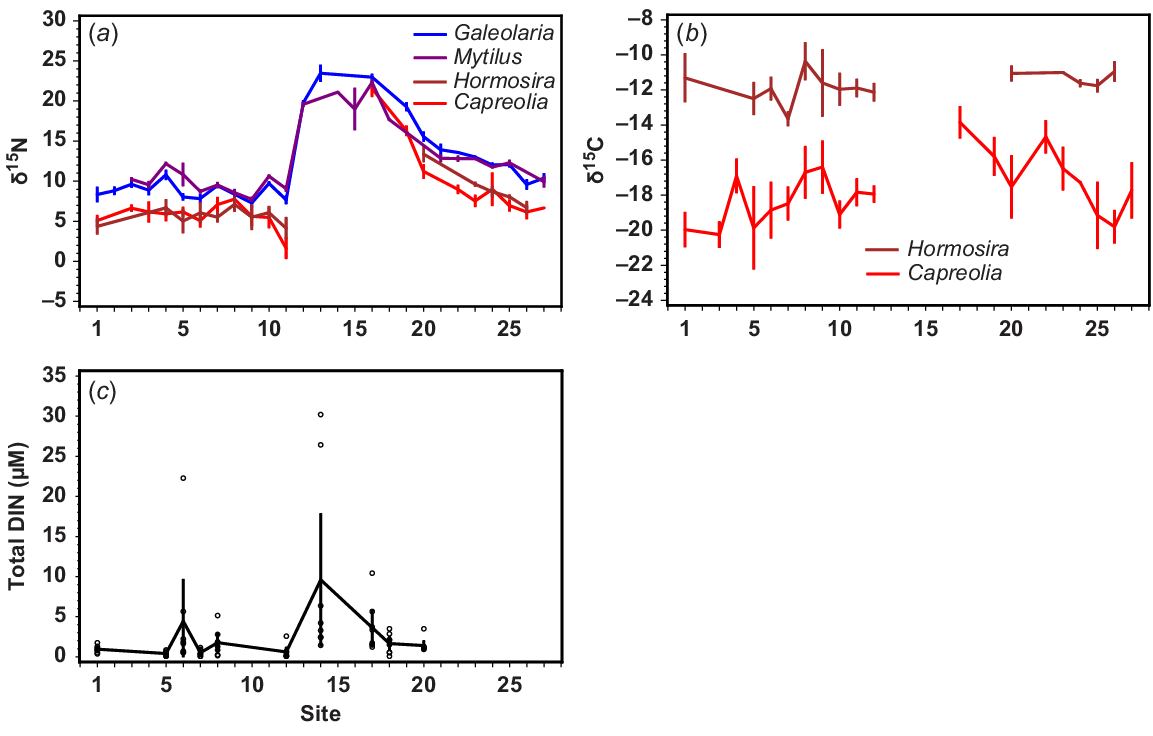
Spatial differences at Sites 1–27 (see Fig. 1) in (a) δ15N of four intertidal species growing in situ, (b) δ13C of two intertidal algae growing in situ, and (c) DIN (NH4 + NOx) (μM), on the basis of measurements between June and September 2012. All error bars are standard errors.
As a validation of the numerical model, Fig. 2d shows DIN (NOx + NH4+) averaged over the experimental period from 14 July to 4 September 2012. DIN was measured on three occasions, always during calm conditions, when the wind was offshore from the north-western quadrant, whereas the model averages show all conditions at 1-hourly intervals over a 6-week period, when wind and plume dynamics differed widely (Fig. 4). Extreme plume fluctuations expose monitored species to WTP effluent where N enriched in 15N will be taken up, but they do not dominate the 2-month mean. Both the patterns and magnitudes in the model (Fig. 2d) are very similar to the NH4+ and NOx measurements (Fig. 2a, b). Key features include (I) high concentrations near the shoreline around the WTP outfalls; (II) bulge to the south-east towards Bellarine Peninsula (as seen in the NH4+ measurements); (III) low concentrations between Altona and the Yarra River; and (IV) plumes associated with the Yarra and Patterson rivers.

Differences in δ15N and δ13C owing to season, tissue type and deployment method
Temporal differences in δ15N were small in all species compared with spatial differences, and showed no clear seasonal pattern, except that δ15N for Galeolaria was consistently 0.5–1.5‰ lower at all sites in March 2012 (Supplementary Fig. S1). Similarly, differences in δ15N and δ13C between new and old growth of Hormosira, and between δ15N from different tissues of Galeolaria and Mytilus were small compared with spatial differences, and all showed very similar spatial patterns for in situ specimens (Fig. S2) and similar temporal patterns for transplanted specimens (Fig. S3). Notably, muscle tissue from transplanted Galeolaria and Mytilus adopted the δ15N of their new site more slowly than did their crowns and gills (Fig. S3). In all subsequent analyses, at each site measurements from the three main sampling times (March 2012, June 2012 and September 2012), new and old growth of Hormosira, and both tissue types for Galeolaria and Mytilus, were averaged.
Botryocladia had more epiphytes when attached to moorings by surgical tubing rather than in (more shaded) plastic cylinders (Parry 2013). The value of δ15N of Botryocladia was slightly higher in tubes than in plastic cylinders (Fig. S4). Because both replicates of Botryocladia in tubes were lost from some moorings, mean δ15N of Botryocladia at each site was estimated using all replicates (tubes and cylinders), after making a small correction for differences in δ15N caused by different deployment techniques, by using the equation shown in Fig. S4. There was no significant difference in δ13C between Botryocladia deployed in tubes and those in cylinders.
Spatial distribution of δ15N and δ13C in biota
For the intertidal species, there were substantial and highly correlated spatial differences in δ15N of Capreolia, Hormosira, Galeolaria and Mytilus. Low values were found for all species south and west of the WTP (Sites 1–12, Fig. 3a), whereas very high values occurred adjacent to and north of the WTP (Sites 13–17, Fig. 3a) and these gradually diminished clockwise around the bay (Sites 18–27, Fig. 3a). However, δ15N values for all species were higher along the eastern coast than in the Geelong Arm.
Similar spatial differences among δ15N signatures of filter feeders, Galeolaria and Mytilus were shown in all seasons, and although spatial differences in δ15N signatures in the macroalgae Capreolia and Hormosira were also similar, they were partially masked by greater temporal variation (Fig. S1). At Site 1, distant from WTP discharges, δ15N signatures of Capreolia and Hormosira (range 2.5–6.1‰) were similar to that of NO3− in oxic deep-ocean water (3–6‰, mean 4.8‰, Montoya 2007).
In the Geelong Arm (Sites 5–12, Fig. 1), differences in δ15N of Galeolaria and Mytilus were evident at a small spatial scale. Values were higher at Sites 5 and 11 than at sites immediately adjacent to them (Fig. 3a). The lowest δ15N values for Capreolia and Hormosira occurred at Site 12 (Point Wilson quarry) (mean δ15N = 1.6‰ and 4.1‰, respectively, Fig. 3a), where the highest within-site variation also occurred (Fig. S1).
There was minimal difference in δ15N between in situ filter-feeders Galeolaria and Mytilus (0.34 ± 0.23‰ s.e.) and between the in situ algae Capreolia and Hormosira (0.37‰ ± 0.30‰ s.e.) across all sites at which they co-occurred. The mean difference in δ15N between co-occurring plants and filter-feeders was 3.2–3.8‰.
Spatial differences in δ13C (Fig. 3b) were similar to those seen in δ15N (Fig. 3a), except that there was more variation that was unrelated to its proximity to the WTP. For example, high δ13C values for Capreolia occurred not only near the WTP, but also at Sites 4, 22 and 23 far from the WTP. The value of δ13C of Hormosira was much higher than that for Capreolia, and showed minimal spatial variation, but this species does not occur between Sites 12 and 20, where DIN is high. The value of δ13C of Capreolia was highest at Point Cook (Site 17, Fig. 3b), the closest site north of the WTP where it occurred.
At the offshore sites, the general pattern in Fig. 4a–c is a broad 10–15 km wide zone off the WTP of high DIN, high δ15N and δ13C for Botryocladia and high δ15N for Mytilus. This zone extends north-west to the Yarra River, whereas its width and magnitude both reduce northward. The zone extends into the Geelong Arm immediately south of the WTP but does not usually extend west of Point Wilson. Some notable differences among patterns shown by DIN, δ15N and δ13C include the following:
DIN concentrations had a smaller footprint than did δ15N for Botryocladia and Mytilus, on the basis of a comparison of Figs 2 and 5, which share the same sampling sites.
δ15N values for Botryocladia declined progressively offshore, but high values nearest the outfalls may not reflect the very high DIN concentrations measured there. For example, the mean δ15N measured in the 145W discharge was 24.3‰ (Table 2), but δ15N of the closest Botryocladia, deployed 500 m away, was 18.5‰.
δ15N values for Mytilus showed even less variation across the width of the plume than did those for Botryocladia.
Modelled distributions of DIN showed spatial patterns similar to those of δ15N of Botryocladia and modelled flagellate distributions mirrored δ15N of phytoplankton consuming Mytilus, except possibly in Hobsons Bay.
Two adjacent sites offshore from the north-east of the Bellarine Peninsula had high and low values for δ13C for Botryocladia that were unrelated to their proximity to the WTP.
The five sites with the lowest δ15N of Botryocladia and Mytilus were in Swan Bay, three sites in Corio Bay and along the northern coastline between Corio Bay and WTP (Figs 1b, 5a, c, d).
Spatial variation during September 2012 in species deployed on offshore moorings between June and September 2012. (a) δ15N in Botryocladia, (b) δ13C in Botryocladia (c) δ15N in Mytilus and (d) collected in situ on pylons δ15N in Mytilus in September 2012.
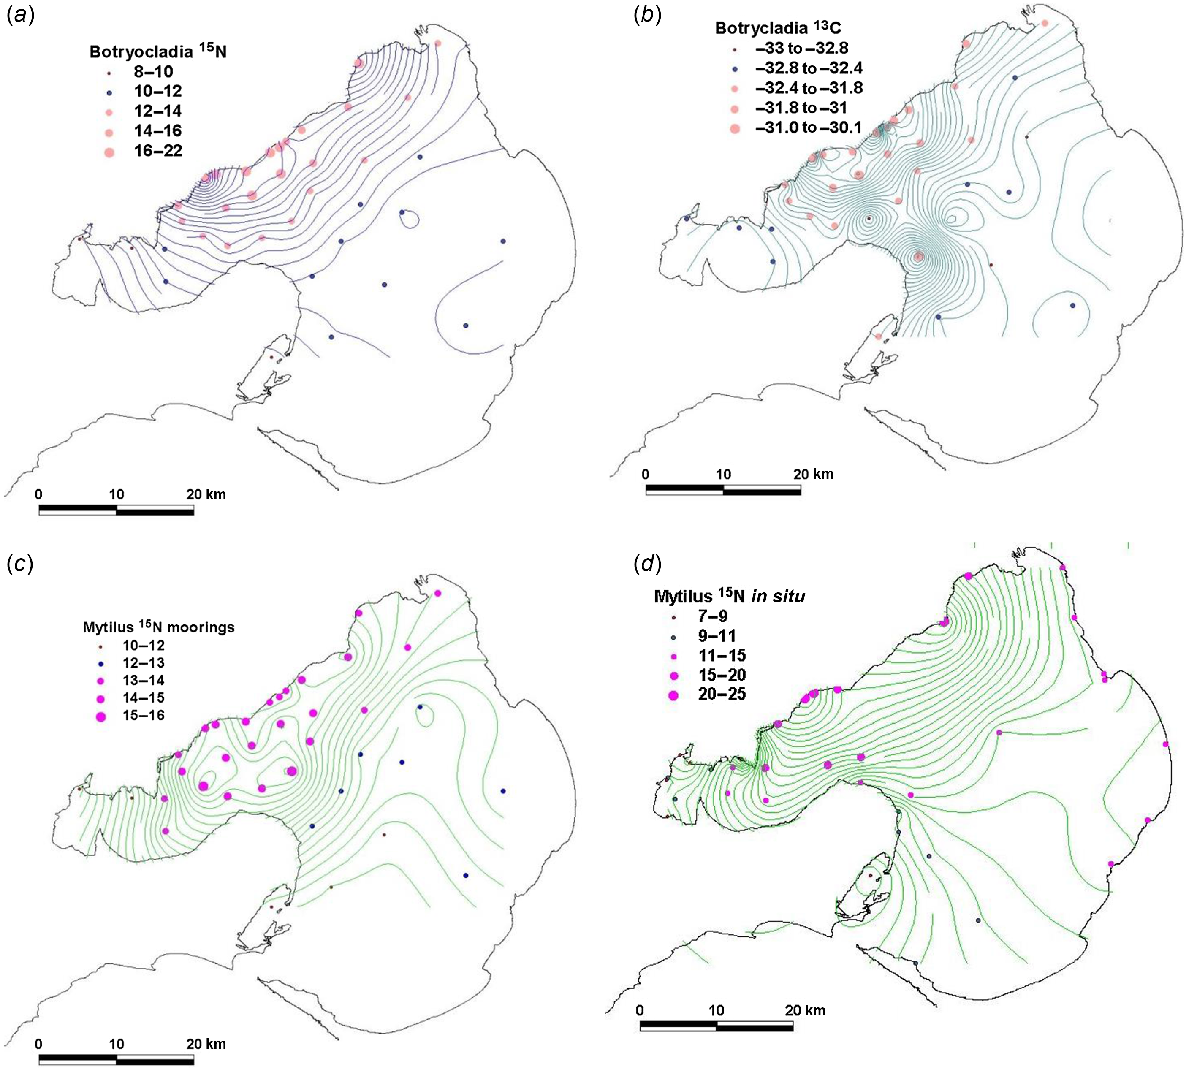
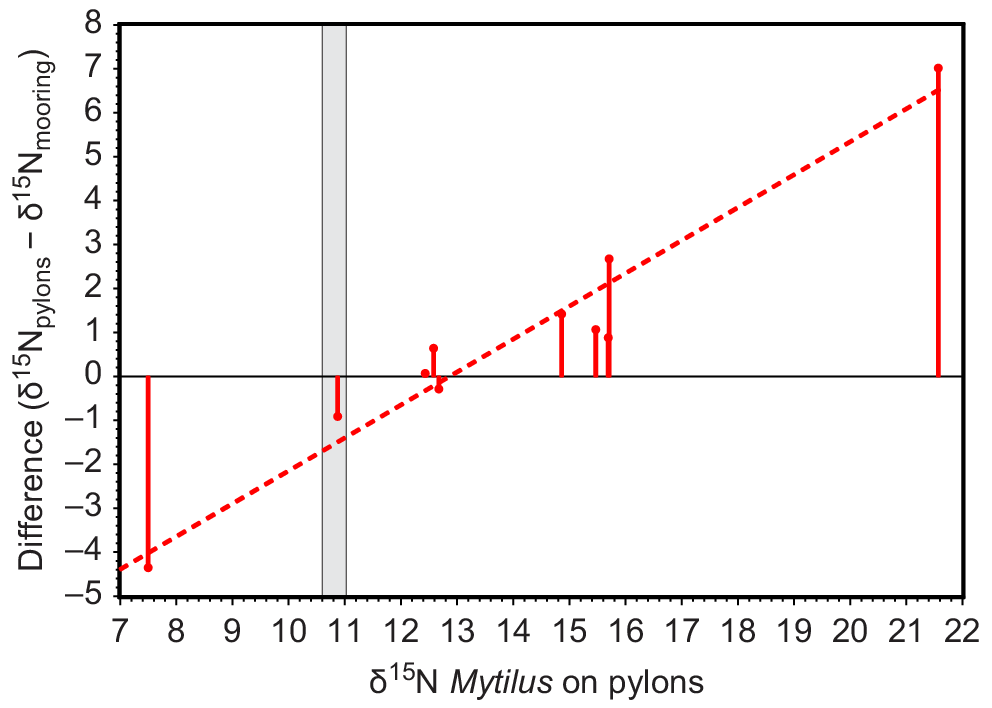
The δ15N of Mytilus collected in situ on pylons showed a spatial pattern similar to that of Mytilus deployed on moorings 50 m away (Fig. 4c, d). The values of δ15N of Mytilus on 2-month deployments on moorings converged towards values of δ15N of Mytilus that had lived on adjacent pylons for their lifetime (Fig. 6).
Plot of (δ15N of Mytilus growing in situ on pylons − δ15N of Mytilus deployed on moorings 50 m away) against δ15N of Mytilus growing in situ on pylons. Measurements were obtained in September 2012. The grey area is δ15N of Mytilus on deployment, based on measurements in June and September 2012 at Pinnace Channel, where all deployed mussels were collected.
Although the WTP was the major influence on spatial patterns of δ15N in Port Phillip Bay, there were several minor influences. The low δ15N of the Werribee River (δ15N of DIN = 13‰), which discharges within the WTP zone (δ15N of DIN at 15 East outlet = 17‰), appeared to cause a region of lower δ15N adjacent to the coast for both Botryocladia and Mytilus north and south of the Werribee River (Fig. 5a, c). The footprint of the small Altona STP (<100 kg N day) probably declined sharply with distance from the outlet, but its apparent footprint shown by contours in Fig. 5a was exaggerated by a lack of nearby sampling stations.
Transplant experiments
The values of δ15N of Capreolia, Hormosira, Galeolaria and Mytilus transplanted to Point Cook and Williamstown increased, but biota transplanted to Point Wilson quarry did not because, despite its proximity to the WTP, δ15N values of in situ biota there were similar to those at Mount Martha and Pinnace Channel (Figs 1a, 6).
At the transplant sites, δ15N of control/in situ Galeolaria and Mytilus showed little change during the 3–5 month transplant experiment, whereas δ15N of control/in situ algae Capreolia and Hormosira varied (Fig. 7).
Comparison of changes in δ15N of in situ and transplanted species between June and December 2012 (months are indicated by their first letters). (a) Capreolia transplanted from Mount Martha to Point Cook and Point Wilson, (b) Galeolaria transplanted from Mount Martha to Point Cook and Point Wilson, (c) Hormosira transplanted from Mount Martha to Point Cook and Point Wilson, (d) Hormosira transplanted from Mount Martha to Point Cook and Williamstown, (e) Mytilus transplanted from Pinnace Channel to Point Cook and Point Wilson.
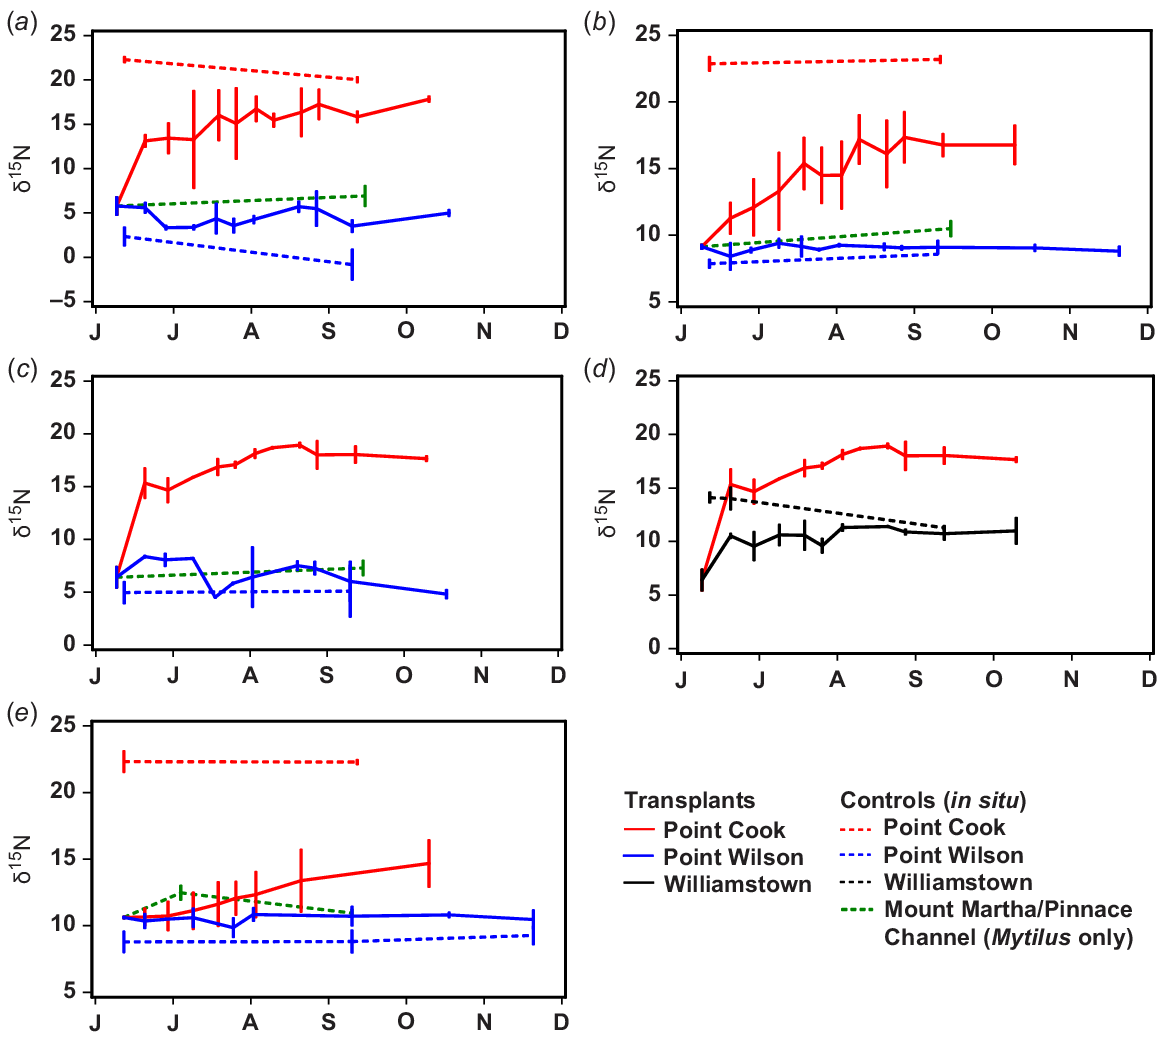
Following transplantation to Point Cook, the rate that δ15N increased varied greatly among species. The rate of change for Capreolia and Hormosira was much greater in the week following their transplantation than subsequently (Fig. 7). The value of δ15N of Capreolia increased for ~6–12 weeks when an asymptote appeared to be reached (Fig. 7), but there was a temporal trend in δ15N of in situ/control Capreolia, making it difficult to determine precisely when/if the transplanted and in situ measurements converged (Fig. 7). The value of δ15N of Hormosira transplanted to Point Cook and Williamstown approached asymptotes after ~10 weeks, when δ15N of Hormosira transplanted to Williamstown also converged with in situ values, although there was substantial temporal variation in the latter (Fig. 7).
Values of δ15N of Galeolaria transplanted to Point Cook increased slowly for ~2.5 months, when an asymptote may have been reached, but at a lower value than for in situ samples (Fig. 7). An exponential curve describing changes in δ15N of Galeolaria for the first 2.5 months is as follows:
Values of δ15N of Mytilus transplanted to Point Cook increased slowly for the 4 month duration of the transplant experiment (Fig. 7). At this time, δ15N values of transplanted Mytilus were still much lower than δ15N values of in situ Mytilus (Fig. 7). An exponential curve describing changes in δ15N of Mytilus for the 4 months of transplantation is as follows:
Discussion
The nutrient footprint of the WTP
DIN measurements, modelled DIN plumes and stable isotope ratios in Botryocladia and Mytilus all broadly indicate that the footprint of WTP-sourced N extends 10–15 km offshore from the WTP along the north-western shoreline, extending into the Geelong Arm immediately south of the WTP, but does not usually affect the Geelong Arm west of Point Wilson or the eastern two-thirds of Port Phillip Bay. The footprint of δ15N of Mytilus extended ~10–15 km offshore, with the extension being slightly larger than that of Botryocladia (~10 km), because Mytilus consumes phytoplankton that disperse after taking up WTP-sourced N.
Measured and modelled DIN concentrations and δ15N of Botryocladia showed similar spatial patterns (compare Figs 2 and 4a). The pattern of δ15N of Botryocladia should reflect that of the N-enriched plume of the WTP, because it obtains its N from the water column directly. The model shows that the WTP plume is very variable and highly dependent on wind conditions (Fig. 4). Although short-lived events do not dominate the 2-month mean, fluctuations in the plume still expose monitored species to WTP effluent and allow 15N to be taken up over a broad region that will vary with seasonal winds. The modelled DIN plume periodically impinges on the coast of the northern Bellarine Peninsula (Fig. 4), explaining the high δ15N values of Galeolaria and Mytilus at Site 5 (Fig. 3a).
There were important deviations from the broadly similar patterns shown by DIN, δ15N and δ13C. Several of these deviations are likely to be due to fractionation on uptake of N. Fractionation results from biological processes preferentially consuming the lighter N isotope (14N), resulting in the residual reactant pool becoming enriched in the heavier isotope (15N) (Kendall et al. 2007; Montoya 2008).
Typically, fractionation causes δ15N to increase by 3–4‰ with each trophic level (Peterson and Fry 1987; Post 2002; Jennings and Warr 2003), being similar to the mean difference in δ15N between co-occurring intertidal plants and filter-feeders (3.2–3.8‰).
Fractionation owing to mineralisation of organic matter is consistently near zero (Brandes and Devol 1997; Montoya 2008), whereas fractionation by nitrifying bacteria in sediments typically causes isotope effects of 15–25‰, and by denitrifying bacteria of 20–30‰ (Montoya 2008). However, the isotope effect across the sediment water interface (εsed) is often near zero, because nitrification and denitrification are limited by the available N (Brandes and Devol 1997; Lehmann et al. 2007; Devol 2015; Montoya 2008; Glibert et al. 2019). In addition, nitrification and denitrification have compensatory effects on εsed because the light NO3 from nitrification becomes the input to denitrification that creates heavier NO3 and light N2 (Devol 2008). The value of εsed is closest to zero at the most oxygenated sites with the minimal reactive organic matter (Lehmann et al. 2004; Alkhatib et al. 2012), conditions similar to those found in most sediments in Port Phillip Bay, whereas εsed is most likely to be greater than 0‰ where denitrification efficiency is low and surface sediments are poorly oxygenated (Lehmann et al. 2004; Granger et al. 2011; Alkhatib et al. 2012; Kessler et al. 2014).
Fractionation owing to uptake of N by algae is often dependent on DIN concentration (Swart et al. 2014). 15N is detected by Botryocladia with great sensitivity near the edge of the plume, but nearshore where DIN is high, δ15N values may be damped by preferential uptake of 14N. The very high concentrations of DIN and very high δ15N values in WTP discharges were not mirrored by very high δ15N values in Botryocladia nearest the WTP. This difference is likely to be due to fractionation on N uptake. Botryocladia, like other plants (Dudley et al. 2010; Swart et al. 2014; Orlandi et al. 2017; Pruell et al. 2020), probably takes up 14N preferentially at high DIN concentrations, whereas at low DIN concentrations near the edge of the plume, all N is taken up and there is no fractionation. Swart et al. (2014) found that fractionation of nitrate by macroalgae ceased when its concentration was ~2 μM.
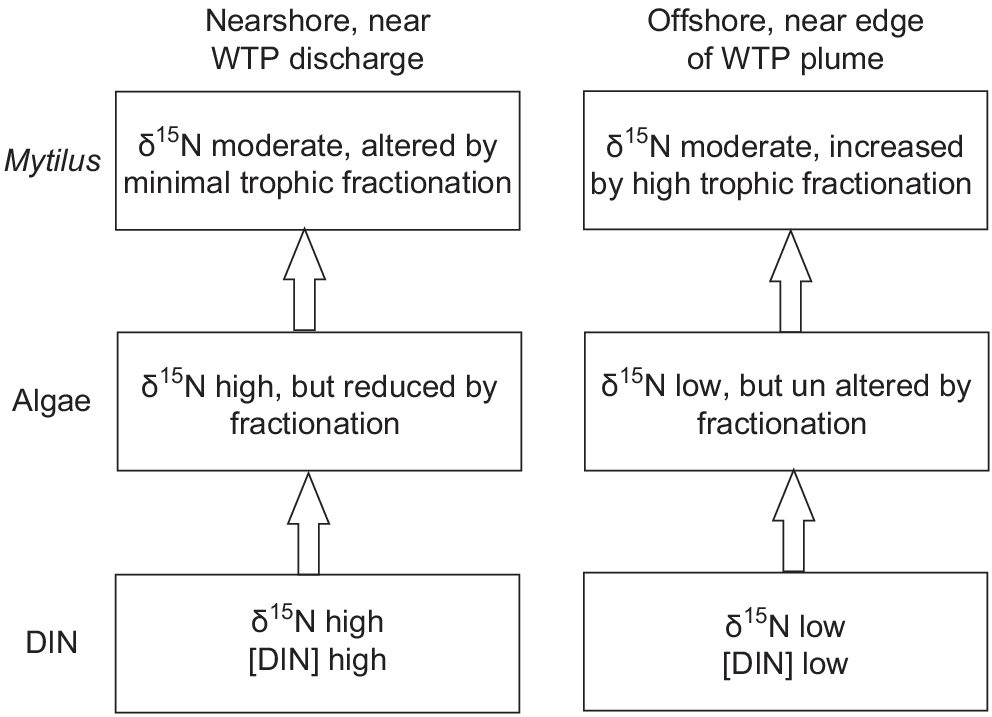
Minimal variation shown in δ15N of Mytilus across the width of the WTP plume is also probably the result of fractionation. In contrast to fractionation shown by algae, filter-feeders (Daphnia) fed algae with high N content showed near-zero fractionation, whereas those fed algae with low N showed fractionation of ~6‰, possibly owing to greater excretion of 14N when N intake is lower (Adams and Sterner 2000). Similarly, an experimental study found that phytoplankton continuously cultured in high DIN concentrations showed a depletion of δ15N of up to 9‰ compared with algae cultured in low DIN, but δ15N of mussels feeding on phytoplankton from high DIN treatments had δ15N values only 2‰ lower than those on feeding on low DIN phytoplankton (Pruell et al. 2020). A conceptual model of fractionation near the WTP, on the basis of Adams and Sterner (2000), across two trophic levels in areas of high and low DIN, is shown in Fig. 8.
Conceptual diagram showing fractionation processes at two trophic levels near (high DIN) and distant from the WTP (low DIN), based on Adams and Sterner (2000).
The Bubbles model incorporates N utilisation, recycling and eventual losses to reproduce the DIN plume. For example, the salinity averaged over the same 3 months shows no significant correspondence with the distribution of NH4+ or flagellates (compare Figs 9 and S5). Salinity is a conservative tracer, not subject to the complexities of the N cycle. Similarly, PO43− shows a much more even distribution than does NH4+ (Fig. 2) because P is abundant in the bay, and studies have shown that N, rather than P, is the limiting nutrient (Harris et al. 1996) for flagellates.
Outputs from the Bubbles model (Jenkins and Black 2021) for the period 14 July to 3 September 2012, when Botryocladia and Mytilus were deployed in the bay, showing (a) NOx + NH4+ concentration (μM) in Port Phillip Bay, and (b) average flagellate concentration (individuals.L−1).
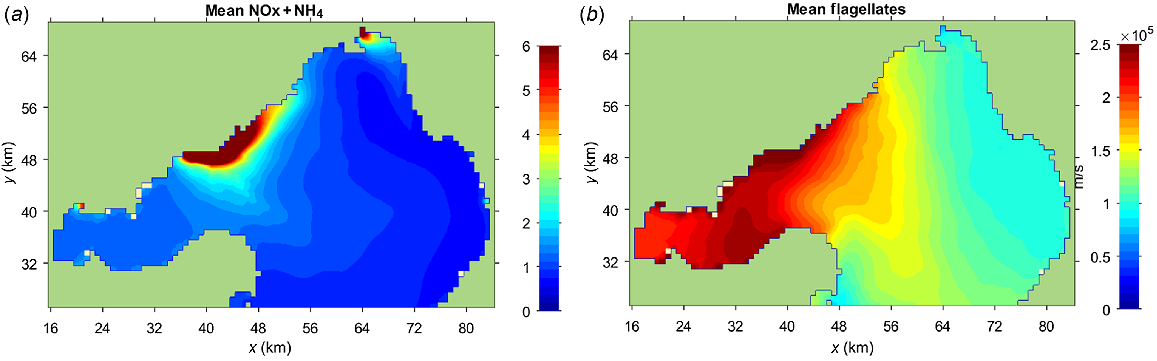
The Bubbles model of DIN concentrations (Figs 2d, 9a) closely predicts the patterns shown by δ15N in Botryocladia (Fig. 4a), and the predicted flagellate distribution (Fig. 9b) closely mirrors the patterns shown by δ15N in the phytoplankton consuming Mytilus (Fig. 4c). The latter has the larger footprint because phytoplankton disperse after consuming WTP-sourced N.
The values of δ15N in Hobsons Bay (δ15N of Botryocladia ~12.0) were substantially higher than the δ15N of the high volume of NOx discharged to this region by the Yarra River (δ15N = 8.0, Table 2), and higher than δ15N values of Capreolia at Intertidal sites 21 (δ15N = 9.0) and 22 (δ15N = 7.5), which are more influenced by the Yarra River plume, which follows the eastern shoreline. The elevated δ15N values in Hobsons Bay may be due to infrequent excursions of WTP-sourced N, but could also be influenced by fractionation in the sediments. Hobsons Bay has characteristics typical of other areas with εsed greater than zero, including low denitrification efficiency (28%, Berelson et al. 1998), high organic load and poorly oxygenated surface sediments (Lehmann et al. 2004; Alkhatib et al. 2012).
Values of δ13C of Botryocladia deployed in the bay showed broadly similar, but more complex, spatial patterns than those of δ15N. Plants discriminate against 13CO2 during photosynthesis, but the degree of discrimination varies among species using different photosynthetic pathways (e.g. C3, C4 and CAM plants). Macroalgae with δ13C smaller than −30‰ (such as Botryocladia) typically occur in subtidal or shaded intertidal habitats where they are often light rather than carbon limited, and rely on CO2 diffusion for carbon uptake, a process that actively discriminates against 13C (Marconi et al. 2011). Proximity to the WTP was expected to reduce the likelihood of nutrient limitation and increase the likelihood of carbon limitation, which in turn will decrease the discrimination against 13C, and so increase δ13C. The values of δ13C of Botryocladia offshore from the north-eastern end of the Bellarine Peninsula were inconsistent with the broad pattern shown by δ15N and with proximity to the WTP. These δ13C outliers probably resulted from interactions among carbon, nutrient and light limitation. Light available to Botryocladia was probably affected by shading from nutrient-dependent epiphytes, and those along the shipping channel by turbid plumes from passing ships. The complexity of the δ13C pattern is consistent with previous studies that have shown δ15N to provide a more reliable estimate of nutrient/sewage influence than does δ13C (Roelke and Cifuentes 1997; Gaston et al. 2004; Dudley et al. 2010).
Aquatic macrophytes with δ13C between −10 and −30‰ (such as Capreolia and Hormosira) typically inhabit intertidal zones and use HCO3− as an inorganic carbon source, and usually have a carbon-concentrating mechanism (Marconi et al. 2011). Whereas δ15N values for intertidal algae and filter-feeders were all spatially correlated, some of the spatial variation in δ13C in Capreolia (e.g. high values at Sites 4, 22 and 23, Fig. 3) appeared unrelated to the likely exposure to the WTP plume. However, the Capreolia nearest to the WTP, at Point Cook (Site 17, Fig. 3), had the highest δ13C value and this was similar to the high δ13C values measured adjacent to another treated-sewage discharge (Parry 2021).
Regions of low 15N, N-fixation by seagrass
Nitrogen fixation by sulfate-reducing bacteria associated with seagrass roots is a major source of light N (δ15N of ~0) and often provides for a significant proportion of the nitrogen needs of seagrasses (Welsh 2000), including Zostera muelleri (Udy and Dennison 1997). In this study, the lowest δ15N signatures of Botryocladia and Mytilus were recorded in Corio Bay and Swan Bay, where near-zero δ15N signatures were also recorded for seagrasses (Cook et al. 2015; Jenkins et al. 2015; Hirst et al. 2016; Russell et al. 2018). There have been several interpretations of the low values of δ15N of seagrass at particular sites in Port Phillip Bay. Cook et al. (2015) suggested that the small difference between δ15N of Ulva and seagrass (Zostera muelleri) at the same sites in Port Phillip Bay was due to isotopic fractionation in the sediment rather than N-fixation, and their direct measurements suggested that N-fixation was only a minor (~15%) source of N in seagrass. Hirst et al. (2016) suggested that low δ15N of seagrass in Swan Bay may be due to either N-fixation or recycling within the sediment. Subsequently, Russell et al. (2018) found that δ15N of pore water was linearly related to that of seagrass, and where δ15N of seagrass was near zero (Corio Bay and Swan Bay), so was δ15N of NH4+ in pore water.
The low δ15N in both pore water and the water column at Corio Bay and Swan Bay suggests that the ultimate source of this nitrogen is nitrogen-fixing bacteria. The enclosed geography of these bays looks to be important in the retention of this nitrogen. Both bays have small entrances that reduce water exchange and ensure minimal export of local seagrass production. Seagrass leaves shed by storms or when rhizomes are consumed by black swans become detritus and are buried and broken down by microbes, releasing their N to pore water, which is then recycled by plants. Both bays also have limited fetch, which helps retain fine sediments, which in turn retain more NH4+ in pore water (Hirst and Jenkins 2017). The low export of seagrass production contrasts with sites on the east of Port Phillip Bay (including Blairgowrie, Rye and South Sands, Hirst and Jenkins 2017) where most seagrass production is exported, sediment is coarser with less retained organic matter, NH4+ concentrations in pore water are an order of magnitude lower and, in contrast to Swan Bay, the addition of nutrients to the sediment increases the rate of growth of seagrass (Hirst and Jenkins 2017).
The lower δ15N values found for all species in the Geelong Arm (Sites 5–12, Fig. 3a) than those on the east of Port Phillip Bay (Sites 20–27, Fig. 3a) are likely to be in part the result of seagrass contributing more light N in this region. Biota at some sites along the northern shoreline of the Geelong Arm also had unexpectedly low δ15N values, suggesting that this area also has a source of light nitrogen as well as being influenced by the plume of the WTP. The δ15N value was low at Sites 10 and 12, but higher at Site 11. The lower δ15N values that occur at some sites in the Geelong Arm may result from their proximity to geographic features that trap large amounts of seagrass wrack that release light 14N. Similar fine-scale variation in δ15N of in situ macroalgae was found to be due to decomposition of organic matter from seasonal seaweed standings (Lemesle et al. 2016).
The exceptionally low δ15N values found in all species suspended in the water column in seagrass habitats indicates that some of the N fixed by seagrass is exported to the water column. This will be greater where extensive meadows of seagrass occur (Corio Bay, Swan Bay, and Point Wilson quarry) and probably where seagrass drift accumulates because of the groyne-like geographic features. The amount of N exported to the water column as a result of nitrogen fixation from seagrass is difficult to estimate from available data, but an approximate estimate was obtained for Swan Bay, using best estimates of δ15N for water outside and within Swan Bay. The value of δ15N of water outside Swan Bay was estimated from its value at the entrance to Port Phillip Bay, estimated from the mean δ15N of Capreolia and Hormosira at Point Lonsdale [4.8 ± 0.3 (N = 8)]. The value of δ15N of water in Swan Bay was estimated from δ15N of in situ Mytilus in Swan Bay [7.5 ± 0.4 (N = 2) – 3.5 ± 0.3 (trophic fractionation) = 4.0 ± 0.7]. These values suggest that, if δ15N of N fixed by seagrass is 0, then the proportion of nitrogen in the water column fixed by seagrass is (4.8–4.0)/4.0 = 0.20, but the error range includes zero. More measurements are clearly needed, particularly of δ15N of in situ macroalgae that source their N from the water column.
Changes following transplantation
The rate of change of δ15N, when an organism is introduced into an environment with a distinctively different 15N signal, depends on tissue growth and N turnover associated with tissue maintenance. The contribution of these two processes will vary, depending on the rate of growth (Fry and Arnold 1982; Gaye-Siessegger et al. 2004; McIntyre and Flecker 2006; Ankjærø et al. 2012). The rate of change of δ15N will be slowest when there is no growth and all change is due to tissue turnover for maintenance. Where there is new growth, the newly incorporated N will increase with growth rate, because new tissue would be expected to carry primarily the 15N signature of the new environment.
The rapid increase in δ15N of Capreolia and Hormosira in the first week, and of nitrogen content in the first 3 weeks, were probably due to ‘luxury uptake’, where nutrients are placed in intracellular storage rather than used immediately for protein growth (Kilham and Hecky 1988). Subsequent increases in δ15N occurred more slowly because they were due to algal growth. The rate of change of δ15N in transplanted Galeolaria anomalously reached an asymptote well below the δ15N of in situ Galeolaria, probably because they were placed in a non-optimal micro-environment where growth slowed.
There are few measurements of tissue-stable isotope turnover rates (Dattagupta et al. 2004; McIntyre and Flecker 2006), although primary producers have higher variance in δ15N than do secondary consumers (Cabana and Rasmussen 1996; Post 2002; McIntyre and Flecker 2006). Aguiar et al. (2003) suggested that the nitrogen pool in the macroalgae Ulva turns over completely every 12–15 days. This estimate of turnover of nitrogen is much faster than those of macroalgae from this study (6–12 weeks and 10 weeks), probably for two reasons. First, Ulva is widely recognised as a species associated with areas of high nutrients and has a high rate of growth. Second, the estimate for Ulva by Aguiar et al. (2003) was an extrapolation of the rate over the first 8 days, when most nitrogen probably went to storage (‘luxury uptake’) rather than growth. Estimated turnover rates of nitrogen in Galeolaria and Mytilus (T1/2 = 90 days and 234 days respectively) appear similar to the limited data available for other species. McIntyre and Flecker (2006) reviewed available estimates of turnover rates and found half-lives (T1/2) between 156 and 784 days for krill, 69 days for Elimia (snail), 99–231 days for Littorina (snail), and very variable rates for fish (3 to >173 days), depending largely on their size and growth rate. Subsequent estimates of T1/2 for nitrogen in fast-growing Atlantic cod, in heart and white muscle, were 31–78 days (Ankjærø et al. 2012). However, Dubois et al. (2007) found much more rapid turnover rates, T1/2 = 14 days for Pacific oysters and T1/2 = 15 days for Mytilus. These latter estimates are higher than estimates for algae, and appear unrealistically high, especially as mussels only grew 38% over 90 days.
Preferred species for ongoing monitoring
Values of δ15N in all species showed similar spatial patterns around Port Phillip Bay, suggesting that all are satisfactory for monitoring sources of N with distinctive δ15N values. But the absence of intertidal reef habitat adjacent to the WTP limited the usefulness of species dependent on this habitat, especially Capreolia and Hormosira. Both Galeolaria and Mytilus can also establish on small coastal man-made structures. The absence of Hormosira on the intertidal reef at Point Cook is consistent with its low tolerance of high DIN (Parry 2021), which suggests that it is the least suitable species for monitoring δ15N of WTP-sourced N.
The suitability of different species depends on the time scale of the questions being posed, and the costs of sampling and analysis. Species and tissues with high turnover rates (e.g. algal tissues) are more responsive to short-term changes in the discharge of 15N, whereas slower-growing taxa (e.g. Galeolaria and Mytilus) and tissues with longer turnover rates (e.g. muscle, Lorrain et al. 2002) are better suited to providing a time-integrated measure of the area of influence of discharged 15N (Gartner et al. 2002; Fertig et al. 2009; Raimonet et al. 2013). The costs of collection and analysis are also important. Collection costs are lower for intertidal species than for those deployed on moorings. But the mean time taken to dissect and grind samples was generally greater for intertidal species (Capreolia 20–25 min, Hormosira 5 min, Galeolaria 35 min) than for those deployed on moorings (Botryocladia 5 min, Mytilus 14 min). Species attached to offshore moorings provide the only means of measuring δ15N in non-coastal regions and are also better suited to monitoring long-term trends from sources with a large footprint such as the WTP, because, unlike intertidal species, they are not affected by small local inputs.
Of the five species considered in this study, Mytilus appears the best species for monitoring long-term change in 15N, and for ground-truthing nutrient models. The current study deployed large mussels, but these are not ideal for detecting temporal trends or for ground-truthing models because δ15N measured at the end of their deployment is affected by their initial δ15N. Correcting for the influence of the latter requires a complex model of Mytilus growth. However, if small fast-growing Mytilus were deployed, essentially all the 15N in the Mytilus then results from new growth during the deployment period, so no correction for the starting 15N signal is required. Post-larval shrimp, which had a four-fold increase in weight, showed essentially constant isotopic values, reflecting their new diets (Fry and Arnold 1982). Similarly, Trueman et al. (2005) found that following a diet switch in Atlantic salmon, the δ15N of muscle and liver reached equilibrium with their new diet after a three-fold increase in body mass, equivalent to 8 months of growth under laboratory conditions. Commercial hatcheries in Port Phillip Bay currently produce 1 mm length mussels suitable for deployment, and when deployed on mussel farms they grow to ~5–10 mm over 2 months, when their δ15N should just reflect their exposure to 15N over the period of their deployment.
Data availability
The data that support this study will be shared upon reasonable request to the corresponding author.
Acknowledgements
Valuable comments on the manuscript were received from David Gregory and Catherine Rees (Melbourne Water) and Sam Lake. Ivan Beresa, Ross Haughton, Tony Sheehan and Lynne Knight provided field support. Lance Wiffen provided mussels from his Pinnace Channel farm. Scott Chidgey (CEE) collected a pilot sample of Botryocladia. Anne Gason provided advice on statistical analysis.
References
Adams TS, Sterner RW (2000) The effect of dietary nitrogen content on trophic level 15N enrichment. Limnology and Oceanography 45, 601-607.
| Crossref | Google Scholar |
Aguiar AB, Morgan JA, Teichberg M, Fox S, Valiela I (2003) Transplantation and isotopic evidence of the relative effects of ambient and internal nutrient supply on the growth of Ulva lactuca. Biological Bulletin (Woods Hole) 205, 250-251.
| Crossref | Google Scholar |
Alkhatib M, Lehmann MF, del Giorgio PA (2012) The nitrogen isotope effect of benthic remineralization-nitrification-denitrification coupling in an estuarine environment. Biogeosciences 9, 1633-1646.
| Crossref | Google Scholar |
Ankjærø T, Christensen JT, Gronkkær P (2012) Tissue-specific turnover rates and trophic enrichment of stable N and C isotopes in juvenile Atlantic cod Gadus morhua fed three different diets. Marine Ecology Progress Series 461, 197-209.
| Crossref | Google Scholar |
Ball D, Soto-Berelov M, Young P (2014) Historical seagrass mapping in Port Phillip Bay, Australia. Journal of Coastal Conservation 18, 257-272.
| Crossref | Google Scholar |
Berelson WM, Heggie D, Longmore A, Kilgore T, Nicholson G, Skyring G (1998) Benthic nutrient recycling in Port Phillip Bay, Australia. Estuarine, Coastal and Shelf Science 46, 917-934.
| Crossref | Google Scholar |
Black K, Hatton D, Rosenberg M (1993) Locally and externally-driven dynamics of a large semi-enclosed bay in southern Australia. Journal of Coastal Research 9, 509-538.
| Google Scholar |
Black KP, Longmore AR, Hamer PA, Lee R, Swearer SE, Jenkins GP (2016) Linking nutrient inputs, phytoplankton composition, zooplankton dynamics and the recruitment of pink snapper, Chrysophrys auratus, in a temperate bay. Estuarine, Coastal and Shelf Science 183, 150-162.
| Crossref | Google Scholar |
Brandes JA, Devol AH (1997) Isotopic fractionation of oxygen and nitrogen in coastal marine sediments. Geochimica et Cosmochimica Acta 61, 1793-1801.
| Crossref | Google Scholar |
Cabana G, Rasmussen JB (1996) Comparison of aquatic food chains using nitrogen isotopes. Proceedings of the National Academy of Sciences 93, 10844-10847.
| Crossref | Google Scholar |
Carmichael RH, Annett B, Valiela I (2004) Nitrogen loading to Pleasant Bay, Cape Cod: application of models and stable isotopes to detect incipient nutrient enrichment of estuaries. Marine Pollution Bulletin 48, 137-143.
| Crossref | Google Scholar | PubMed |
Carnell PE, Keough MJ (2014) Spatially variable synergistic effects of disturbance and additional nutrients on kelp recruitment and recovery. Ecologia 175, 409-416.
| Google Scholar |
Connolly RM, Schlacher TA, Gaston TF (2009) Stable isotope evidence for trophic subsidy of coastal benthic fisheries by river discharge plumes off small estuaries. Marine Biology Research 5, 164-171.
| Crossref | Google Scholar |
Cook PLM, Evrard V, Woodland RJ (2015) Factors controlling nitrogen fixation in temperate seagrass beds. Marine Ecology Progress Series 525, 41-51.
| Crossref | Google Scholar |
Costanzo SD, O’Donohue MJ, Dennison WC, Loneragan NR, Thomas M (2001) A new approach for detecting and mapping sewage impacts. Marine Pollution Bulletin 42, 149-156.
| Crossref | Google Scholar | PubMed |
Costanzo SD, Udy J, Longstaff B, Jones A (2005) Using nitrogen stable isotope ratios (δ15N) of macroalgae to determine the effectiveness of sewage upgrades: changes in the extent of sewage plumes over four years in Moreton Bay, Australia. Marine Pollution Bulletin 51, 212-217.
| Crossref | Google Scholar | PubMed |
Currie DR, Parry GD (1999) Changes to benthic communities over 20 years in Port Phillip Bay, Victoria, Australia. Marine Pollution Bulletin 38, 36-43.
| Crossref | Google Scholar |
Dailer ML, Knox RS, Smith JE, Napier M, Smith CM (2010) Using δ15N values in algal tissue to map locations and potential sources of anthropogenic nutrient inputs on the island of Maui, Hawai’i, USA. Marine Pollution Bulletin 60, 655-671.
| Crossref | Google Scholar | PubMed |
Dailer ML, Ramey HL, Saephan S, Smith CM (2012) Algal δ15N values detect a wastewater effluent plume in nearshore and offshore surface waters and three-dimensionally model the plume across a coral reef on Maui, Hawai‘i, USA. Marine Pollution Bulletin 64, 207-213.
| Crossref | Google Scholar | PubMed |
Dattagupta S, Bergquist DC, Szalai EB, Macko SA, Fisher CR (2004) Tissue carbon, nitrogen, and sulfur stable isotope turnover in transplanted Bathymodiolus childressi mussels: relation to growth and physiological condition. Limnology and Oceanography 49, 1144-1151.
| Crossref | Google Scholar |
deBruyn AMH, Rasmussen JB (2002) Quantifying assimilation of sewage-derived organic matter by riverine benthos. Ecological Applications 12, 511-520.
| Crossref | Google Scholar |
Devol AH (2015) Denitrification, anammox, and N2 production in marine sediments. Annual Review of Marine Science 7, 403-423.
| Crossref | Google Scholar |
Dubois S, Jean-Louis B, Bertrand B, Lefebvre S (2007) Isotope trophic-step fractionation of suspension-feeding species: implications for food partitioning in coastal ecosystems. Journal of Experimental Marine Biology and Ecology 351, 121-128.
| Crossref | Google Scholar |
Dudley BD, Barr NG, Shima JS (2010) Influence of light intensity and nutrient source on δ13C and δ15N signatures in Ulva pertusa. Aquatic Biology 9, 85-93.
| Crossref | Google Scholar |
Fertig B, Carruthers TJB, Dennison WC, Jones AB, Pantus F, Longstaff B (2009) Oyster and macroalgae bioindicators detect elevated δ15N in Maryland’s coastal bays. Estuaries and Coasts 32, 773-786.
| Crossref | Google Scholar |
Fry B, Arnold C (1982) Rapid 13C/12C turnover during growth of brown shrimp (Penaeus aztecus). Oecologia 54, 200-204.
| Crossref | Google Scholar | PubMed |
Gartner A, Lavery P, Smit AJ (2002) Use of δ15N signatures of different functional forms of macroalgae and filter-feeders to reveal temporal and spatial patterns in sewage dispersal. Marine Ecology Progress Series 235, 63-73.
| Crossref | Google Scholar |
Gaston TF, Kostoglidis A, Suthers IM (2004) The 13C, 15N and 34S signatures of a rocky reef planktivorous fish indicate different coastal discharges of sewage. Marine and Freshwater Research 55, 689-699.
| Crossref | Google Scholar |
Gaye-Siessegger J, Focken U, Muetzel S, Abel H, Becker K (2004) Feeding level and individual metabolic rate affect δ13C and δ15N values in carp: implications for food web studies. Oecologia 138, 175-183.
| Crossref | Google Scholar | PubMed |
Glibert PM, Middelburg JJ, Vander Zanden MJ (2019) Stable isotope tracers: enriching our perspectives and questions on sources, fates, rates and pathways of major elements in aquatic systems. Limnology and Oceanography 64, 950-981.
| Crossref | Google Scholar |
Granger J, Prokopenko MG, Sigman DM, Mordy CW, Morse ZM, Morales LV, Sambrotto RN, Plessen B (2011) Coupled nitrification-denitrification in sediment of the eastern Bering Sea shelf leads to 15N enrichment of fixed N in shelf waters. Journal of Geophysical Research: Oceans 116, C11006.
| Crossref | Google Scholar |
Gustafson L, Showers W, Kwak T, Levine J, Stoskopf M (2007) Temporal and spatial variability in stable isotope compositions of a freshwater mussel: implications for biomonitoring and ecological studies. Oecologia 152, 140-150.
| Crossref | Google Scholar | PubMed |
Hansson S, Hobbie JE, Elmgren R, Larsson U, Fry B, Johansson S (1997) The stable nitrogen isotope ratio as a marker of food-web interactions and fish migration. Ecology 78, 2249-2257.
| Crossref | Google Scholar |
Hirst AJ, Jenkins GP (2017) Experimental test of N-limitation for Zostera nigricaulis seagrass at three sites reliant upon very different sources of N. Journal of Experimental Marine Biology and Ecology 486, 204-213.
| Crossref | Google Scholar |
Hirst AJ, Longmore AR, Ball D, Cook PLM, Jenkins GP (2016) Linking nitrogen sources utilised by seagrass in a temperate marine embayment to patterns of seagrass change during drought. Marine Ecology Progress Series 549, 79-88.
| Crossref | Google Scholar |
Jenkins GP, Black KP (2019) Contrasting impact of diatoms on dominant calanoid and cyclopoid copepods in a temperate bay. Estuarine, Coastal and Shelf Science 217, 211-217.
| Crossref | Google Scholar |
Jenkins GP, Black KP (2021) Modelling the effects of changing loads of nitrogen discharged from a sewage treatment plant on plankton dynamics in a large, urbanised bay. Regional Studies in Marine Science 45, 101825.
| Crossref | Google Scholar |
Jenkins G, Keough M, Ball D, Cook P, Ferguson A, Gay J, Hirst A, Lee R, Longmore A, Macreadie P, Nayar S, Sherman C, Smith T, Ross J, York P (2015) Seagrass resilience in Port Phillip Bay. Final Report to the Seagrass and Reefs Program for Port Phillip Bay. Technical Report. University of Melbourne, Vic., Australia. https://doi.org/10.13140/rg.2.1.4734.9604
Jennings S, Warr KJ (2003) Environmental correlates of large-scale spatial variation in the δ15N of marine animals. Marine Biology 142, 1131-1140.
| Crossref | Google Scholar |
Kessler AJ, Bristow LA, Cardenas MB, Glud RN, Thamdrup B, Cook PLM (2014) The isotope effect of denitrification in permeable sediments. Geochimica et Cosmochimica Acta 133, 156-167.
| Crossref | Google Scholar |
Kilham P, Hecky RE (1988) Comparative ecology of marine and freshwater phytoplankton. Limnology and Oceanography 33, 776-795.
| Crossref | Google Scholar |
Lehmann MF, Sigman DM, Berelson WM (2004) Coupling the 15N/14N and 18O/16O of nitrate as a constraint on benthic nitrogen cycling. Marine Chemistry 88, 1-20.
| Crossref | Google Scholar |
Lehmann MF, Sigman DM, McCorkle DC, Granger J, Hoffmann S, Cane G, Brunelle BG (2007) The distribution of nitrate 15N/14N in marine sediments and the impact of benthic nitrogen loss on the isotopic composition of oceanic nitrate. Geochimica et Cosmochimica Acta 71, 5384-5404.
| Crossref | Google Scholar |
Lemesle S, Erraud A, Mussio I, Rusig A-M, Claquin P (2016) Dynamics of δ15N isotopic signatures of different intertidal macroalgal species: assessment of bioindicators of N sources in coastal areas. Marine Pollution Bulletin 110, 470-483.
| Crossref | Google Scholar | PubMed |
Lorrain A, Paulet Y-M, Chauvaud L, Savoye N, Donval A, Saout C (2002) Differential δ13C and δ15N signatures among scallop tissues: implications for ecology and physiology. Journal of Experimental Marine Biology and Ecology 275, 47-61.
| Crossref | Google Scholar |
Marconi M, Giordano M, Raven JA (2011) Impact of taxonomy, geography, and depth on δ13C and δ15N variation in a large collection of macroalgae. Journal of Phycology 47, 1023-1035.
| Crossref | Google Scholar | PubMed |
McClelland JW, Valiela I (1998) Linking nitrogen in estuarine producers to land-derived sources. Limnology and Oceanography 43, 577-585.
| Crossref | Google Scholar |
McIntyre PB, Flecker AS (2006) Rapid turnover of tissue nitrogen of primary consumers in tropical freshwaters. Oecologia 148, 12-21.
| Crossref | Google Scholar | PubMed |
Miller TW, Omori K, Hamaoka H, Shibata J-Y, Hidejiro O (2010) Tracing anthropogenic inputs to production in the Seto Inland Sea, Japan – a stable isotope approach. Marine Pollution Bulletin 60, 1803-1809.
| Crossref | Google Scholar | PubMed |
Morris EP, Peralta G, Benavente J, Freitas R, Rodrigues AM, Quintino V, Alvarez O, Valcarcel-Perez N, Vergara JJ, Hernandez I, Perez-Llorens JL (2009) Caulerpa prolifera stable isotope ratios reveal anthropogenic nutrients within a tidal lagoon. Marine Ecology Progress Series 390, 117-128.
| Crossref | Google Scholar |
Orlandi L, Calizza E, Careddu G, Carlino P, Costantini ML, Rossi L (2017) The effects of nitrogen pollutants on the isotopic signal (δ15N) of Ulva lactuca: microcosm experiments. Marine Pollution Bulletin 115, 429-435.
| Crossref | Google Scholar | PubMed |
Parry GD (2021) Changes to a rocky shore following upgrades from secondary to tertiary sewage treatment. Ocean & Coastal Management 214, 105891.
| Crossref | Google Scholar |
Parry GD, Hirst AJ (2016) Decadal decline in demersal fish biomass coincident with a prolonged drought and the introduction of an exotic starfish. Marine Ecology Progress Series 544, 37-52.
| Crossref | Google Scholar |
Parry GD, Langdon JS, Huisman JM (1989) Toxic effects of a bloom of the diatom Rhizosolenia chunii on shellfish in Port Phillip Bay, southeastern Australia. Marine Biology 102, 25-41.
| Crossref | Google Scholar |
Peterson BJ, Fry B (1987) Stable isotopes in ecosystem studies. Annual Review of Ecology and Systematics 18, 293-320.
| Crossref | Google Scholar |
Piola RF, Moore SK, Suthers IM (2006) Carbon and nitrogen stable isotope analysis of three types of oyster tissue in an impacted estuary. Estuarine, Coastal and Shelf Science 66, 255-266.
| Crossref | Google Scholar |
Pitt KA, Connolly RM, Maxwell P (2009) Redistribution of sewage-nitrogen in estuarine food webs following sewage treatment upgrades. Marine Pollution Bulletin 58, 573-580.
| Crossref | Google Scholar | PubMed |
Poore GCB, Kudenov JD (1978) Benthos around an outfall of the Werribee Sewage-treatment Farm, Port Phillip Bay, Victoria. Australian Journal of Marine and Freshwater Research 29, 157-167.
| Crossref | Google Scholar |
Post DM (2002) Using stable isotopes to estimate trophic position: models, methods, and assumptions. Ecology 83, 703-718.
| Crossref | Google Scholar |
Pruell RJ, Taplin BK, Oczkowski AJ, Grear JS, Mendoza WG, Pimenta AR, Hanson AR, Miller KM (2020) Nitrogen isotope fractionation in a continuous culture system containing phytoplankton and blue mussels. Marine Pollution Bulletin 150, 110745.
| Crossref | Google Scholar |
Raimonet M, Guillou G, Mornet F, Richard P (2013) Macroalgae δ15N values in well-mixed estuaries: Indicator of anthropogenic nitrogen input or macroalgae metabolism? Estuarine, Coastal and Shelf Science 119, 126-138.
| Crossref | Google Scholar |
Roelke LA, Cifuentes LA (1997) Use of stable isotopes to assess groups of king mackerel, Scomberomorus cavalla, in the Gulf of Mexico and southeastern Florida. Fishery Bulletin 95, 540-551.
| Google Scholar |
Rogers KM (2003) Stable carbon and nitrogen isotope signatures indicate recovery of marine biota from sewage pollution at Moa Point, New Zealand. Marine Pollution Bulletin 46, 821-827.
| Crossref | Google Scholar | PubMed |
Russell DG, Wong WW, Cook PLM (2018) Negligible isotopic fractionation of nitrogen within temperate Zostera spp. meadows. Biogeosciences 15, 7225-7234.
| Crossref | Google Scholar |
Ryther JH, Dunstan WM (1971) Nitrogen, phosphorus, and eutrophication in the coastal marine environment. Science 171, 1008-1013.
| Crossref | Google Scholar | PubMed |
Savage C (2005) Tracing the influence of sewage nitrogen in a coastal ecosystem using stable nitrogen isotopes. AMBIO: A Journal of the Human Environment 34, 145-150.
| Crossref | Google Scholar | PubMed |
Savage C, Elmgren R (2004) Macroalgal (Fuscus vesiculosus) δ15N values trace decrease in sewage influence. Ecological Applications 14, 517-526.
| Crossref | Google Scholar |
Swart PK, Evans S, Capo T, Altabet MA (2014) The fractionation of nitrogen and oxygen isotopes in macroalgae during the assimilation of nitrate. Biogeosciences 11, 6147-6157.
| Crossref | Google Scholar |
Thornber CS, DiMilla P, Nixon SW, McKinney RA (2008) Natural and anthropogenic nitrogen uptake by bloom-forming macroalgae. Marine Pollution Bulletin 56, 261-269.
| Crossref | Google Scholar | PubMed |
Trueman CN, McGill RAR, Guyard PH (2005) The effect of growth rate on tissue-diet isotopic spacing in rapidly growing animals. An experimental study with Atlantic salmon (Salmo salar). Rapid Communications in Mass Spectrometry 19, 3239-3247.
| Crossref | Google Scholar | PubMed |
Udy JW, Dennison WC (1997) Physiological responses of seagrasses used to identify anthropogenic nutrient inputs. Marine and Freshwater Research 48, 605-614.
| Crossref | Google Scholar |
Welsh DT (2000) Nitrogen fixation in seagrass meadows: regulation, plant-bacteria interactions and significance to primary productivity. Ecology Letters 3, 58-71.
| Crossref | Google Scholar |