

Use of otolith quality flags to assess distributional dynamics in Baltic cod stocks
Sven Stötera A B and Uwe Krumme AA Thünen Institute of Baltic Sea Fisheries, Alter Hafen Süd 2, D-18069 Rostock, Germany.
B Corresponding author. Email: sven.stoetera@ti.bund.de
Marine and Freshwater Research 67(7) 980-991 https://doi.org/10.1071/MF15048
Submitted: 5 February 2015 Accepted: 2 July 2015 Published: 21 October 2015
Journal Compilation © CSIRO Publishing 2016 Open Access CC BY-NC-ND
Abstract
In the Baltic Sea, cod spawn in several basins separated by shallower sills. The mixing dynamics between two cod stocks and their components remain largely unclear, yet such mixing has gained attention in recent years because signs of recovery in the eastern Baltic cod population suggested spillover into the western basin. In the present study, we assessed whether quality flags (QF) of cod otoliths (QF categories: readable, uncertain or unreadable) can be used to evaluate spillover. Analysis of ~80 000 otoliths taken between 2007 and 2013 showed that the Darß and Drogden sills consistently separated large numbers of readable otoliths in the shallower western area (subdivision (SD) 21–SD23) from large proportions of uncertain and unreadable otoliths in the deeper eastern basins (SD25–SD29). SD24 was a mixing area: the western statistical rectangles resembled SD22 and SD23, whereas the eastern rectangles resembled SD25, in close association with basin topography. QF proportions did not differ on the various spatial and temporal scales examined, regardless of grouping by sex or length class. This suggests that increased spillover from the east has not occurred since 2007. However, the large proportion of uncertain otoliths in SD24 and inconsistencies in QF determination may mask the detection of trends in mixing.
Additional keywords: Gadus morhua, mixing, readability, spillover, stock dynamics.
Introduction
The distribution of Atlantic cod (Gadus morhua) ranges from the north Atlantic to the North and Baltic seas. The Baltic Sea is a semi-enclosed estuarine area with a sequence of shallow and deep basins separated from the North Sea by shallow sills (e.g. the Darß sill) limiting the exchange of saline waters. Baltic cod live in a highly dynamic estuarine environment with strong horizontal and vertical gradients in water temperature, salinity and oxygen (Tomkiewicz et al. 1998).
The heterogeneous hydrography of the Baltic Sea, coupled with variations in feeding intensities and temperatures, have been hypothesised to result in optically somewhat uniform otolith structures that lack strong seasonal variation in opacity (Doering-Arjes et al. 2008; Hüssy et al. 2009; Hüssy 2010). This causes difficulty in the reading and interpreting of the structures and annuli of the cod otoliths, adding uncertainty to estimations of age, and hence age-based stock assessment. In fact, difficulty in the readability of Baltic Sea cod otoliths has been known for decades (Berner 1968; Bingel 1980; ICES 1998, 2000; Hüssy 2010). However, ring structures of cod otoliths originating from the western Baltic have consistently been considered as less complex to interpret than those from the eastern Baltic (e.g. Berner 1968; Hüssy 2010), yet a comprehensive analysis of otolith readability patterns has never been conducted, despite: (1) a potential usefulness in understanding environmental influences on otoliths; and (2) an improved ability to assess mixing dynamics between the populations.
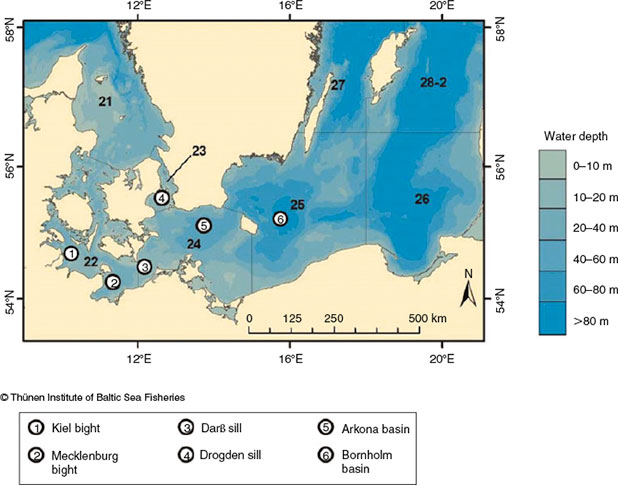
Baltic Sea cod are currently divided into a western stock (subdivision (SD) 22–24; hereafter WBC) and an eastern stock (SD25–32; hereafter EBC; ICES 2010) that are used for assessment and fisheries management (Fig. 1). Köster et al. (2009) and Eero et al. (2012) assumed a recovery in spawning stock biomass (SSB) for the EBC, with a tripling in SSB between 2005 and 2009; however, recent findings suggest that the SSB has been decreasing again since 2012 (ICES 2014). In contrast, the WBC SSB seems to be remaining at lower levels, showing no sign of increasing (ICES 2014). The increase in EBC and the consequent gradient in stock abundance between the EBC and WBC may favour movements or changes in distribution patterns and mixing (i.e. a spillover of cod from SD25 to SD24; Eero et al. 2012). A ‘spillover’ is defined as the ‘net emigration of adults and juveniles across borders’ (Forcada et al. 2009); that is, an increased contribution of fish from beyond a border. This is in contrast with regular changes in distribution occurring, for example, as part of spawning or feeding migrations that result in periodic or seasonal mixing of populations in a given area (Campana et al. 1999). The Arkona basin (SD24) has always been considered a mixing area (Bleil and Oeberst 2007). However, current management assigns SD24 to WBC. Knowledge of these mixing dynamics and assessing the magnitude of exchange will reduce uncertainty in stock assessment (Paul et al. 2013). Several studies in the Baltic Sea have attempted to assign individual cod to a certain stock, for example via tagging experiments (Neuenfeldt et al. 2007; Nielsen et al. 2013), otolith microchemistry (Heidemann et al. 2012), genetics (Eero et al. 2012), models (e.g. egg dispersal; Petereit et al. 2014) or analysis of otolith shape (Paul et al. 2013; Hüssy et al. 2014).
|
However, these methods are time consuming, often expensive and limited in spatiotemporal coverage and resolution, with only limited suitability for providing fast estimates of the magnitude of stock mixing necessary for annual stock assessment, for example. The ‘readability’ of ring structures of otoliths (e.g. ‘quality flags’ (QF)) could potentially provide useful information to assess life history patterns and stock dynamics of Baltic Sea cod. QF categorise the readability of an otolith (i.e. the visibility of clearly distinguishable structures of broken or sliced otoliths). Although variations in readability are common (Panfili et al. 2002), no studies have reported using this type of data (e.g. categories) to actually assess distributional dynamics in fish stocks.
Classification of the readability of cod otoliths in the Baltic Sea has a long history (Bagge and Steffensen 1989). Kändler (1944) recognised differences in the readability of (sliced) otoliths from different sampling sites in the Baltic. The majority of otoliths from the Kiel and Mecklenburg bights (SD22) and the western Arkona Sea (SD24) had well-defined ring structures, whereas otoliths from the eastern Arkona Sea (SD24) and the Bornholm basin (SD25) had a higher proportion of less well defined or even unreadable structures (Kändler 1944). Berner (1968) established the first categorisation system for the otolith features of Baltic cod using the width and clarity of annual rings of whole otoliths and found that a large proportion of otoliths in SD22 had broad and distinct growth zones (termed ‘Type A’), whereas otoliths from SD25 were characterised by a large proportion of opaque material without well-defined growth zones (Type B) or were similar to Type A but with narrower annuli (Type C). Similar percentage distributions of the three otoliths types described by Berner (1968) were determined in the western (Bagge and Steffensen 1980) and eastern Baltic (Bagge and Steffensen 1989).
Presuming that the formation of distinguishable differences in the opacity of a cod otolith originates from the surrounding environment and hence the area that the fish inhabits, the aim of the present study was to assess spatiotemporal patterns in the distribution of readability categories of Baltic cod otoliths to address the following four questions: Question 1, is there a general pattern of QF distribution of cod otoliths in the Baltic Sea; Question 2, are the overall proportions of QF categories stable over time (years, quarters) and space (subdivisions, statistical rectangles, quarter-rectangles); Question 3, are there recognisable mixing dynamics (e.g. by sex or length group) based on the distribution of quality-flagged otoliths; and Question 4, do otolith QF provide evidence for an increased spillover effect of EBC into the western Baltic Sea?
Material and methods
Study area
The Baltic Sea is a brackish water region characterised by decreasing salinity towards the north-eastern boundaries and by declining oxygen with increasing water depth. It consists of a series of basins separated by shallow sills (Fig. 1), each basin having characteristic features. The region is divided into SDs that vary in size and usually have somewhat different geographical and hydrographical features (e.g. sills or basins; EC 218/2009, Pöttering and Vondra 2009). Each SD is divided into statistical rectangles of 30 × 30 nautical miles (~55.6 × 55.6 km). The sampling in the present study covered SD21–SD29; however, the focus of the study was on SD22, SD24 and SD25, which are presently the main spawning grounds and cover the area with the greatest mixing between the two stocks (SD24). The Kiel and Mecklenburg bights (SD22) are ~20 m deep. SD22 exhibits the greatest exchange with higher levels of saline water originating mainly from the Kattegat, and thermal convection regularly occurs. The Arkona basin (SD24) is almost 50 m deep. Bottom water salinity is in the range 10–20. Thermal convection regularly occurs. The Darß and Ogden sills separate the Arkona basin from SD22 in the west and SD23 in the north-west respectively (Fig. 1). The Bornholm basin (SD25) is up to 100 m deep, with a permanent stratification. A low-salinity surface layer with a salinity of ~7 overlies the saline deep waters, with salinity in the range 11–17, which forms an effective barrier to thermal convection; the hydrographic conditions in the deeper waters are influenced primarily by the frequency and intensity of inflows from the Kattegat and oxygen consumption rates (Voipio 1981; Matthäus and Franck 1992). The major corridor between SD25 and SD24 is Bornholmsgatt (~100 m deep) north of Bornholm Island. Rönnebank and Oderbank are shallower areas (~10–30 m deep) south-west of Bornholm Island; however, the area east of Rönnebank is deeper and topographically part of the Bornholm basin, but is assigned to SD24 because of the artificial divide between SD24 and SD25 (Fig. 1).
Otoliths
Quality-flagged cod otoliths were covered from 2007 to 2013, derived from the biological samplings of the German commercial fisheries (European Union (EU) data collection framework, EC 93/2010, Borg 2009) and three annual surveys: (1) the German segment of the demersal Baltic International Trawl Survey (BITS), in February and October in SD22 and SD24; (2) the national demersal Cod in the Baltic (CoBalt) survey, in March and June in SD22, SD24 and SD25; and (3) the international pelagic Hydro Acoustics (HA) survey, in May (SD21–SD24) and October (SD25–SD29). Although cod regularly move vertically, the significance of otoliths from SD27 to SD29 may be restricted because relatively few otoliths were available and almost all originated exclusively from pelagic HA survey hauls (Table 1). Sampling of the commercial fleet is conducted year-round, focussing on the major fishing seasons and fishing grounds of the German fleet (i.e. SD22, SD24 and SD25). Usually 10–15 individuals per length class per sample (i.e. haul) are chosen to gather biological information (e.g. individual length and weight, age, sex, maturity). Since 2007, all cod otoliths from these surveys and commercial samplings have been sliced, aged and quality flagged. The sagittal otoliths, embedded in epoxy resin, have been thin sectioned across the centre using a semi-automated mineralogy sawing machine. The cross-sections are mounted on glass slides with thermoplastic glue. The second otolith from each individual is archived.

|
Quality flags
Based on the optical appearance of the opacity of the ring structures, each sliced otolith was assigned to one of three readability categories: QF0, ‘readable’, showing clear demarcations between opaque and translucent zones (data used for analysis); QF4, ‘uncertain’, with semiprominent demarcations (data used for analysis); and QF8, ‘unreadable’, namely otoliths without clear demarcations that were not used for analysis (Fig. 2). The intermediate classification QF5 (uncertain, slightly more unreadable than QF4) was assigned to the QF4 category in the present study, whereas QF2 (readable, but slightly blurred) was assigned to the QF0 category. The current version of QF categories was introduced in November 2007 (e.g. ICES 2000). QFs assigned between January and October 2007 were transcribed into the current system.

|
The same two readers (R1 and R2) have been ageing and quality flagging these cod otoliths since 2007. To assess the stability of QF categorisation and quantify age reader bias, 250–300 randomly selected otoliths from 2009 to 2011 from SD22, SD24 and SD25 were re-assigned to the current QF system by both age readers. It is important to note that over the years the performance of QF assignments of the age readers has not been compared; assigning QF categories was primarily a tool to separate reliable from unreliable age information for assessment. When determining fish age and QFs, the readers are aware of fish length. Overall, R1 classified ~60% of all otoliths.
Statistical analysis
Data were analysed at the highest aggregation level, and were then disaggregated while ensuring sufficient sample sizes (i.e. first, all years were analysed together, followed by the analysis of years then quarters; on the spatial scale, the analysis went from the SD and rectangle to quarter-rectangle level). Additional analyses were conducted by sex (male or female) and four length groups (total length: 1, immature cod <20 cm; 2, maturing cod, 20–30 cm; 3, mature cod, 31–60 cm; and 4, old cod >60 cm).
A subset of 13 statistical rectangles with large sample sizes (i.e. all nine rectangles of SD24, two from SD22 and two from SD25) was selected and the proportion of QFs was analysed per rectangle and quarter-rectangle per year and quarter. Subsequently, from the 13 rectangles, another subset of six rectangles was selected. These selected rectangles are located in the eastern part of SD24 where mixing is supposed to be high and changes in QF proportions are most likely to occur. The proportion of QFs was analysed by rectangle and quarter-rectangle on a yearly and quarterly basis.
Abundance data (number of otoliths in a given stratum) were square root transformed before performing multivariate analyses to account for differences in the sampling intensity and numbers. Formal significance tests for spatial and temporal differences in the structures of QF proportions were performed using two-way crossed ANOSIM (analysis of similarity) on the Bray–Curtis measure of similarity. Furthermore, similarity percentage analysis (SIMPER) was used to identify the contribution of each QF to dissimilarities. Analyses were performed using PRIMER version 6.0 (Anderson 2001; Clarke and Gorley 2006) with the PerMANOVA+ Add-On (Anderson et al. 2008). Permutational analysis of variance (PerMANOVA) was used to assess differences in average QF proportions by location (by SD) and by site within locations (rectangles and quarter rectangles) and by time (year, quarter). Location and time were considered as fixed factors, whereas site was considered a random factor nested in location (i.e. SD).
A time series analysis was conducted using a Cox–Stuart test for trend analysis (Cox and Stuart 1955), using the nptrend-package in R (http://www.r-project.org, accessed 25 September 2014). Yates correction was applied for strata with n < 30. The analysis was performed by SD and year, as well as by selected rectangles and years.
Results
QF consistency
The QF agreement within and between the two age readers was highest for readable otoliths (80–100%; Table 1). R1 achieved ≥86% agreement for all SDs and all QF categories, except for QF4 in SD22. R2 exhibited good levels of agreement only for readable otoliths in SD22 and SD24.
Spatiotemporal patterns
In all, 79 755 otoliths, covering the period from January 2007 to December 2013 and taken from SD21–SD29, were available for this analysis. Samples from the commercial fisheries sampling program and the CoBalt, BITS and HA surveys accounted for 52, 27, 17 and 4% of all otoliths respectively (Table 2). Ninety-eight per cent of the otoliths originated from SD22, SD24 and SD25. The overall QF distribution revealed that the Darß and Drogden sills consistently divided large proportions of readable otoliths in the west (SD21–SD23) from large proportions of uncertain and unreadable otoliths in the east (SD24–SD29). Overall, the proportion of readable otoliths decreased from west to east from >95% (SD21), 85–80% (SD22), 55–50% (SD23), 5% (SD24), <3% (SD25) to 0% (SD26, SD27, SD28 and SD29; Fig. 3). The proportion of unreadable otoliths decreased from east to west from 30% (SD26), 25% (SD25), 15–10% (SD24) to <3% (SD23–SD21).

|
|
Year-wise analysis showed only random fluctuations in the overall QF proportions in SD22, SD24 and SD25 (Fig. 4). The proportion of readable otoliths in SD22 ranged between 80 and 90% each year; only in 2013 did the proportion of readable otoliths decrease to <70%. In SD24, the proportion of readable otoliths varied between years (e.g. <20% in 2009 and >50% in 2011).

|
The number of unreadable otoliths did not exhibit any major change over time; the proportion of unreadable otoliths in SD22 was <5% each year, except for 2011, when the proportion increased to 10%. The proportion of unreadable otoliths in SD24 ranged between 7 and 12% each year. In SD25, the proportion of unreadable otoliths was at ~20% until 2009 and has been ~30% since 2010 (Fig. 4; see Fig S1, available as Supplementary material to this paper).
‘Location’ (SD) and ‘Time’ (quarter within years) affected QF proportions, but the effects were only significant for Time (two-way crossed ANOSIM: global R = 0.458, P = 0.001) and not for Location (global R = 0.019, P = 0.33; Table 3). Readable otoliths mostly contributed to the dissimilarity in Time (SIMPER; average dissimilarity from 26 to 40% in SD22, from 18 to 39% in SD24 and from 14 to 21% for SD25; Table S1, available as Supplementary material to this paper). The average QF proportions differed significantly by both SD (PerMANOVA, F = 17.1, P < 0.001) and years (F = 1.8, P = 0.049), but not between quarters (F = 0.87, P = 0.70; Fig. 4). There were no significant interactions between terms (F = 0.45, P = 0.99). The Cox–Stuart test for trend analysis did not reveal any trends on a significant level for any of the QF in the three SD evaluated over the study period (Table S2, available as Supplementary material to this paper).
|
QF proportions by rectangle largely reflected the west–east pattern of SDs (Figs 5 and S2, the latter available as Supplementary material to this paper). The proportion of readable otoliths decreased, whereas the number of uncertain und unreadable otoliths increased eastwards. Multidimensional scaling (MDS) showed that the eastern rectangles of SD24 were more similar to the western rectangles of SD25 than to the western rectangles of SD24. ‘Site’ (rectangle) and ‘Time’ (quarter within years) affected QF proportions, but the dissimilarity was only significant for Time (two-way crossed ANOSIM: global R = 0.401, P = 0.001) and not for Site (global R = 0.032, P = 0.17; Table 3). Readable otoliths contributed primarily to the dissimilarity between Sites (rectangles) in the west of SD24 (SIMPER, average dissimilarity ranging from 22 to 59% between rectangles). Between Sites in the east of SD24, uncertain otoliths contributed primarily to the dissimilarities (from 23 to 65%). The patterns in average QF proportions differed significantly between both rectangles (PerMANOVA, F = 9.80, P = 0.023) and years (F = 1.97, P < 0.001), but not between SD (F = 1.60, P = 0.177) and quarters (F = 1.12, P = 0.261; Fig S3, available as Supplementary material to this paper). Temporal patterns between Location were not significant. This was reflected by non-significant SD × year interactions (F = 0.99, P = 0.487), as well as by non-significant SD × quarter (F = 1.26, P = 0.10) and rectangle × year interactions (F = 0.813, P = 0.90; Table 4). The Cox–Stuart test for trend analysis did not reveal time trends on a significant level for any of the three QFs in 12 rectangles between 2007 and 2013 (Table S2 and Fig. S2).

|
|
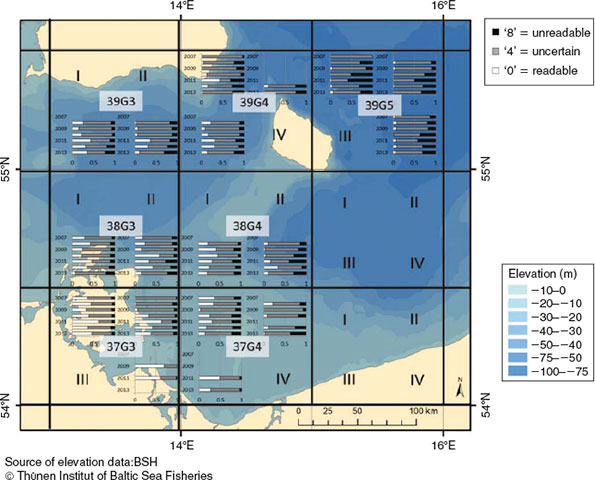
Four of 18 quarter-rectangles showed an increasing time trend of unreadable otoliths (39G3_III, 38G3_IV, 38G3_III, 37G4_I; Fig. 6). The proportion of readable otoliths increased in three quarter-rectangles (38G3_III, 37G3_I and 37G3_II). In 2010 and 2011, the proportion of unreadable and readable otoliths in 14 quarter-rectangles was higher than in other years.
|
Influence of sex
Sex did not have a significant effect on changes in the proportion of QFs. The proportion of QFs by sex (male, female) strongly resembled the overall QF assemblage, both in time (years, quarters) and space (SD, rectangle). ‘Time’ (quarter within years) significantly affected QF proportions (two-way crossed ANOSIM: global I = 0.395, P = 0.001). ‘Site’ (rectangles) had no significant effect on the dissimilarity (global R = 0.011, P = 0.09; Table 4). Uncertain otoliths contributed primarily to the dissimilarity between sexes by both year (SIMPER, 39%) and by rectangle (23%). The patterns in average QF assemblages differed significantly between both rectangles (PerMANOVA, F = 11.39, P < 0.001) and quarters (F = 1.67, P = 0.03), but not between sexes (F = 1.04, P = 0.36; Table 5).
|
Effects of length groups
In Length Group 1 (cod <20 cm) more otoliths were classified as readable in SD24 and SD25, whereas more otoliths were classified as uncertain in SD22 and SD25 (Fig. 7). However, there were no differences in the readability of the otoliths from the principal Length Groups 2 (20–30 cm) and 3 (31–60 cm). Length Group 4 (61–80 cm) showed a similar pattern as Length Group 3, except for rectangle 39G5, where higher proportions of unreadable otoliths were found. Cod >80 cm were rare, resulting in large fluctuations in the QF proportions for this length group in all SDs.
|
‘Site’ (rectangles) and ‘Time’ (quarter within years) significantly affected the overall QF proportions of the length groups, with dissimilarity being more marked by Time (two-way crossed ANOSIM: global R = 0.24, P < 0.001) than Site (global R = 0.30, P < 0.001; Table 3). The length class did not significantly affect the QF proportions within a given rectangle and year (two-way crossed ANOMSIM: P > 0.05 for all analysed strata, data not shown, but see summarising P(perm) given in Table 6). Because of the patchy pattern in sampled strata, a PerMANOVA could not be calculated on the lowest level (per length group, year and rectangle; Table 6).
|
On the quarter-rectangle resolution, the QF proportions of Length Group 1 showed no major trend. Length Groups 2–4 showed a slight but steady increase in unreadable otoliths in 39G3_III and 39G3_IV. The QF proportions of Length Group 4 resembled Length Groups 2 and 3, but had a more inferior coverage in time and space. In SD24, the quantity of uncertain otoliths was stable, except in 2011, when the proportion of readable and unreadable otoliths increased compared with the previous and following years. In 2011, there was a higher proportion of readable and unreadable otoliths in 16 of 18 quarter-rectangles (Fig S4, available as Supplementary material to this paper). However, in some quarter rectangles the ratio remained the same or even increased. In conclusion, no general pattern for changes in the proportion of quality-flagged otoliths in the different quarter-rectangles was found.
No statistical evaluation was possible at the quarter-rectangle level for either sex or length groups because the rectangle-wise analysis did not indicate a difference between the groups and the spatiotemporal coverage was insufficient in all strata.
Discussion
The readability categories of cod otoliths in the Baltic Sea exhibited a consistent pattern. The fine-scale spatial resolution at the quarter-rectangle level clearly showed that the Darß and Drogden sills separated SD21–SD23 with higher proportions of readable otoliths in the west from SD25–29 and with lower proportions of readable otoliths in the east (Question 1). Although defined as a habitat of the WBC, SD24 was clearly a mixing area with QF proportions of the western rectangles of SD24 somewhat resembling SD22, whereas the eastern rectangles of SD24 were more similar to SD25. Traditionally, SD24 is considered a transitional area (e.g. Nissling and Westin 1997; Neuenfeldt et al. 2007) where significant numbers of cod from SD22 and SD25 meet with cod originating from SD24 (Bleil and Oeberst 2007). SD24 fulfils requirements for successful spawning of cod from both stocks (i.e. bottom water salinities of 15–22; Bleil and Oeberst 2007), transport during early life stages and facilitation of movement of juvenile and adults across SD boundaries (e.g. Hinrichsen et al. 2009; Otterlind 1985). Our QF analysis confirmed the transitional status of SD24 in Baltic cod stock distribution.
The consistently greater proportion of uncertain and unreadable otoliths in SD24–SD29 compared with SD21–SD23 suggests that the readability of Baltic cod otoliths is strongly affected by the environmental conditions experienced by the fish. The environments in the deeper basins with lower salinities, such as in the Arkona or Bornholm basins, is reflected by otoliths with less clear seasonal demarcations, whereas the higher salinity and shallower environments in SD21–SD23 were linked to clearer seasonal ring structures. The interactive effects of different factors on ring formation in free-ranging Baltic cod remain unclear. Berner (1968) suggested that the environmental and individual conditions may control the development of ring formation in cod otoliths. Laboratory experiments with cod from SD22 showed that changes in temperature, salinity and oxygen levels play a role in ring formation (Bingel 1980).
Numerous uncertain otoliths occurred across the entire time period in SD24–SD29. None of these uncertain otoliths contained clearly separated alternations of blurred and pronounced ring structures (i.e. the readability did not change along the growth axis of an otolith; Fig. 2b). However, the relatively young age of most Baltic cod (usually <5 years) could also preclude the formation of ring zones that age readers could identify as clearly distinct zones of readability. In the samples used in the present study, there are too few otoliths of older fish to determine whether more distinct readability zones occur at greater age.
The validity of our analysis of QF categories is affected not only by the large number of uncertain otoliths, but also by the inherent uncertainty in the QF approach itself (i.e. variations in the performance of the age readers themselves). QF definitions were interpreted slightly differently between age readers. Although R1 was more experienced and exhibited a competent assignment of QFs, R2 was less confident. R2 classified minor deviations from a ‘perfect’ QF0 otolith as QF4, whereas R1 would assign the same otolith as QF0; R2 tried to extract age information from a QF4 or QF5 otolith that R1 would confidently classify as QF8. However, the age reader comparison suggests that the methodological uncertainty in our QF approach was low for readable otoliths (<5%), intermediate for unreadable otoliths (~5–10%) and highest for uncertain otoliths (~10–20%). Consequently, the level of uncertainty introduced by the QF method can be considered low enough to assess general changes at a coarser spatiotemporal resolution.
Sex and length class did not affect differences in the proportion of quality-flagged otoliths. In cod, behavioural differences between sexes are minor (Neuenfeldt and Beyer 2003; Neuenfeldt et al. 2007), except for fine-scale patterns during the spawning period (Nielsen et al. 2013; Dean et al. 2014). Therefore, in any given area, female and male cod most likely experience largely the same hydrographic conditions, which results in similar readability patterns. The deviations in QF assignments in the smallest length class (cod <20 cm) was due to an age reader effect (Fig. 7). In SD22, a higher level of uncertain otoliths reflected the ambiguity in determining whether small cod were Age 0 or Age 1 (i.e. whether or not the first ring structures were already pronounced enough to be considered the first annual ring). In SD24 and SD25, the increased proportion of readable otoliths in fish <20 cm reflected the high certainty in identifying a young-of-the-year cod (Age 0).
Mixing dynamics
Spatially, a spillover should result in increased fish densities close to the borders of an area (e.g. SD or statistical rectangle) that decrease with distance, with specific patterns shaped by fish movements and fish mortality in surrounding areas (Chapman and Kramer 2000; Russ et al. 2003). Translated into a QF approach, spillover from the east should have resulted in a steady increase of unreadable and uncertain otoliths. However, mixing dynamics were largely stable as determined by area (SD, rectangle, quarter-rectangle) and time (year, quarter), as well as by biological units (sex, length groups; Questions 2 and 3). The stable mixing dynamics of the quality-flagged otoliths since 2007 and the time series analysis did not suggest a recent increased spillover from the east (Question 4) on a significant level. If spillover occurred, it may have started before 2007.
However, the proportions of QFs of the eastern rectangles of SD24 consistently resembled the western rectangles of SD25. The only areas in SD24 with a consistent, although non-significant increase in readable and unreadable otoliths were in near proximity to the Bornholm basin: the northern Arkona basin (rectangles 39G3 and 39G4), west of Bornholm Island and the south-western tip of the Bornholm basin (quarter-rectangles 38G4_IV and 37G4_II; Fig. 6). These areas are topographically closely associated with the Bornholm basin and assigned to the assessment area of the WBC only because of the artificial divide between SD24 and SD25.
There was a small number of unreadable otoliths in the western areas of the Baltic Sea (SD21–SD23), just as small numbers of readable otoliths occurred in the east (SD25–SD26). This may be an indication that small numbers of cod leave their usual feeding grounds during the year and move out on a larger scale. Tagging experiments have shown that one of 10 marked cod moved from the Bornholm basin into the western Baltic Sea (Neuenfeldt et al. 2007). Such larger-scale movements are known for Baltic cod, but only for a smaller part of the population (e.g. Otterlind 1985). Interestingly, the low proportion of unreadable otoliths in the western Baltic (<3%) found in the present study are similar to the 10% exchange observed from tagging experiments. Inversely, low proportions of readable otoliths in SD25–SD26 suggest restricted larger-scale movements of cod from west to east. Mixing proportions of Berner’s (1968) Baltic cod otolith Types A–C from the 1960s were surprisingly similar to those determined in the present study (Table 7). In the 1970s, a similar pattern was found in cod otoliths from the western Baltic Sea (Bagge and Steffensen 1980) and eastern Baltic Sea when applying Berner’s otolith types (Bagge and Steffensen 1989; Table 7). Kändler (1944) did not give readability categories, but found ‘very few’ uncertain readable otoliths in SD22 with an increasing trend towards SD25, where ‘unreadable’ otoliths occurred. However, generalisations about stability over time should be made with caution because of major differences in methodology between the historical studies and the approach used in the present study.
|
Conclusions
The present study shows a measurable and consistent difference in QF proportions of cod otoliths in the Baltic Sea with high spatiotemporal resolution. It is clear that the Darß and Drogden sills cause a topographic divide between the eastern and western Baltic, as reflected by the high number of readable otoliths in the west compared with more uncertain and unreadable otoliths in the east.
Distribution patterns have been relatively stable over 7 years. There was no evidence of a significant increased spillover of EBC, as would be indicated by an increase in unreadable and uncertain otoliths in the west. The period 2007–13 lacked major seawater inflows and was characterised by a phase of degrading environmental conditions in the deeper basin of SD25–29 (Carstensen et al. 2014). The similarities in QF proportions between the eastern rectangles in SD24 and western rectangles in SD25 were due primarily to bathymetry. Hence, patterns in QF proportions near the artificial division between SD24 and SD25 can be readily explained by the topographic affiliation to certain areas, especially of the quarter-rectangles east of Rönnebank and near Bornholmsgatt to the Bornholm basin.
However, interpretation of Baltic cod otoliths needs further refinement, requiring improved cross-validations, using, for example, tagging and laboratory experiments, genetics, otolith shapes and microchemical analyses. These approaches could, for example, help verify whether the unreadable otoliths in SD22 really belong to EBC and the readable otoliths in SD25 and SD26 belong to WBC. The movement of cod between SDs not only causes uncertainty in SSB, but may also cause bias in age readings. In age readings of EBC, age information from readable otoliths is usually included in the assessment data. If readable otoliths in SD25–SD26 in fact belong to WBC, age information from readable otoliths of faster-growing WBC would cause an unknown bias in the EBC stock assessment.
Acknowledgements
The authors thank Britta Preuß and Marianna Wolfram for embedding, slicing and reading all the otoliths. The authors also thank all those colleagues at sea and in the laboratory who were involved in otolith extraction. SS acknowledges a grant from Stiftung Seeklar for participation in the 5th International Otolith Symposium (IOS).
References
Anderson, M. J. (2001). A new method for non-parametric multivariate analysis of variance. Austral Ecology 26, 32–46.Anderson, M. J., Gorley, R. N., and Clarke, K. R. (2008). ‘PERMANOVA+ for PRIMER: Guide to Software and Statistical Methods.’ (PRIMER-E: Plymouth.)
Bagge, O., and Steffensen, E. (1980). Growth pattern in cod otoliths as indicator for mixing of stocks. Conference and Meeting document C.M. 1980/J:12, International Council for the Exploration of the Sea.
Bagge, O., and Steffensen, E. (1989). Stock identification of demersal fish in the Baltic. Rapports et procès-verbaux des réunions/Conseil permanent international pour l'exploration de la mer 190, 3–16.
Berner, M. (1968). Einige orientierende Untersuchungen an den Otolithen des Dorsches (Gadus morhua L.) aus verschiedenen Regionen [Investigations of cod otoliths originating from different areas]. Fischerei-Forschung 6, 77–86.
Bingel, F. (1980). Identification of structures in the otoliths of cod (Gadus morhua) in Kiel bight (west Germany). Meeresforschung 28, 69–74.
Bleil, M., and Oeberst, R. (2007). Dorsche in der Ostsee: wann und wo sie sich fortpflanzen [Cod in the Baltic Sea: where and when they reproduce]. Forschungsreport 2007, 30–35.
Borg, J. (2009). Commission decision (2010/93/EU) of 18 December 2009 adopting a multiannual Community programme for the collection, management and use of data in the fisheries sector for the period 2011–2013 (notified under document C(2009) 10121). Official Journal of the European Union, L 41, 8–71.
Campana, S. E., Chouinard, G. A., Hanson, J. M., and Fréchet, A. (1999). Mixing and migration of overwintering Atlantic cod (Gadus morhua) stocks near the mouth of the Gulf of St. Lawrence. Canadian Journal of Fisheries and Aquatic Sciences 56, 1873–1881.
| Mixing and migration of overwintering Atlantic cod (Gadus morhua) stocks near the mouth of the Gulf of St. Lawrence.Crossref | GoogleScholarGoogle Scholar |
Carstensen, J., Andersen, J. H., Gustafsson, B. G., and Conley, D. J. (2014). Deoxygenation of the Baltic Sea during the last century. Proceedings of the National Academy of Sciences of the United States of America 111, 5628–5633.
| Deoxygenation of the Baltic Sea during the last century.Crossref | GoogleScholarGoogle Scholar | 1:CAS:528:DC%2BC2cXltl2mtLk%3D&md5=3d7bd598ec5538be368eefdcb3cf24caCAS | 24706804PubMed |
Chapman, M. R., and Kramer, D. L. (2000). Movements of fish within and among fringing coral reefs in Barbados. Environmental Biology of Fish 57, 11–24.
Clarke, K. R., and Gorley, R. N. (2006). ‘PRIMER v6: User Manual/Tutorial.’ (PRIMER-E: Plymouth.)
Cox, D.R., and Stuart, A. (1955). Some quick sign tests for trend in location and dispersion. Biometrika 42, 80–95.
| Some quick sign tests for trend in location and dispersion.Crossref | GoogleScholarGoogle Scholar |
Dean, M. J., Hoffman, W. S., Zemeckis, D. R., and Armstrong, M. P. (2014). Fine-scale diel and gender-based patterns in behaviour of Atlantic cod (Gadus morhua) on a spawning ground in the western gulf of Maine. ICES Journal of Marine Science 71, 1474–1489.
| Fine-scale diel and gender-based patterns in behaviour of Atlantic cod (Gadus morhua) on a spawning ground in the western gulf of Maine.Crossref | GoogleScholarGoogle Scholar |
Doering-Arjes, P., Cardinale, M., and Mosegaard, H. (2008). Estimating population age structure using otolith morphometrics: a test with known-age Atlantic cod (Gadus morhua) individuals. Canadian Journal of Fisheries and Aquatic Sciences 65, 2342–2350.
| Estimating population age structure using otolith morphometrics: a test with known-age Atlantic cod (Gadus morhua) individuals.Crossref | GoogleScholarGoogle Scholar |
Eero, M., Köster, F. W., and Vinther, M. (2012). Why is the eastern Baltic cod recovering? Marine Policy 36, 235–240.
| Why is the eastern Baltic cod recovering?Crossref | GoogleScholarGoogle Scholar |
Forcada, A., Valle, C., Bonhomme, P., Criquet, G., Cadiou, G., Lenfant, P., and Sánchez-Lizaso, J. L. (2009). Effects of habitat on spillover from marine protected areas to artisanal fisheries. Marine Ecology Progress Series 379, 197–211.
| Effects of habitat on spillover from marine protected areas to artisanal fisheries.Crossref | GoogleScholarGoogle Scholar |
Heidemann, F., Marohn, L., Hinrichsen, H. H., Buwer, B., Hüssy, K., Klügel, A., Böttcher, U., and Hanel, R. (2012). Suitability of otolith microchemistry for stock separation of Baltic cod. Marine Ecology Progress Series 465, 217–226.
| Suitability of otolith microchemistry for stock separation of Baltic cod.Crossref | GoogleScholarGoogle Scholar | 1:CAS:528:DC%2BC38XhvVKgtrvN&md5=0aa39b05da4384eb019fd97f3332342dCAS |
Hinrichsen, H. H., Kraus, G., Böttcher, U., and Köster, F. (2009). Identifying eastern Baltic cod nursery grounds using hydrodynamic modeling: knowledge for the design of marine protected areas. ICES Journal of Marine Science 66, 101–108.
| Identifying eastern Baltic cod nursery grounds using hydrodynamic modeling: knowledge for the design of marine protected areas.Crossref | GoogleScholarGoogle Scholar |
Hüssy, K. (2010). Why is age determination of Baltic cod (Gadus morhua) so difficult? ICES Journal of Marine Science 67, 1198–1205.
| Why is age determination of Baltic cod (Gadus morhua) so difficult?Crossref | GoogleScholarGoogle Scholar |
Hüssy, K., Nielsen, B., Mosegaard, H., and Worsøe Clausen, L. (2009). Using data storage tags to link otolith macrostructure in Baltic cod Gadus morhua with environmental conditions. Marine Ecology Progress Series 378, 161–170.
| Using data storage tags to link otolith macrostructure in Baltic cod Gadus morhua with environmental conditions.Crossref | GoogleScholarGoogle Scholar |
Hüssy, K., Mosegaard, H., Hansen, J. H., and Eero, M. (2014). The Baltic cod: a case study for testing stock discrimination based on otolith shape analysis in a mixed stock fishery. In ‘5th International Otolith Symposium’, 20–24 October 2014, Mallorca, Spain. (Eds A. Geffen and B. Morales-Nin.) Abstract reference: IIIB_Hüssy_02, p. 130. (ICES.) Available at http://ices.dk/news-and-events/Documents/Symposia/Otolith/IOS2014%20Book%20of%20Abstracts.pdf [Verified 28 September 2015].
ICES (1998). ‘Report of the Study Group on Baltic Cod Age Reading (SGBCAR), 16–20 November 1998.’ (International Council for the Exploration of the Sea: Charlottenlund, Denmark.)
ICES (2000). ‘Report of the Study Group on Baltic Cod Age Reading (SGBCAR), 27–31 March 2000.’ (International Council for the Exploration of the Sea: Karlskrona, Sweden.)
ICES (2010). ‘Report of the Baltic Fisheries Assessment Working Group (WGBFAS), 15–22 April 2010.’ (International Council for the Exploration of the Sea: Copenhagen, Denmark.)
ICES (2014). ‘Report of the Baltic Fisheries Assessment Working Group (WGBFAS), 03–10 April 2014.’ (International Council for the Exploration of the Sea: Copenhagen, Denmark.)
Kändler, R. (1944). Untersuchungen über den Ostseedorsch während der Forschungsfahrten mit dem R.F.D. ‘Poseidon’ in den Jahren 1925–1938 [Investigations on the Baltic Sea cod during the research cruises of RV ‘Poseidon’ during the years 1925–1938]. Berichte der Deutschen Wissenschaftlichen Kommission für Meeresforschung 11, 137–245.
Köster, F. W., Vinther, M., MacKenzie, B. R., Eero, M., and Plikshs, M. (2009). Environmental effects on recruitment and implications for biological reference points of eastern Baltic cod (Gadus morhua). Journal of Northwest Atlantic Fishery Science 41, 205–220.
| Environmental effects on recruitment and implications for biological reference points of eastern Baltic cod (Gadus morhua).Crossref | GoogleScholarGoogle Scholar |
Matthäus, W., and Franck, H. (1992). Characteristics of major Baltic inflows: a statistical analysis. Continental Shelf Research 12, 1375–1400.
| Characteristics of major Baltic inflows: a statistical analysis.Crossref | GoogleScholarGoogle Scholar |
Neuenfeldt, S., and Beyer, J. E. (2003). Oxygen and salinity characteristics of predator–prey distributional overlaps shown by predatory Baltic cod during spawning. Journal of Fish Biology 62, 168–183.
| Oxygen and salinity characteristics of predator–prey distributional overlaps shown by predatory Baltic cod during spawning.Crossref | GoogleScholarGoogle Scholar |
Neuenfeldt, S., Hinrichsen, H. H., Nielsen, A., and Andersen, K. H. (2007). Reconstructing migrations of individual cod (Gadus morhua L.) in the Baltic Sea by using electronic data storage tags. Fisheries Oceanography 16, 526–535.
| Reconstructing migrations of individual cod (Gadus morhua L.) in the Baltic Sea by using electronic data storage tags.Crossref | GoogleScholarGoogle Scholar |
Nielsen, B., Hüssy, K., Neuenfeldt, S., Tomkiewicz, J., Behrens, J. W., and Andersen, K. H. (2013). Individual behaviour of Baltic cod Gadus morhua in relation to sex and reproductive state. Aquatic Biology 18, 197–207.
| Individual behaviour of Baltic cod Gadus morhua in relation to sex and reproductive state.Crossref | GoogleScholarGoogle Scholar |
Nissling, A., and Westin, L. (1997). Salinity requirements for successful spawning of Baltic and Belt Sea cod and the potential for cod stock interactions in the Baltic Sea. Marine Ecology Progress Series 152, 261–271.
| Salinity requirements for successful spawning of Baltic and Belt Sea cod and the potential for cod stock interactions in the Baltic Sea.Crossref | GoogleScholarGoogle Scholar |
Otterlind, G. (1985). Cod migration and transplantation experiments in the Baltic. Journal of Applied. Ichthyology 1, 3–16.
| Cod migration and transplantation experiments in the Baltic.Crossref | GoogleScholarGoogle Scholar |
Panfili, J., de Pontual, H., Troadec, H., Wright, P.J. (Eds) (2002). ‘Manual of Fish Sclerochronology.’ (Ifremer-lRD coedition: Brest, France.)
Paul, K., Oeberst, R., and Hammer, C. (2013). Evaluation of otolith shape analysis as a tool for discriminating adults of Baltic cod stocks. Journal of Applied Ichthyology 29, 743–750.
| Evaluation of otolith shape analysis as a tool for discriminating adults of Baltic cod stocks.Crossref | GoogleScholarGoogle Scholar |
Petereit, C., Hinrichsen, H. H., Franke, A., and Köster, F. W. (2014). Floating along buoyancy levels: dispersal and survival of western Baltic fish eggs. Progress in Oceanography 122, 131–152.
| Floating along buoyancy levels: dispersal and survival of western Baltic fish eggs.Crossref | GoogleScholarGoogle Scholar |
Pöttering, H. G., and Vondra, A. (2009). Regulation (EC) number 218/2009 of the European Parliament and of the Council of 11 March 2009 on the submission of nominal catch statistics by Member States fishing in the north-east Atlantic (recast). Official Journal of the European Union, L 87, 70–108.
Russ, G. R., Alcala, A. C., and Maypa, A. P. (2003). Spillover from marine reserves: the case of Naso vlamingii at Apo Island, the Philippines. Marine Ecology Progress Series 264, 15–20.
| Spillover from marine reserves: the case of Naso vlamingii at Apo Island, the Philippines.Crossref | GoogleScholarGoogle Scholar |
Tomkiewicz, J., Lehmann, K. M., and St. John, M. A. (1998). Oceanographic influences on the distribution of Baltic cod, Gadus morhua, during spawning in the Bornholm Basin of the Baltic Sea. Fisheries Oceanography 7, 48–62.
| Oceanographic influences on the distribution of Baltic cod, Gadus morhua, during spawning in the Bornholm Basin of the Baltic Sea.Crossref | GoogleScholarGoogle Scholar |
Voipio, A. (Ed.) (1981). ‘The Baltic Sea.’ (Elsevier Scientific Publishing: Amsterdam.)