

A cause for hope: largely intact coral-reef communities with high reef-fish biomass in a remote Indonesian island group
Gino V. Limmon A B C , Halwi Masdar D , Dominic Muenzel E , Tanika C. Shalders F , Cilun Djakiman A , Maria Beger E G , Jamaludin Jompa D and Maarten De Brauwer E H *
A Fisheries and Marine Science Faculty, Pattimura University, Jalan Dr Leimena, Kampus Poka, Ambon, Indonesia.
B Maritime and Marine Science Center of Excellence, Pattimura University, Jalan Dr Leimena, Kampus Poka, Ambon, Indonesia.
C Centre for Collaborative Research on Aquatic Ecosystem in Eastern Indonesia, Ambon, Indonesia.
D Graduate School, Hasanuddin University, Makassar, 90245, Indonesia.
E School of Biology, Faculty of Biological Sciences, University of Leeds, Leeds, LS2 9JT, UK.
F National Marine Science Centre, Southern Cross University, Faculty of Science and Engineering, Coffs Harbour, NSW, Australia.
G Centre for Biodiversity and Conservation Science, School of Biological Sciences, University of Queensland, Brisbane, Qld 4072, Australia.
H CSIRO Environment, Battery Point, Hobart, Tas. 7004, Australia.
Marine and Freshwater Research 74(6) 479-490 https://doi.org/10.1071/MF22075
Submitted: 31 March 2022 Accepted: 13 February 2023 Published: 9 March 2023
© 2023 The Author(s) (or their employer(s)). Published by CSIRO Publishing. This is an open access article distributed under the Creative Commons Attribution 4.0 International License (CC BY)
Abstract
Context: The health of coral reefs is declining rapidly across the world because of anthropogenic impacts. In the mega-diverse Coral Triangle, the consequences of chronic overfishing and human use are worst near coastal population centres.
Aims: The remote islands and reefs in the centre of the Banda Sea (Indonesia) remain largely unstudied, but their distance from populated areas could provide protection from fishing.
Methods: We conducted the first visual census surveys of coral-reef communities at the uninhabited Lucipara group in the Banda Sea.
Key results: Sites showed medium to high coral cover and fish assemblages with high biomass, including abundant large predatory species. All sites exceeded the fish biomass conservation target of 1150 kg ha−1 proposed by McClanahan et al. (2015), by a factor of ~2–10. Benthic cover explained >50% of variance in fish abundance and diversity, with submassive corals, Dendrophyllia spp., and bare rock as key predictors.
Conclusions: Our results suggested that Lucipara’s reefs are among the healthiest in Indonesia, likely owing to their remoteness. However, this remoteness might also hamper policing against destructive fishing practices, highlighting a conservation gap.
Implications: Lucipara’s reef communities should be protected in a time of global coral-reef declines.
Keywords: biodiversity, conservation, Coral Triangle, fisheries, Indonesia, Lucipara, oceanic island, visual survey.
Introduction
Indonesia is situated in the heart of the Coral Triangle and the country’s coral reefs are ranked as the most biodiverse in the world (Allen 2008; Struebig et al. 2022). As with the rest of the world, the condition of Indonesia’s coral reefs is rapidly deteriorating because of various anthropogenic stressors (Ferrol-Schulte et al. 2015). Although climate change has caused localised bleaching and mortality events in the region (Trialfhianty et al. 2020), destructive fishing, coastal development and pollution have caused more damage than have climate-change effects (Ferrol-Schulte et al. 2015). Declining reef condition is of particular concern to the Indonesian economy and food security for millions of people (Teh et al. 2013; Tranter et al. 2022), because over six million people are involved in fisheries and aquaculture, with ~95% of fishery production coming from small-scale fishers (Food and Agriculture Organization of the United Nations 2016).
Indonesia’s fisheries are a vital part of its economy, with the commercial value of the industry estimated to be worth close to US$5 billion per year (Asian Development Bank 2014). Large predatory species such as tuna and groupers are often exported, whereas small pelagic species and fish lower down the food chain are the main source of protein for millions of subsistence fishers in the Coral Triangle (Burke et al. 2012; Clifton and Foale 2017). As is the case across the world, stocks of large predatory species have been largely depleted, yet Indonesia remains the world’s biggest exporter of shark fins (Yulianto et al. 2018; MacNeil et al. 2020). The overexploitation of high trophic levels and subsequent fishing down the food chain can cause trophic cascades and result in severely impoverished fish assemblages or marine ecosystem collapse (Salomon et al. 2010). In an island nation where a large proportion of the population depends on marine protein and simultaneously lives close to the coast, rapid access to the marine environment directly contributes to the poor state of coastal coral reefs (Campbell et al. 2020).
Remote reefs are often less affected by overfishing because fewer fishers can access sites (Edgar et al. 2014; Cinner et al. 2018). Fish biomass in remote Pacific reefs can exceed that of mainland reefs by more than 300% (Stevenson et al. 2007; Williams et al. 2011). Yet, their remoteness can make effective policing more difficult and, as a result, they are more likely to be affected by illegal or destructive fishing (Williams et al. 2011; Chapsos et al. 2019). Remote reefs around oceanic islands can harbour rich species assemblages that differ distinctly from those on mainland reefs (Hobbs et al. 2012). They can be refuges for megafauna and serve as important nesting grounds for turtles, nurseries for sharks, or attract spawning aggregations of commercially important fish species (Letessier et al. 2019; Wagner et al. 2020). These characteristics make them of interest for fisheries, but also of high value for conservation and tourism (Cinner et al. 2016; Friedlander et al. 2016).
The Banda Sea in central Indonesia is considered of high marine conservation concern (Huffard et al. 2012; Fajariyanto et al. 2019; Purwanto et al. 2022). Its central location in the Indonesian Throughflow and high diversity in different reef habitats make it a connectivity corridor for coral-reef species in the Coral Triangle (Kool et al. 2011). The islands in this deep ocean basin are important breeding grounds for turtles and seabirds, and the area is an important fishing ground for pelagic species such as tuna (Huffard et al. 2012). Multiple small, uninhabited islands are found throughout the centre of the Banda Sea, none of the coral reefs around these islands are currently marine protected areas. The reefs around these islands are visited by fishermen and scuba divers, yet little is known about the condition of these remote reefs.
In this study, we surveyed the previously unstudied coral reefs around the Lucipara islands, a remote island group in the central Banda Sea. We specifically aimed to establish baseline understanding of the coral-reef assemblages by investigating (1) the diversity, abundance and biomass of reef fishes across different sites, (2) the diversity and percentage cover of benthic communities across different sites, (3) how differences in the benthic communities are reflected in the abundance and diversity of fish assemblages, and (4) how fish biomass differed between trophic levels.
Materials and methods
Survey location and methods
Surveys were conducted on the coral reefs of the Lucipara islands (5°25′S, 127°38′E) in the Banda Sea, Indonesia, between 26 and 29 October 2019 (Research permit: FPIK Unpatti – 3051/UN13.1.7/DT/2019). This uninhabited group consists of seven small coral cay islands at more than 10 h of travel time (210 km) south from the closest large population centre, Ambon. Survey sites were representative of the reefs around the island group, consisting of steep walls descending to a depth below 200 m. Two sites (LUC1, LUC2) were surveyed in the Lucipara group, and two sites (LUC3, LUC4) in the Penyu group within the Lucipara islands (Fig. 1). All surveys were conducted at a depth of 8 m, just below the crest of the wall and parallel to the reef contour. Small sections of sloping reef were intermittently present at this depth on all sites. Four replicate underwater visual census (UVC)-belt transects were conducted by scuba diving at each survey site, totalling 16 transects or a combined surface area of 4000 m2 (Fig. 1). Following standard UVC methods (Edgar et al. 2014; Emslie et al. 2015; Cinner et al. 2016), two experienced observers identified and counted non-cryptic fishes (see Table S1 in the Supplementary material for full species list) at species level and estimated fish length to the closest centimetre along a belt transect of 50 × 5 m (250 m2 per transect, 1000 m2 per site). Swimming along the belt transect next to each other, one diver counted small-bodied fish families (e.g. Pomacentridae) and the other diver counted large-bodied fish families (e.g. Acanthuridae), preventing double observations and ensuring data quality. On wall sections, the transect was defined as 2.5 m above and below the transect line and 5 m towards open water. Following the fish observers, two observers identified and counted (number of individuals per transect) macroalgae (2- × 30-m belt transect) and non-cryptic macro-invertebrates (5- × 30-m belt transect), at genus level or species level where possible (see Table S2 of the Supplementary material for full species list). A final diver took 30 pictures of the benthos at 1.5-m intervals overlaid by a 1- × 1-m quadrat across the 50-m transect, to assess the benthic cover.

|
Data analyses
Fish abundance and total lengths were used to calculate biomass with the weight (W)–length (L) relationship (Eqn 1, Froese et al. 2014), on the basis of species-specific length–weight parameters from FishBase (ver. 12/2019, R. Froese and D. Pauly, see http://www.fishbase.org).

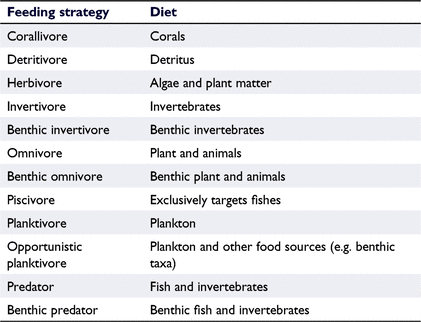
When parameters were not available for specific species, parameters of a closely related species in the same genus were used instead. Trophic level, dominant diet, and the maximum length of species were downloaded from FishBase in R (R Foundation for Statistical Computing, Vienna, Austria) by using the package rfishbase (ver. 4.0.0, see https://cran.r-project.org/package=rfishbase; Boettiger et al. 2012). Fish species were then categorised into trophic niches as a combination of their maximum size (small, <20 cm; medium, 20–50 cm; large, 50–200 cm; very large, >200 cm) and diet-based feeding strategy (Table 1, species list in Table S4 in the Supplementary material).
|
Photos of the benthos were analysed using the Coral Point Count with Excel extension (CPCe) software package to estimate benthic cover (ver. 4.1, see https://hcas.nova.edu/tools-and-resources/cpce/index.html; Kohler and Gill 2006). Twenty random points were placed over each 1-m2 photo quadrat (total of 600 points per transect) and benthic category was defined for each point. Benthos below each point was classified into 17 different benthic categories (see Table S2 in the Supplementary material for full details per category). Because of the low cover of specific categories, the decision was made to combine detailed categories into six more general benthic classifications. Categories with a combined benthic cover lower than 1% for all transects were removed (e.g. molluscs, ascidians, bryozoans). The general benthic categories were classified as ‘abiotic’ (combined cover of rock, sand and rubble), ‘hard coral’ (e.g. branching coral, encrusting coral), ‘other cnidarian’ (e.g. Millepora sp., hydroids, seafans), ‘algae’, ‘soft coral’ and ‘sponges’.
Curation and visualisation of univariate data (benthic cover categories, biomass per niche and trophic levels) were conducted in R (ver. 4.0, R Foundation for Statistical Computing) using the tidyverse package (ver. 1.3.2, see https://cran.r-project.org/package=tidyverse; Wickham et al. 2019). Data were first tested for normality and subsequent ANOVA or Kruskal–Wallis (K–W) tests were conducted for normal and non-parametric data respectively. Post hoc Tukey tests or Dunn’s tests with Bonferroni correction were conducted for significantly different results. Benthic cover was plotted using the yarrr package (ver. 0.1.2, see https://cran.r-project.org/package=yarrr; Phillips 2017).
Multivariate data were analysed using Primer (ver. 7, see https://www.primer-e.com/; Clarke and Gorley 2015). Fish assemblage (diversity and abundance) and biomass data were square-root transformed and analysed with PERMANOVA (Bray–Curtis resemblance matrix, 9999 permutations). Subsequent pairwise testing was performed using Monte Carlo corrections. Differences in benthic cover assemblages among sites were compared using ANOSIM (Euclidean distance resemblance matrix, 9999 permutations) (Anderson et al. 2008). Fish assemblage data (diversity and abundance) were visualised using principal-coordinate analysis and overlaid with correlating fish species (Spearman R > 0.8).
To explore the link between benthic cover (from CPCe data) and fish assemblages (total diversity and abundance), we ran distance-based linear models (DistLM) in Primer (ver. 7; Clarke and Gorley 2015). For this analysis, we used the detailed benthic categories (see the ‘Detailed results – PERMANOVA fish’ section in the Supplementary material) rather than the six combined general categories to increase resolution. Prior to analysis, benthic categories with less than 1% cumulative cover combined over all transects were excluded, as well as variables strongly correlated with each other (r > ±0.75). The categories that were excluded were ‘bryozoans’, ‘foliose coral’, and ‘branching coral’. DistLM models were selected on the basis of the Akaike information criterion corrected to account for the small sample size (AICc) and multiple-predictor variables (Anderson et al. 2008). The fish assemblage was plotted using a distance-based redundancy analysis (dbRDA) and overlayed with benthic predictor variables.
Results
Fish diversity, abundance and biomass
Across the four survey sites, we counted 205 non-cryptic fish species (total N = 32 349). The most abundant fish species were small-bodied planktivorous species Pseudanthias dispar (N = 7250), Chromis margaritifer (N = 6386), and L. tapeinosoma (N = 2511). Total (mean ± s.e.) fish abundance per 250-m2 transect was 2022 ± 236.1.
Multivariate analyses showed that the fish assemblages (diversity and abundance) were significantly different among sites (pseudo-F, 4.125; d.f., 3; P < 0.001; Fig. 2a, PCA abundance). Pairwise analyses indicated that fish assemblages differed significantly between each pair of sites, except for LUC3 and LUC4, which were not significantly different from each other (detailed results in Table S3 in the Supplementary material). The site with the highest fish abundance was LUC2, followed by LUC1, LUC4, and LUC3 (Table 2).

|

|
Fish biomass (mean ± s.e.) per 250-m2 transect was 143.1 ± 33.5 kg (5724 kg ha−1), with Melichthys niger contributing the highest biomass among all species (289.5 kg summed across all surveys). Multivariate analyses of fish diversity and biomass indicated significant differences among sites (d.f., 3; pseudo-F, 3.438; P < 0.001). The site with the highest fish biomass was LUC2, followed by LUC1, LUC3, and LUC4 (Table 2). Pairwise analysis indicated that differences in fish biomass were significant between LUC1 and LUC4 (P = 0.042), LUC2 and LUC3 (P = 0.026), and LUC2 and LUC4 (P = 0.008; Fig. 2b). Only sites LUC3 and LUC4 were not significantly different from each other (Fig. 2b; also see Table S3 the Supplementary material). Principal-coordinate analysis plots illustrated that Ctenochaetus striatus was closely associated with LUC1 for both abundance and biomass. Pseudanthias smithvanizi was correlated with sites LUC3 and LUC4 for abundance, but not biomass. Fish species with abundance correlated with LUC2 were L. tapeinosoma and Acanthurus pyroferus. When considering biomass for LUC2, five other species, including Cephalopholis urodeta, Zebrasoma scopas and Balistoides conspicillum, also showed strong correlations. A. pyroferus remained strongly correlated with LUC2, suggesting that this species is characteristic of the site.
Diversity and percentage cover of benthic communities
We found 13 algae species, with the most abundant species being Halimeda opuntia (N = 4554), Halimeda cylindracea (N = 1096) and Lobophora sp. (N = 182). Of the 30 invertebrate species that were counted, the most abundant ones included Christmas tree worms, Spirobranchus sp. (N = 208), and two crinoid species, namely, Capillaster sentosus (N = 138), and Comanthus parvicirrus (N = 133).
Hard-coral cover (mean ± s.e.) across sites was 33.6% ± 2.0 s.e.. Abiotic cover (combined cover of rock, sand and rubble) was 32.5% ± 3.4 s.e., soft-coral cover was 12.5% ± 2.6 s.e., algal cover 7.4% ± 2.3 s.e., other cnidarian cover 6.4% ± 2.7 s.e. and sponge cover 6.1% ± 1.6 s.e. (Fig. 3). The highest percentage cover of specific categories with the ‘hard-coral’ category were encrusting corals (mean, 15.9% ± 1.6 s.e.). The abiotic cover consisted mainly of bare rock (mean 28.9% ± 3.1 s.e.). The category ‘other cnidarian’ included Dendrophyllia sp., hydroids, Millepora sp. and sea fans. At LUC4 only, this category was strongly dominated by Dendrophyllia sp., with a mean cover of 17.2% ± 8.0 s.e., compared with a cover of 1.2% ± 0.8 s.e. at the other three sites.
Multivariate analysis indicated that benthic-cover composition varied significantly across sites (R = 0.668; P < 0.001), and pairwise multivariate analyses showed that benthic cover differed between all pairs of sites except between LUC2 and LUC3, and LUC3 and LUC4 (see the ‘Detailed results – benthic cover’ section in the Supplementary material). Pairwise ANOVA tests per benthic category showed that significant differences exist among sites for all benthic categories, except for sponges (Fig. 3, also see the ‘Detailed results – benthic cover’ section in the Supplementary material). Site LUC1 had the highest mean coral cover (42.3%) compared with 27.5% at site LUC4. Mean abiotic cover ranged from 23.04% at site LUC3 to 52.17% at LUC1. Soft-coral cover was highest at sites LUC2 and LUC3. Algal cover was highest at sites LUC3 and LUC4. The cover of ‘other cnidarians’ was low at most sites, except for site LUC4, where this category had a mean cover of 18.8%.

|
Benthic predictors of fish assemblages
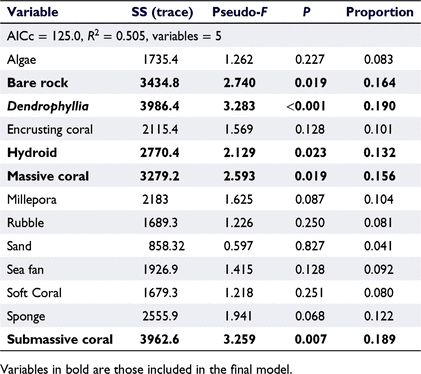
The final distance-based linear model explained 50.5% of the variation in fish assemblages (abundance and diversity; AICc, 125.0) and incorporated five benthic categories, including bare rock, Dendrophyllia, hydroids, massive corals, and submassive corals (Table 3). The distance-based redundancy-analysis (dbRDA) plot confirmed this model and showed a clear separation of sites, with a strong influence of Dendrophyllia on transects at Site LUC4 compared with Site LUC1 (Fig. 4). The dbRDA plot also illustrated the role of hard corals and bare rock in structuring fish assemblages across Sites LUC2 and LUC4, and LUC1 and LUC3 respectively.
|

|
Trophic structure
The combined biomass across the Lucipara sites (biomass summed per trophic level (TL) for the surveyed area per site (=1000 m2)) showed a bimodal signal, with the highest biomass in high (TL > 4) and low (TL < 2.5) trophic levels at 656.7 kg (mean per site, 41.0 kg ± 18.6 s.e.) and 636.3 kg (mean per site, 39.7 kg ± 9.9 s.e.) respectively (Fig. 5a). The biomass differences between trophic levels were significant (K–W: χ2 = 46.47, d.f. = 4, P < 0.001), with post hoc tests showing significant differences among trophic levels: TL < 2.5 v. TL > 4 (P = 0.002); TL < 2.5 v. TL 3.01–3.5 (P < 0.001); TL 2.51–3.0 v. TL 3.01–3.5 (P = 0.001); TL 2.51–3.0 v. TL > 4 (P = 0.02); TL 3.01–3.4 v. TL 3.51–4.0 (P < 0.001); and between TL 3.51–4.0 v. TL > 4 (P < 0.001). The bimodal trend was also apparent when investigating the mean biomass at site level (Fig. 5c). There were significant differences in trophic level mean biomass among sites for all trophic levels except for TL 2.51–3.0 (see Table S5 in the Supplementary material). Contrastingly, Sites LUC3 and LUC4 were not significantly different from each other for any of the trophic levels (see Table S6 section in the Supplementary material).

|
When considering only feeding strategy and not maximum total length, the summed biomass across survey sites was highest for predatory fishes (736.9 kg), followed by planktivores (426.0 kg) and opportunistic planktivores (326.4 kg). Invertivores (8.4 kg), benthic omnivores (7.5 kg), and detritivores (6.4 kg) had the lowest biomass.
A more-detailed analysis of trophic niche biomass (=size class + feeding strategy, see Table S5 in the Supplementary material for details) showed that the biomasses of fishes in different niches were significantly different from each other (K–W: χ2 = 207.49, d.f. = 33, P < 0.001). The five niches with the highest fish biomass included three predator categories (very large; large; very large benthic) and two planktivorous categories (large opportunistic; medium; Fig. 5b, d). The trophic niche with the highest mean fish biomass across all sites was the ‘very large predator’ category (389.5 kg; mean per site, 24.3 kg ±15.8 s.e.). The next-heaviest trophic niche was the ‘large opportunistic planktivores’ category (316.7 kg; mean per site, 19.8 kg ± 2.8 s.e.), followed by ‘large predators’ (243.5 kg; mean per site, 15.2 ± 4.0 s.e.), ‘very large benthic predators’ (238.1 kg; mean per site, 14.9 kg ± 8.1 s.e.), and ‘medium planktivores’ (178.3 kg; mean per site, 11.1 kg ± 3.7 s.e.) (Fig. 5b, d). Differences in biomass among these five heaviest niches were significant only for comparisons with the ‘large opportunistic planktivore’ category. The biomass of ‘large opportunistic planktivores’ was significantly different from that of ‘very large predators’ (P < 0.001), ‘medium planktivores’ (P < 0.001) and ‘large predators’ (P < 0.001) (full results in Table S5). Looking at each of the five heaviest niches separately, post hoc pairwise analyses showed no site-specific differences in biomass for any niche except for the ‘large predator’ category. The biomass of ‘large predators’ was significantly different between Site LUC2 and every other site (LUC2–LUC1, P = 0.01; LUC2–LUC3, P = 0.004; LUC2–LUC4, P < 0.001; full results in Table S6). The biomass of ‘large predators’ and ‘very large predators’ might have been underestimated for all sites, because there were regular sightings of large sharks and tunas away from the survey transects for all sites.
Discussion
We have presented the first survey of the biodiversity and abundance of the coral-reef faunal communities around a remote island group in the Banda Sea, Indonesia, where we discovered high fish biomass that well exceeds the typically cited ‘conservation target’ or ‘pristine’ biomass (1150 kg ha−1; McClanahan et al. 2015; Campbell et al. 2020). Fish biomass was higher than in most other known coral reefs in Indonesia and the wider Coral Triangle region (Campbell et al. 2020; Ceccarelli et al. 2021). In particular, the biomass of large and predatory fishes, species targeted by fisheries, exceeded the typical biomass reported in Indonesian coral reefs (Welly et al. 2012; Wouthuyzen et al. 2018; Currier et al. 2019; Ceccarelli et al. 2021). At 33.6%, hard-coral cover was relatively low compared with other sites in the Banda region, which frequently reaches over 50% hard-coral cover (Currier et al. 2019; Ceccarelli et al. 2021; Purwanto et al. 2022). The fish diversity in the Lucipara coral reefs was in line with previously recorded diversity in the central Indonesian region, given the survey methods and depth (Campbell et al. 2020; Ihsan et al. 2020). Benthic cover explained more than 50% of the variance in fish abundance and diversity, with Dendrophyllia species, submassive corals, and bare rock as key predictors of fish assemblages. Our results indicated that the Lucipara islands coral reefs are among the least affected by human pressures in Indonesia and should be protected in a time of global declines in coral-reef condition.
With just over 200 species, fish species richness was similar or slightly lower than in neighbouring regions in the Coral Triangle (Allen and Werner 2002; Welly et al. 2012). Oceanic coral reefs frequently tend to have a lower diversity than do sites closer to the mainland because of their remoteness (Hobbs et al. 2012). However, our surveys did not target cryptobenthic fauna and were limited to only one, shallow, depth. Real fish diversity is therefore expected to be higher than we report here, but unlikely to exceed the high diversity found in the nearby diversity hotspot of Raja Ampat (Andradi-Brown et al. 2021). Surveys did indicate high fish abundance, particularly for plankton-feeding species such as P. dispar and L. tapeinosoma. Although hard-coral cover was lower than in Indonesian protected areas such as the Wakatobi National Park (>40%, Ahmadia et al. 2018), Ay-Rhun MPA (>50%, Ihsan et al. 2020), or Menjangan island (>59%, Dustan et al. 2013), hard-coral benthic cover was within the expected range for Indonesian coral reefs (Razak et al. 2021). All sites were very steep walls, exposed to seasonal monsoons, which could explain the relatively low hard-coral cover and high soft-coral cover. The typical conditions on near-vertical walls, such as limited light and space availability, are likely to result in less varied microhabitat availability than on sloping reefs. However, the strong currents and surrounding nutrient-rich deep waters provide excellent conditions for planktivorous fishes and associated predators (Gove et al. 2016).
Fish assemblages differed significantly among survey sites, except between the two sites in the Penyu Island group (LUC3 and LUC4). The benthic cover of reefs surveyed in this group had a high macroalgae cover and a notably higher cover of ‘other cnidarians’. This category was dominated by the azooxanthellate Dendrophyllia corals, which might indicate a higher proportion of shaded overhangs and caves, because azooxanthellate corals do not need sunlight to grow (Marshall and Clode 2004). The higher algae cover found at these sites might also indicate higher nutrient availability (Adam et al. 2021). Benthic variables on the site with the highest biomass, LUC2, did not differ from those on the other sites, so other environmental factors are likely to have played a role in shaping its fish assemblage. LUC2 faces east, whereas the other sites face north-west. This orientation could have provided shelter from the monsoon winds in the Banda Sea, which run along a south-east–north-west axis (Moore et al. 2003). The stronger current during surveys on this site, which had twice the biomass of other sites, also possibly affected the biomass of large predatory fish (e.g. sharks; Vianna et al. 2014).
Overall, the recorded fish biomass for each site exceeded that of published data from most sites in Indonesia. A recent review analysed UVC surveys of 622 coral-reef sites across Indonesia and found that the mean biomass of coral-reef fish per hectare ranged from 309 kg ha−1 in easily accessible sites to 1432 kg ha−1 in remote sites, but reported a maximum recorded biomass >17 000 kg ha−1 (Campbell et al. 2020). Biomass estimates in the Banda Sea in a recent local report averaged 1099 kg ha−1, with one site exceeding 2000 kg ha−1, but the report did not survey the Lucipara group (Currier et al. 2019). The mean biomass in Lucipara is within the higher estimates of this report, although multiple sites exceeded the highest reported biomass in other Banda Sea sites. The widely suggested ‘pristine’ biomass threshold to indicate a well-functioning coral reef has been estimated to be at least 1150 kg ha−1 (McClanahan et al. 2015). This means that reefs around the Lucipara islands can all be considered to have a high fish biomass, with LUC2 exceeding the ‘pristine’ threshold by a factor of 10.
The trophic structure of Lucipara fish communities showed a bimodal, almost concave, distribution, with the highest biomass being concentrated in high and low trophic levels. Low trophic-level biomass was dominated by planktivorous species such as Naso vlamingii and M. niger, whereas high trophic-level biomass included species such as sharks, groupers, and snappers. The high biomass of large predatory species and the concave shape of trophic-level distributions indicated that the reefs around the Lucipara group do not experience high fishing pressures (Friedlander and DeMartini 2002; Graham et al. 2017). Similar trophic structures are typical for remote Hawaiian coral reefs, where predator biomass made up to 54% of the total fish biomass in sites with limited fishing activity (Friedlander and DeMartini 2002).
In the case of Lucipara, we hypothesise that high predatory biomass is supported by pelagic food subsidies through its abundant planktivorous fishes, which might be driving productivity in this area (Morais et al. 2021; Skinner et al. 2021). The importance of offshore pelagic subsidies to coral reefs is becoming increasingly clear and is, no doubt, vital to a remote oceanic reef system such as the one studied here (e.g. Morais and Bellwood 2019; Skinner et al. 2019; Skinner et al. 2021). Planktivorous fishes can dominate trophic pyramids in remote regions and protected areas (Russ et al. 2017; Campbell et al. 2020); however, to accurately test the trophic structure around Lucipara, both cryptobenthic species and pelagic biomass subsidies would need to be quantified more directly (Goatley et al. 2017; Brandl et al. 2019; Skinner et al. 2019).
Importantly, much of the high biomass on surveyed reefs represented species important for commercial and subsistence fisheries, such as dogtooth tuna (Gymnosarda unicolor), Maori wrasse (Cheilinus undulatus), milkfish (Chanos chanos), and snapper (Lutjanus monostigma) (Asian Development Bank 2014). The islands are 210 km away from the nearest large population centre (Ambon) and rough seas during the monsoon make the group inaccessible for more than 6 months of the year. The remote location and strong monsoon system are therefore likely to provide some natural protection and ‘passive conservation’ from the overfishing that is common in other regions in the Coral Triangle and coastal reefs in the Banda Sea (Cinner et al. 2018; Campbell et al. 2020; McClanahan 2020). However, the sites are certainly not untouched. Three fishing vessels, one of which was targeting groupers, were sighted while surveys were being conducted. The large turtle populations in the region have been targeted for food and religious rituals (Moss and Van Der Wal 1998; CITES 2019), yet, despite this, the area has no official protection. The remoteness of the island group seems to form a barrier to intensive fishing impacts, but also hinders effective policing against illegal or destructive fishing. Importantly, remoteness does not offer protection against the impacts of global climate change (Hughes et al. 2017).
Our surveys have provided much-needed information on coral reefs in one of Indonesia’s most data-poor regions. The Banda Sea is considered an Indonesian Conservation Priority area, on the basis of its high coral diversity, role in connectivity, and as a habitat for megafauna (Huffard et al. 2012; Fajariyanto et al. 2019). Despite its importance, very little is known about the conservation status of species across central Indonesia (Struebig et al. 2022). We have provided extensive data on fish assemblages, but high-resolution data on other taxa remain mostly lacking. Future survey efforts should also include cryptobenthic fishes and smaller invertebrates, but would ideally also cover charismatic megafauna such as turtles and sharks, which were commonly sighted off transects (De Brauwer and Burton 2018; Welly et al. 2012). Well established and emerging methods such as environmental DNA, drone surveys, or baited underwater remote video systems could be employed to maximise the outcomes of future data collection in the region (De Brauwer et al. 2018; Kelaher et al. 2019; Bani et al 2020; Langlois et al. 2020).
We described the fish assemblages and benthic cover of a remote group of coral reefs in Indonesia. The Lucipara islands support a coral-reef system with a high fish biomass and high abundance of large predatory fishes. These fish assemblages are likely to be protected by their remoteness, yet this remoteness will offer no protection against future climate-change impacts. Our data indicated that the coral reefs in the Banda Sea are among the healthiest reefs in Indonesia, emphasising the importance of protecting this glimmer of hope in a world of increasingly degraded coral reefs.
Supplementary material
Supplementary material is available online.
Data availability
Data will be made available upon reasonable request.
Conflicts of interest
The authors declare that they have no conflicts of interest.
Declaration of funding
This work was funded by a grant from the UK Newton Fund and Natural Environment Research Council (NERC) to M. Beger (grant number NE/S006931/1) and funding from Ristekdikti (Indonesia) (number 7/AMD/E1/KP.PTNBH/2020).
References
Adam, TC, Burkepile, DE, Holbrook, SJ, Carpenter, RC, Claudet, J, Loiseau, C, Thiault, L, Brooks, AJ, Washburn, L, and Schmitt, RJ (2021). Landscape-scale patterns of nutrient enrichment in a coral reef ecosystem: implications for coral to algae phase shifts. Ecological Applications 31, e2227.| Landscape-scale patterns of nutrient enrichment in a coral reef ecosystem: implications for coral to algae phase shifts.Crossref | GoogleScholarGoogle Scholar |
Ahmadia, GN, Tornabene, L, Smith, DJ, and Pezold, FL (2018). The relative importance of regional, local, and evolutionary factors structuring cryptobenthic coral–reef assemblages. Coral Reefs 37, 279–293.
| The relative importance of regional, local, and evolutionary factors structuring cryptobenthic coral–reef assemblages.Crossref | GoogleScholarGoogle Scholar |
Allen, GR (2008). Conservation hotspots of biodiversity and endemism for Indo-Pacific coral reef fishes. Aquatic Conservation: Marine and Freshwater Ecosystems 18, 541–556.
| Conservation hotspots of biodiversity and endemism for Indo-Pacific coral reef fishes.Crossref | GoogleScholarGoogle Scholar |
Allen, GR, and Werner, TB (2002). Coral reef fish assessment in the ‘coral triangle’ of southeastern Asia. Environmental Biology of Fishes 65, 209–214.
| Coral reef fish assessment in the ‘coral triangle’ of southeastern Asia.Crossref | GoogleScholarGoogle Scholar |
Anderson MJ, Gorley RN, Clarke KR (2008) ‘PERMANOVA+ for PRIMER: guide to software and statistical methods.’ (PRIMER-E: Plymouth, UK)
Andradi-Brown, DA, Beer, AJE, Colin, L, Hastuti, , Head, CEI, Hidayat, NI, Lindfield, SJ, Mitchell, CR, Pada, DN, Piesinger, NM, Purwanto, , and Ahmadia, GN (2021). Highly diverse mesophotic reef fish communities in Raja Ampat, West Papua. Coral Reefs 40, 111–130.
| Highly diverse mesophotic reef fish communities in Raja Ampat, West Papua.Crossref | GoogleScholarGoogle Scholar |
Asian Development Bank (2014) Economics of fisheries and aquaculture in the Coral Triangle. (Asian Development Bank) Available at http://hdl.handle.net/11540/769
Bani, A, De Brauwer, M, Creer, S, Dumbrell, AJ, Limmon, G, Jompa, J, von der Heyden, S, and Beger, M (2020). Informing marine spatial planning decisions with environmental DNA. Advances in Ecological Research 62, 375–407.
| Informing marine spatial planning decisions with environmental DNA.Crossref | GoogleScholarGoogle Scholar |
Boettiger, C, Lang, DT, and Wainwright, PC (2012). rfishbase: exploring, manipulating and visualizing FishBase data from R. Journal of Fish Biology 81, 2030–2039.
| rfishbase: exploring, manipulating and visualizing FishBase data from R.Crossref | GoogleScholarGoogle Scholar |
Brandl, SJ, Tornabene, L, Goatley, CHR, Casey, JM, Morais, RA, Côté, IM, Baldwin, CC, Parravicini, V, Schiettekatte, NMD, and Bellwood, DR (2019). Demographic dynamics of the smallest marine vertebrates fuel coral reef ecosystem functioning. Science 364, 1189–1192.
| Demographic dynamics of the smallest marine vertebrates fuel coral reef ecosystem functioning.Crossref | GoogleScholarGoogle Scholar |
Burke L, Reytar K, Spalding M, Perry A (2012) ‘Reefs at risk revisited in the Coral Triangle.’ (World Resources Institute: Washington, DC, USA)
Campbell, SJ, Darling, ES, Pardede, S, Ahmadia, G, Mangubhai, S, Estradivari, , and Maire, E (2020). Fishing restrictions and remoteness deliver conservation outcomes for Indonesia’s coral reef fisheries. Conservation Letters 13, e12698.
| Fishing restrictions and remoteness deliver conservation outcomes for Indonesia’s coral reef fisheries.Crossref | GoogleScholarGoogle Scholar |
Ceccarelli DM, Lestari AP, Rudyanto, White A (2021) Status of coral reefs and reef fish in 13 marine protected areas in Maluku, North Maluku and West Papua Provinces. United States Agency for the International Development (USAID) and the Government of Indonesia (GoI), Jakarta, Indonesia.
Chapsos, I, Koning, J, and Noortmann, M (2019). Involving local fishing communities in policy making: addressing illegal fishing in Indonesia. Marine Policy 109, 103708.
| Involving local fishing communities in policy making: addressing illegal fishing in Indonesia.Crossref | GoogleScholarGoogle Scholar |
Cinner, JE, Huchery, C, MacNeil, MA, Graham, NAJ, McClanahan, TR, Maina, J, Maire, E, Kittinger, JN, Hicks, CC, Mora, C, Allison, EH, et al. (2016). Bright spots among the world’s coral reefs. Nature 535, 416–419.
| Bright spots among the world’s coral reefs.Crossref | GoogleScholarGoogle Scholar |
Cinner, JE, Maire, E, Huchery, C, MacNeil, MA, Graham, NAJ, Mora, C, McClanahan, TR, Barnes, ML, Kittinger, JN, Hicks, CC, D’agata, S, et al. (2018). Gravity of human impacts mediates coral reef conservation gains. 115, E6116–E6125.
| Gravity of human impacts mediates coral reef conservation gains.Crossref | GoogleScholarGoogle Scholar |
CITES (2019) Status, scope and trends of the legal and illegal international trade in marine turtles, its conservation impacts, management options and mitigation priorities: Indonesia, Malaysia, Vietnam. CITES Report, volume 18, CITES, Da Nang, Viet Nam.
Clarke KK, Gorley RR (2015) ‘PRIMER V7: user manual/tutorial.’ (PRIMER-E Ltd: Plymouth, UK)
Clifton, J, and Foale, S (2017). Extracting ideology from policy: analysing the social construction of conservation priorities in the coral triangle region. Marine Policy 82, 189–196.
| Extracting ideology from policy: analysing the social construction of conservation priorities in the coral triangle region.Crossref | GoogleScholarGoogle Scholar |
Currier K, Capriati A, Ihsan E, Purwanto, Rijoly FN, Muljadi AH, Ahmad A, Widodo H (2019) Biophysical survey in the Ay Rhun MPA and Banda Islands, Maluku Province. Technical Report, Coral Triangle Center, Bali, Indonesia.
De Brauwer, M, and Burton, M (2018). Known unknowns: conservation and research priorities for soft sediment fauna that supports a valuable SCUBA diving industry. Ocean & Coastal Management 160, 30–37.
| Known unknowns: conservation and research priorities for soft sediment fauna that supports a valuable SCUBA diving industry.Crossref | GoogleScholarGoogle Scholar |
De Brauwer, M, Hobbs, J-PA, Ambo-Rappe, R, Jompa, J, and McIlwain, JL (2018). Biofluorescence as a survey tool for cryptic marine species. Conservation Biology 32, 706–715.
| Biofluorescence as a survey tool for cryptic marine species.Crossref | GoogleScholarGoogle Scholar |
Dustan, P, Doherty, O, and Pardede, S (2013). Digital reef rugosity estimates coral reef habitat complexity. PLoS ONE 8, e57386.
| Digital reef rugosity estimates coral reef habitat complexity.Crossref | GoogleScholarGoogle Scholar |
Edgar, GJ, Stuart-Smith, RD, Willis, TJ, Kininmonth, S, Baker, SC, Banks, S, Barrett, NS, Becerro, MA, Bernard, ATF, Berkhout, J, Buxton, CD, et al. (2014). Global conservation outcomes depend on marine protected areas with five key features. Nature 506, 216–220.
| Global conservation outcomes depend on marine protected areas with five key features.Crossref | GoogleScholarGoogle Scholar |
Emslie, MJ, Logan, M, Williamson, DH, Ayling, AM, MacNeil, MA, Ceccarelli, D, Cheal, AJ, Evans, RD, Johns, KA, Jonker, MJ, Miller, IR, Osborne, K, Russ, GR, and Sweatman, HPA (2015). Expectations and outcomes of reserve network performance following re-zoning of the Great Barrier Reef Marine Park. Current Biology 25, 983–992.
| Expectations and outcomes of reserve network performance following re-zoning of the Great Barrier Reef Marine Park.Crossref | GoogleScholarGoogle Scholar |
Fajariyanto Y, Green AL, Ramadyan F, Suardana N, Hakim L, Akbarur D, Rudyanto, McGowan J (2019) Designing a network of marine protected areas for fisheries management area 715 and six associated provinces in Indonesia. Report prepared by The Nature Conservancy for the USAID Sustainable Ecosystems Advanced Project. USAID.
Ferrol-Schulte, D, Gorris, P, Baitoningsih, W, Adhuri, DS, and Ferse, SCA (2015). Coastal livelihood vulnerability to marine resource degradation: a review of the Indonesian national coastal and marine policy framework. Marine Policy 52, 163–171.
| Coastal livelihood vulnerability to marine resource degradation: a review of the Indonesian national coastal and marine policy framework.Crossref | GoogleScholarGoogle Scholar |
Food and Agriculture Organization of the United Nations (2016) ‘The state of world fisheries and aquaculture 2016: contributing to food security and nutrition for all.’ (FAO: Rome, Italy)
Friedlander, AM, and DeMartini, EE (2002). Contrasts in density, size, and biomass of reef fishes between the northwestern and the main Hawaiian islands: the effects of fishing down apex predators. Marine Ecology Progress Series 230, 253–264.
| Contrasts in density, size, and biomass of reef fishes between the northwestern and the main Hawaiian islands: the effects of fishing down apex predators.Crossref | GoogleScholarGoogle Scholar |
Friedlander, AM, Wagner, D, Gaymer, CF, Wilhelm, T‘A, Lewis, N, Brooke, S, Kikiloi, K, and Varmer, O (2016). Co-operation between large-scale MPAs: successful experiences from the Pacific Ocean. Aquatic Conservation: Marine and Freshwater Ecosystems 26, 126–141.
| Co-operation between large-scale MPAs: successful experiences from the Pacific Ocean.Crossref | GoogleScholarGoogle Scholar |
Froese, R, Thorson, JT, and Reyes, RB (2014). A Bayesian approach for estimating length–weight relationships in fishes. Journal of Applied Ichthyology 30, 78–85.
| A Bayesian approach for estimating length–weight relationships in fishes.Crossref | GoogleScholarGoogle Scholar |
Goatley, CHR, González-Cabello, A, and Bellwood, DR (2017). Small cryptopredators contribute to high predation rates on coral reefs. Coral Reefs 36, 207–212.
| Small cryptopredators contribute to high predation rates on coral reefs.Crossref | GoogleScholarGoogle Scholar |
Gove, JM, McManus, MA, Neuheimer, AB, Polovina, JJ, Drazen, JC, Smith, CR, Merrifield, MA, Friedlander, AM, Ehses, JS, Young, CW, Dillon, AK, and Williams, GJ (2016). Near-island biological hotspots in barren ocean basins. Nature Communications 7, 10581.
| Near-island biological hotspots in barren ocean basins.Crossref | GoogleScholarGoogle Scholar |
Graham, NAJ, McClanahan, TR, MacNeil, MA, Wilson, SK, Cinner, JE, Huchery, C, and Holmes, TH (2017). Human disruption of coral reef trophic structure. Current Biology 27, 231–236.
| Human disruption of coral reef trophic structure.Crossref | GoogleScholarGoogle Scholar |
Hobbs, J-PA, Jones, GP, Munday, PL, Connolly, SR, and Srinivasan, M (2012). Biogeography and the structure of coral reef fish communities on isolated islands. Journal of Biogeography 39, 130–139.
| Biogeography and the structure of coral reef fish communities on isolated islands.Crossref | GoogleScholarGoogle Scholar |
Huffard CL, Erdmann MV, Gunawan TRP (Eds) (2012) Geographic priorities for marine biodiversity conservation in Indonesia. Ministry of Marine Affairs and Fisheries and Marine Protected Areas Governance Program, Jakarta, Indonesia.
Hughes, TP, Barnes, ML, Bellwood, DR, Cinner, JE, Cumming, GS, Jackson, JBC, Kleypas, J, van de Leemput, IA, Lough, JM, Morrison, TH, Palumbi, SR, van Nes, EH, and Scheffer, M (2017). Coral reefs in the Anthropocene. Nature 546, 82–90.
| Coral reefs in the Anthropocene.Crossref | GoogleScholarGoogle Scholar |
Ihsan EN, Purwanto, Korebima M, Kasman, Suardana IN, Junaidin LO, Asikin I, Marassabessy S (2020) Rencana Pengelolaan dan Zonasi KKP Ay Rhun [Ay Rhun MPA Management and Zoning Plan]. Dinas Kelautan dan Perikanan Provinsi Maluku, Kota Ambon, Maluku, Indonesia.
Kelaher, BP, Peddemors, VM, Hoade, B, Colefax, AP, and Butcher, PA (2019). Comparison of sampling precision for nearshore marine wildlife using unmanned and manned aerial surveys. Journal of Unmanned Vehicle Systems 8, 30–43.
| Comparison of sampling precision for nearshore marine wildlife using unmanned and manned aerial surveys.Crossref | GoogleScholarGoogle Scholar |
Kohler, KE, and Gill, SM (2006). Coral Point Count with Excel extensions (CPCe): a Visual Basic program for the determination of coral and substrate coverage using random point count methodology. Computers and Geosciences 32, 1259–1269.
| Coral Point Count with Excel extensions (CPCe): a Visual Basic program for the determination of coral and substrate coverage using random point count methodology.Crossref | GoogleScholarGoogle Scholar |
Kool, JT, Paris, CB, Barber, PH, and Cowen, RK (2011). Connectivity and the development of population genetic structure in Indo-West Pacific coral reef communities. Global Ecology and Biogeography 20, 695–706.
| Connectivity and the development of population genetic structure in Indo-West Pacific coral reef communities.Crossref | GoogleScholarGoogle Scholar |
Langlois, T, Goetze, J, Bond, T, Monk, J, Abesamis, RA, Asher, J, Barrett, N, Bernard, ATF, Bouchet, PJ, Birt, MJ, Cappo, M, Currey-Randall, LM, Driessen, D, Fairclough, DV, Fullwood, LAF, Gibbons, BA, Harasti, D, Heupel, MR, Hicks, J, Holmes, TH, Huveneers, C, Ierodiaconou, D, Jordan, A, Knott, NA, Lindfield, S, Malcolm, HA, McLean, D, Meekan, M, Miller, D, Mitchell, PJ, Newman, SJ, Radford, B, Rolim, FA, Saunders, BJ, Stowar, M, Smith, ANH, Travers, MJ, Wakefield, CB, Whitmarsh, SK, Williams, J, and Harvey, ES (2020). A field and video annotation guide for baited remote underwater stereo-video surveys of demersal fish assemblages. Methods in Ecology and Evolution 11, 1401–1409.
| A field and video annotation guide for baited remote underwater stereo-video surveys of demersal fish assemblages.Crossref | GoogleScholarGoogle Scholar |
Letessier, TB, Mouillot, D, Bouchet, PJ, Vigliola, L, Fernandes, MC, Thompson, C, Boussarie, G, Turner, J, Juhel, J-B, Maire, E, Caley, MJ, Koldewey, HJ, Friedlander, A, Sala, E, and Meeuwig, JJ (2019). Remote reefs and seamounts are the last refuges for marine predators across the Indo-Pacific. PLOS Biology 17, e3000366.
| Remote reefs and seamounts are the last refuges for marine predators across the Indo-Pacific.Crossref | GoogleScholarGoogle Scholar |
McClanahan, TR (2020). Wilderness and conservation policies needed to avoid a coral reef fisheries crisis. Marine Policy 119, 104 022.
| Wilderness and conservation policies needed to avoid a coral reef fisheries crisis.Crossref | GoogleScholarGoogle Scholar |
McClanahan, TR, Graham, NAJ, MacNeil, MA, and Cinner, JE (2015). Biomass-based targets and the management of multispecies coral reef fisheries. Conservation Biology 29, 409–417.
| Biomass-based targets and the management of multispecies coral reef fisheries.Crossref | GoogleScholarGoogle Scholar |
MacNeil, AM, Chapman, DD, Heupel, M, Simpfendorfer, CA, Heithaus, M, Meekan, M, Harvey, E, Goetze, J, Kiszka, J, Bond, ME, Currey-Randall, LM, et al. (2020). Global status and conservation potential of reef sharks. Nature 583, 801–806.
| Global status and conservation potential of reef sharks.Crossref | GoogleScholarGoogle Scholar |
Marshall, AT, and Clode, P (2004). Calcification rate and the effect of temperature in a zooxanthellate and an azooxanthellate scleractinian reef coral. Coral Reefs 23, 218–224.
Moore, TS, Marra, J, and Alkatiri, A (2003). Response of the Banda Sea to the southeast monsoon. Marine Ecology Progress Series 261, 41–49.
| Response of the Banda Sea to the southeast monsoon.Crossref | GoogleScholarGoogle Scholar |
Morais, RA, and Bellwood, DR (2019). Pelagic subsidies underpin fish productivity on a degraded coral reef. Current Biology 29, 1521–1527.e6.
| Pelagic subsidies underpin fish productivity on a degraded coral reef.Crossref | GoogleScholarGoogle Scholar |
Morais, RA, Siqueira, AC, Smallhorn-West, PF, and Bellwood, DR (2021). Spatial subsidies drive sweet spots of tropical marine biomass production. PLoS Biology 19, e3001435.
| Spatial subsidies drive sweet spots of tropical marine biomass production.Crossref | GoogleScholarGoogle Scholar |
Moss, SM, and van der Wal, M (1998). Rape and run in Maluku: exploitation of living marine resources in eastern Indonesia. Cakalele 9, 85–97.
Phillips, ND (2017). Yarrr! The pirate’s guide to R. APS Observer 30, .
Purwanto, Kasman , Sanjaya W, Ihsan EN, Purnama R, Mainassy J, Sianta R, Widodo H (2022) Status of coral reef health of Ay-Rhun Islands MPA and Banda Islands MPA Network 2021. Marine and Fisheries Department of Maluku Province and Coral Triangle Center.
Razak, TB, Ramadhani, BA, Corni, S, Roelfsema, C, Markey, K, Bambic, B, De Brauwer, M, Masdar, H, Purnama, R, Dumbrell, AJ, Jompa, J, Limmon, GV, Beger, M, and Fox, HE (2021). Large scale study of benthic communities in Eastern Indonesia’s reef systems. Regional Studies in Marine Science 44, 101731.
| Large scale study of benthic communities in Eastern Indonesia’s reef systems.Crossref | GoogleScholarGoogle Scholar |
Russ, GR, Aller-Rojas, OD, Rizzari, JR, and Alcala, AC (2017). Off-reef planktivorous reef fishes respond positively to decadal-scale no-take marine reserve protection and negatively to benthic habitat change. Marine Ecology 38, e12442.
| Off-reef planktivorous reef fishes respond positively to decadal-scale no-take marine reserve protection and negatively to benthic habitat change.Crossref | GoogleScholarGoogle Scholar |
Salomon, AK, Gaichas, SK, Shears, NT, Smith, JE, Madin, EMP, and Gaines, SD (2010). Key features and context-dependence of fishery-induced trophic cascades. Conservation Biology 24, 382–394.
| Key features and context-dependence of fishery-induced trophic cascades.Crossref | GoogleScholarGoogle Scholar |
Skinner, C, Newman, SP, Mill, AC, Newton, J, and Polunin, NVC (2019). Prevalence of pelagic dependence among coral reef predators across an atoll seascape. Journal of Animal Ecology 88, 1564–1574.
| Prevalence of pelagic dependence among coral reef predators across an atoll seascape.Crossref | GoogleScholarGoogle Scholar |
Skinner, C, Mill, AC, Fox, MD, Newman, SP, Zhu, Y, Kuhl, A, and Polunin, NVC (2021). Offshore pelagic subsidies dominate carbon inputs to coral reef predators. Science Advances 7, eabf3792.
Stevenson, C, Katz, LS, Micheli, F, Block, B, Heiman, KW, Perle, C, Weng, K, Dunbar, R, and Witting, J (2007). High apex predator biomass on remote Pacific islands. Coral Reefs 26, 47–51.
| High apex predator biomass on remote Pacific islands.Crossref | GoogleScholarGoogle Scholar |
Struebig, M, Aninta, AG, Beger, M, Bani, A, Baru, H, Brace, S, Davies, Z, et al. (2022). Safeguarding imperiled biodiversity and evolutionary processes in the Wallacea center of endemism. BioScience 72, 1118–1130.
| Safeguarding imperiled biodiversity and evolutionary processes in the Wallacea center of endemism.Crossref | GoogleScholarGoogle Scholar |
Teh, LSL, Teh, LCL, and Sumaila, UR (2013). A global estimate of the number of coral reef fishers. PLoS ONE 8, e65397.
| A global estimate of the number of coral reef fishers.Crossref | GoogleScholarGoogle Scholar |
Tranter, SN, Estradivari, , Ahmadia, GN, Andradi-Brown, DA, Muenzel, D, Agung, F, Amkieltiela, , Ford, AK, Habibi, A, Handayani, CN, Iqbal, M, Krueck, NC, Lazuardi, ME, Muawanah, U, Papilaya, RL, Razak, TB, Sapari, A, Sjahruddin, FF, Veverka, L, Yusri, S, and Beger, M (2022). The inclusion of fisheries and tourism in marine protected areas to support conservation in Indonesia. Marine Policy 146, 105301.
| The inclusion of fisheries and tourism in marine protected areas to support conservation in Indonesia.Crossref | GoogleScholarGoogle Scholar |
Trialfhianty TI, Dixon A, Andradi-Brown DA, Estradivari, Mahajan S, Snyder R, Prabuning D, Rusandi A, Hakim A, Sapari A, Beger M (2020) Chapter 9. Climate change and marine protected areas. In ‘Management of marine protected areas in Indonesia: status and challenges’. (Ed. A Rusandi et al.) pp. 221–239. (Kementerian Kelautan dan Perikananand Yayasan WWF Indonesia: Jakarta, Indonesia)
Vianna, GMS, Meekan, MG, Bornovski, TH, and Meeuwig, JJ (2014). Acoustic telemetry validates a citizen science approach for monitoring sharks on coral reefs. PLOS ONE 9, e95565.
| Acoustic telemetry validates a citizen science approach for monitoring sharks on coral reefs.Crossref | GoogleScholarGoogle Scholar |
Wagner, D, Friedlander, AM, Pyle, RL, Brooks, CM, Gjerde, KM, and Wilhelm, T‘A (2020). Coral reefs of the high seas: hidden biodiversity hotspots in need of protection. Frontiers in Marine Science 7, 567428.
| Coral reefs of the high seas: hidden biodiversity hotspots in need of protection.Crossref | GoogleScholarGoogle Scholar |
Welly M, Djohani R, Suharsono, Green AL, Muljadi A, Korebima M, Hehuat Y, Alik R, Rijoli N (2012) Marine rapid assessment of the Banda Islands, Maluku Tengah, Indonesia. Coral Triangle Center.
Wickham, H, Averick, M, Bryan, J, Chang, W, McGowan, LD, François, R, Grolemund, G, Hayes, A, Henry, L, Hester, J, Kuhn, M, Pedersen, TL, Miller, E, Bache, SM, Müller, K, Ooms, J, Robinson, D, Seidel, DP, Spinu, V, Takahashi, K, Vaughan, D, Wilke, C, Woo, K, and Yutani, H (2019). Welcome to the tidyverse. Journal of Open Source Software 4, 1686.
| Welcome to the tidyverse.Crossref | GoogleScholarGoogle Scholar |
Williams, ID, Richards, BL, Sandin, SA, Baum, JK, Schroeder, RE, Nadon, MO, Zgliczynski, B, Craig, P, McIlwain, JL, and Brainard, RE (2011). Differences in reef fish assemblages between populated and remote reefs spanning multiple archipelagos across the Central and Western Pacific. Journal of Marine Biology 2011, 826234.
| Differences in reef fish assemblages between populated and remote reefs spanning multiple archipelagos across the Central and Western Pacific.Crossref | GoogleScholarGoogle Scholar |
Wouthuyzen, S, Hukom, FD, Makatipu, P, and Pelasula, D (2018). Reef fish stocks assessment around the islands in the Banda Sea for supporting local community livelihood. IOP Conference Series: Earth and Environmental Science 184, 012009.
| Reef fish stocks assessment around the islands in the Banda Sea for supporting local community livelihood.Crossref | GoogleScholarGoogle Scholar |
Yulianto, I, Booth, H, Ningtias, P, Kartawijaya, T, Santos, J, Sarmintohadi, , Kleinertz, S, Campbell, SJ, Palm, HW, and Hammer, C (2018). Practical measures for sustainable shark fisheries: lessons learned from an Indonesian targeted shark fishery. PLoS ONE 13, e0206437.
| Practical measures for sustainable shark fisheries: lessons learned from an Indonesian targeted shark fishery.Crossref | GoogleScholarGoogle Scholar |