

Landscape composition influences local pattern of fire size in the eastern Canadian boreal forest: role of weather and landscape mosaic on fire size distribution in mixedwood boreal forest using the Prescribed Fire Analysis System
Christelle Hély A E , C. Marie-Josée Fortin B , Kerry R. Anderson C and Yves Bergeron DA Centre Européen de Recherche et d’Enseignement des Géosciences de l’Environnement (CEREGE), CNRS UMR 6635, Université Aix-Marseille, Europôle de l’Arbois, BP 80, F-13545 Aix en Provence, Cedex 4, France.
B Department of Ecology and Evolutionary Biology, University of Toronto, 25 Harbord Street, Toronto, ON, M5S 3G5, Canada.
C Northern Forestry Centre, 5320 122nd Street, Edmonton, AB, T6H 3S5, Canada.
D Université du Québec en Abitibi-Témiscamingue, 445, Boulevard de l’Université, Rouyn-Noranda, QC, J9X 5E4, Canada.
E Corresponding author. Email: hely@cerege.fr
International Journal of Wildland Fire 19(8) 1099-1109 https://doi.org/10.1071/WF09112
Submitted: 15 October 2009 Accepted: 3 August 2010 Published: 10 December 2010
Journal Compilation © IAWF 2010
Abstract
Wildfire simulations were carried out using the Prescribed Fire Analysis System (PFAS) to study the effect of landscape composition on fire sizes in eastern Canadian boreal forests. We used the Lake Duparquet forest as reference, plus 13 forest mosaic scenarios whose compositions reflected lengths of fire cycle. Three fire weather risks based on duff moisture were used. We performed 100 simulations per risk and mosaic, with topography and hydrology set constant for the reference. Results showed that both weather and landscape composition significantly influenced fire sizes. Weather related to fire propagation explained almost 79% of the variance, while landscape composition and weather conditions for ignition explained ∼14 and 2% respectively. In terms of landscape, burned area increased with increasing presence of shade-tolerant species, which are related to long fire cycles. Comparisons among the distributions of cumulated area burned from scenarios plus those from the Société de Protection des Forêts contre le Feu database archives showed that PFAS simulated realistic fire sizes using the 80–100% class of probable fire extent. Future analyses would best be performed on a larger region as the limited size of the study area could not capture fires larger than 11 000 ha, which represent 3% of fires but 65% of the total area burned at the provincial scale.
Additional keywords: Canadian Duff Moisture Code, fire cycle, PFAS model, Quebec, scenarios.
Introduction
Wildfires are one of the major natural disturbances that shape boreal forests in terms of stand composition, age and spatial distribution (Johnson 1992; Shugart et al. 1992). Complex relationships exist between climate, mosaic composition and fire regime. The fire cycle, one component of the fire regime, is defined as the time needed to burn an area equal in size to the studied area (Whelan 1995), and it directly influences forest composition. In the Eastern Canadian boreal forest, the shorter the fire cycle, the higher the dominance of shade-intolerant species that regenerate first after fire (Bergeron and Dansereau 1993). Under a longer fire cycle, shade-tolerant species with slower growth rates will dominate the mosaic.
In the context of forest management, sustainable development practices have attempted to emulate the natural dynamics of forest (Burton et al. 2003; Drever et al. 2006; Gauthier et al. 2009). More particularly, harvest rotations inspired by the natural fire regime, such as fire frequency and fire cycle, would better respect the natural distribution of forest stands in the landscape mosaic in terms of composition and proportion (Bergeron et al. 2002; Fenton et al. 2009). The present study aims to analyse the effect of the landscape mosaic composition on fire propagation by evaluating fire size distribution for different mosaic compositions under different weather conditions from fire ignition to extinction. The different mosaic composition scenarios would reflect several lengths of the fire cycles. Fire sizes are simulated using the Prescribed Fire Analysis System (PFAS), a long-term climate-based probabilistic system developed by the Canadian Forest Service (Anderson 2010). Comparisons of these results with observed burned area distribution collected from Quebec’s provincial archives (F. Lefebvre, pers. comm.) are discussed.
Material and methods
Study area and scenarios of forest and fuel mosaics
The reference forest mosaic used in this study (Fig. 1) is the 11 000-ha natural forest mosaic located in the Lake Duparquet Research and Teaching Forest (Harvey 1999). This region is located in the Clay Belt of north-western Quebec (48°30′N, 79°20′W), a large physiographic region characterised by lacustrine clay deposits left by the proglacial lakes Barlow and Ojibway (Vincent and Hardy 1977). Lake Duparquet is situated at the southern limit of the boreal forest in the Missinaibi–Cabonga section (Rowe 1972). The area surrounding the lake has forest stands that have never been commercially harvested. They are characterised by an association of balsam fir (Abies balsamea (L.) Mill.), black spruce (Picea mariana (Mill.) BSP), paper birch (Betula papyrifera Marsh.), white spruce (Picea glauca (Moench) Voss), and trembling aspen (Populus tremuloides Michx.).

|
For the purposes of this study, 13 forest mosaic scenarios were created by changing the reference forest stand composition according to different lengths of the fire cycle (Table 1). All abiotic components (topography, water bodies, non-forested stands and total area) remained unchanged for each of the scenarios. Within each new mosaic, stand substitution was conducted by randomly selecting stands and allocating new forest compositions until a predetermined percentage of total area set was reached.

|
For use with the fire model, the forested landscapes were rasterised as a set of grids at a scale of 625 m2 per grid cell (25 × 25 m). Slope (percentage), azimuth (degrees), and fuel types were directly assigned from forest stand composition using the Canadian Forest Fire Behaviour Prediction (FBP) system nomenclature (Forestry Canada Fire Danger Group 1992). A digitalised map of slope, azimuth, water flow, and stand composition for the Research and Teaching Forest of Lake Duparquet were used to create these grids. In turn, these were exported as ASCII data from the ArcGIS software to be included in PFAS. We also created a grid describing the percentage of conifers included in mixedwood stands (fuel type M1, Forestry Canada Fire Danger Group 1992) to take into account the variability within the mixedwood stands typically seen in eastern Canadian boreal forests.
Climate data
Historical fire weather data were compiled for Val d’Or and Earlton climatic stations (48°07′N, 77°78′W, and 47°70′N, 79°85′W respectively). These are the nearest stations to the study area that present a long climatic record (from 1955 to 1995 and from 1953 to 1995 respectively) necessary for the purpose of this study. These data included daily measurements of temperature, relative humidity, precipitation (calculated for the previous 24 h), and wind speed. As wind directions are necessary for the fire propagation but were missing over the entire climatic record, daily wind directions were produced over the period using hourly weather data from 1991 to 1995 at Val d’Or station. From these hourly data, a probability matrix relating wind speed to each of the eight wind directions was first built, and then used to allocate a wind direction to each of the 40-year daily records according to the highest probability. Daily values of the Canadian Forest Fire Weather Index (FWI) System indices (van Wagner 1987) were also computed over the 40-year period. These include the duff moisture code (DMC), a numerical rating of the moisture content of the intermediate deep humus (duff layer). The DMC represents the limiting factor within the fire model, extinguishing a fire if the value falls below a critical threshold (equal to 20 in the present study).
Theory of the fire model
The long-range fire growth model system used in this study is a probabilistic model based on climatology that predicts potential fire growth on a scale of days, weeks or even months. Normally, this is beyond the scope of current, deterministic fire-growth models owing to their dependence on detailed meteorological data (Kourtz et al. 1977; Richards 1994; Finney 2004). The model is based on the Canadian Forest Fire Danger Rating System (Stocks et al. 1989) and is designed to work in the Canadian boreal forest. Complete details of the model and its theory can be found in Anderson (2010).
Long-term fire growth from one location to another within a given time period can be expressed as the probability that the fire will spread across the distance before a fire-stopping rain event occurs as follows:

where pfire(t) is the probability a fire will reach a certain point at time t, pspread(t) is the probability a fire will spread to that location at time t in the absence of a fire-stopping rainfall event, and Psurvival(t) is the cumulative probability that a fire will survive through possible fire-stopping events up to and including time t. The probability of spread depends on fuel types and weather conditions, whereas the probability of survival depends on the moisture content of the forest floor. Applying the equation over a gridded fuels map, the model produces a spatial representation of potential fire growth, shown as probabilities on a map referred to as the probable fire extent map.
The probability that a fire will spread from one location to another in a given time depends on the variation of the fire propagation speed, or rate of spread r, over time. In turn, this is dependent on fire weather conditions and on the forest fuel types. The temporal unit of the model is 1 day. By choosing a time period of 1 day and integrating the rate of spread over the course of the day, the rate of spread becomes a daily value and diurnal effects are eliminated. Assuming the rate of spread follows an exponential distribution, the distribution can be defined by the occurrence rate lambda (λ), the reciprocal of the mean observed rate of spread. From this, the probability of exceeding a critical rate of spread, rc, is

where rc is defined as the spread rate necessary to move a fire across one grid cell in one time period. Spread across multiple cells then becomes the product of these probabilities along the path.
The probability of survival is a function of fuel moisture conditions: a fire is naturally extinguished when the moisture conditions within the forest floor preclude smouldering combustion. The Duff Moisture Code within the Canadian FWI system is an index of such conditions. When the DMC drops below a certain value owing to rain or cooling weather, it can be assumed that a smouldering fire will likely expire. This value is called the DMC of extinction (DMCex), and it has been fixed in the present study at 20, as in the Wood Buffalo National Park case study of Anderson (2010). The probability that over time the DMC will drop below the level of extinction can be estimated using first-order Markov chains.
The final probability that a fire will reach a location on a given day is the product of the probability of a spread for that day and the cumulative probability of survival (the complement of the probability of extinction) until that day. A probable fire extent map representative of the fire size can be produced by calculating the cumulative final probability for each grid cell on the map.
Fire model in practice
Probability of spread distributions (defined by the occurrence rate λ) were derived by calculating the mean rate of spread conditions for each weather record in the historical database for each compass direction (north, north-east, etc.) and for each FBP fuel type. The directional component of spread was incorporated using elliptical fire growth, assuming the ignition point as the focus of the ellipse. Distributions were calculated for each weather station, fuel type, compass direction and month (from the beginning of May to the end of September, corresponding to the present-day fire-season length). Critical spread probability maps were calculated, one per month and per compass direction, by interpolating to each grid cell the λ values calculated at each weather station, matching the distribution used to the fuel type within the cell.
For each fire simulation, the critical spread maps were used to create a probability of spread map. Given an ignition point and a projection time length, the probability of spread to each cell within the grid can be calculated by following a path of highest probability from the ignition point to the target cell through the eight directionally based critical spread probability maps for the current month.
To calculate probability of survival, transition probability matrices were developed for each weather station from daily DMC values based on the number of times the DMC changes from one state to the next. This matrix comprises 100 states corresponding to integer DMC values from 1 to 99. A DMC of 0 was included to indicate the extinction state. This transitional probability matrix was then used to produce a matrix of probabilities of extinction for each weather station, based on the probability of moving from the current DMC to the extinction state (DMC = 0) over time. If the DMC begins at or below the DMCex, it is forced to a DMC state of 0, where it will stay in future calculations. Finally, a map reporting the probability of extinction for each pixel was created using values from the matrix. Given a current DMC and a time length for the simulation, the probability of extinction values are taken from the matrix for each weather station and the resultant probability is issued from an inverse distance-weighted interpolation.
Simulations
To simulate a wide range of weather conditions from the perspective of climate change in which fires are expected to become more frequent and to cover larger areas (Flannigan et al. 2001), three fire danger levels represented by different initial DMC were selected. The low, moderate and high fire dangers were described with an initial DMC of 25, 35 and 50 respectively. The DMC value represents the initial condition for the potential fire ignition at the beginning of each run. The DMC value of 25 represents approximately the average DMC value recorded today in boreal fires in Quebec (Table 2). For each DMC, 100 runs were performed using for each run a random starting date, a random ignition point location, and a random projection time length. These same 100 starting conditions were applied to the three DMC indices for the reference forest mosaic, and this protocol (three DMC, 100 runs per DMC with the same starting conditions) was applied to all landscape mosaic scenarios (Table 1).

|
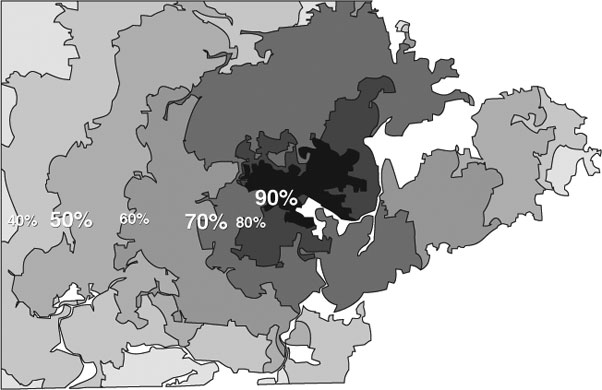
The expected size of the area burned for each run extracted from the output report captures the potential fire spread over a range of fire weather conditions. The fire extents map produced by the model presents a spatial prediction of the combined probabilities of spread and survival, as shown in Fig. 2. For the purposes of this study, it is assumed that the spatial extent of each probability contour is indicative of the probability of a fire reaching that size given the weather conditions driving the model. In other words, it is assumed that the 90th percentile of the weather will lead to a fire of the size captured within the 90% probability range of the fire extents map. This is a reasonable assumption as in terms of weather, fire spread rate is primarily a function of the initial spread index (ISI) within the FBP system – a percentile change in the ISI will lead to a similar percentile change in the spread rate and thus the area burned (that is, the 90th percentile of the ISI will result in the 90th percentile of rate of spread and of area burned). Following this line of reasoning, this study uses the spatial extents of nine probability levels (10, 20, …, 90%) as nine independent simulations capturing nine percentile levels of possible fire weather related to propagation.
|
Simulations, statistical analyses, and comparisons with empirical data
In total, 100 randomly placed fire simulations were run for each of the three DMC classes and the 14 fuel mosaics, resulting in nine classes of probable fire extent sizes per simulation. Among the 100 ignition points, 14 hit water bodies, and the fire propagation did not occur. Therefore, only 86 fires per mosaic and per fire risk were analysed for a total of 32 508 simulated fire sizes.
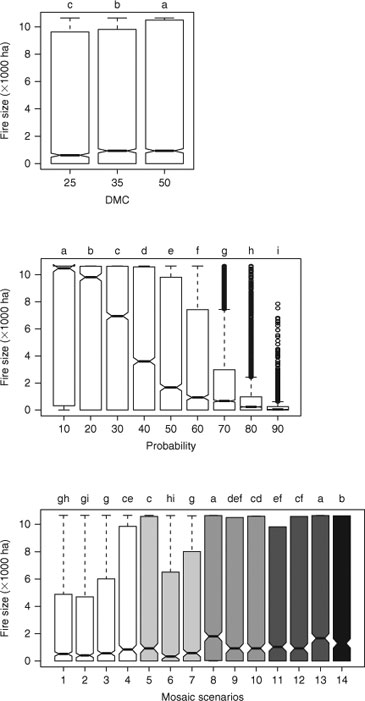
The respective roles of mosaic composition and fire weather conditions were analysed using a multivariate ANOVA design on rank scores (Conover and Iman 1981) with the General Linearised Model procedure carried out using the open-source R software (R Development Core Team 2007). Ranking procedure was necessary because variances among factor groups were not equal. Three factors – DMC, probable fire extents, and landscape mosaic (and their potential interactions) – were considered in the analysis, capturing the effects of the initial fuel moisture conditions for ignition, post-ignition weather conditions for fire propagation, and forest fuel type respectively (Table 3). For each given significant factor (not for interactions), significant differences among groups (three groups for DMC, 14 for mosaic composition, and nine for probable fire extent sizes) were tested using the multiple-comparison Tukey honestly significant difference (HSD) test with α = 0.05 (Fig. 3).

|
|
The Quebec Province fire database (1994–2007) provided by the Société de Protection des Forêts contre le Feu (SOPFEU; F. Lefebvre, pers. comm.) was used to extract data on real fires that burned within the mixedwood boreal and black spruce forests respectively (Table 2). Fires initiated within fuel types C1 and C2 were considered as black spruce forest fires, whereas fires ignited within other fuel types were considered as being mixedwood boreal forest fires. Only fires less than 11 000 ha in size and ignited by lightning strikes were finally retained in order to match both the Duparquet study area and the ignition source pattern, but statistics for all fire sizes are also provided (Table 2). Most of the time, the SOPFEU database provided local weather conditions in terms of fire risk indices associated with fire dates. Therefore, we used the observed DMC values to calculate the proportion of days in the SOPFEU database with low (20 < DMC ≤ 30), moderate (30 < DMC ≤ 40), and high (50 < DMC ≤ 60) fire dangers respectively that have occurred in both the mixedwood and the black spruce forests since 1994 (Table 2).
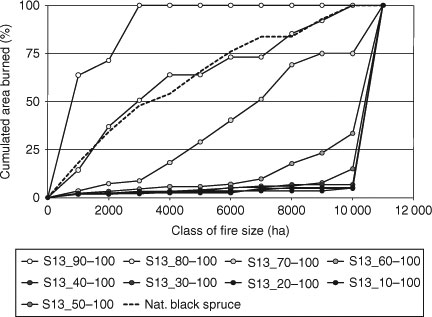
Within each scenario mosaic (except the S13 scenario representative of the pure black spruce landscape mosaic), we randomly selected simulations within each DMC level to match the proportions found in the SOPFEU fire-weather database for the mixedwood boreal forest fires (Table 2). For the S13 scenario, we applied the proportions exclusively computed from the SOPFEU database based on C1- and C2-ignition locations. We first compared the cumulated distribution of area burned in Quebec black spruce forest with those computed for each of the nine classes of probable fire extent from the S13 scenario representative of the pure black spruce forest landscape mosaic (Fig. 4). Based on the fact that black spruce forest fires and mixedwood forest fires in Quebec present similar statistical characteristics for fires less than 11 000 ha in size (Table 2), we used the most representative class of probable fire extent found within the black spruce scenario to compute statistics of area burned for each simulated mosaic scenario (Table 4). Cumulated distributions of area burned were then compared with the observed curve computed using fire sizes in the Quebec mixedwood boreal forest (Fig. 5).
|

|
|
Results
Weather versus landscape composition effects
The parametric three-way analysis of variance performed on ranked scores of 32 508 simulated fire sizes (86 fires × 14 mosaics × 3 DMC × 9 classes of probable fire extents) showed that the three factors and two interactions (mosaic × probable fire extent and DMC × probable fire extent) were significantly influencing the size of simulated area burned (Table 3). Among these factors, the probable fire extent (related to post-ignition weather conditions for fire propagation) explained more than 75% of the variance, which was five times more than the landscape mosaic composition factor and 35 times more than the DMC factor related to the initial fuel moisture conditions for ignition.
The Tukey HSD multiple-comparison test performed on each factor (not shown for interactions) showed that the mean area burned increased with the increasing fire weather risk (ignition and post-ignition propagation) and with the increasing proportion of shade-tolerant species (Fig. 3). The effects of DMC (Fig. 3a) capture the drought conditions leading up to the fire. The higher the DMC value, the higher the dryness of the forest floor at the time of the fire ignition. As a consequence, the median values of area burned increased from 610 to 928 ha and then 930 ha respectively as the DMC condition increased from 25 to 35 and then 50. The effects of probability (Fig. 3b) capture the variation in burned area due to weather after the fire ignition. A given probability corresponds to the percentile of the fire weather conditions driving fire spread as captured in the exponential distribution of the rate of spread used by the model. The results showed that post-ignition fire weather was a significant driver in the final fire size with a clear gradient of increasing median fire size from less than 1000 ha reached with the 30% worst conditions for fire spread (Fig. 3b, probability class 70%) to almost 4000 ha when intermediate favourable conditions were included (probability class 40%), and to more than 10 000 ha when the most favourable conditions for fire propagation were added (probability class 10%). Finally, the area burned also increased with the increasing proportion of shade-tolerant species, and therefore with the length of the fire cycle (Fig. 3c). Mosaic scenarios dominated by shade-intolerant species representative of short fire cycles, such as pure aspen or a mixture of aspen and jack pine, were indeed sustaining the smallest burned areas (S1 to S3 respectively), whereas mosaic scenarios dominated by black spruce (S8 and S13) presented the largest burned areas. Scenarios representative of intermediate lengths of fire cycles showed intermediate values of area burned and were not significantly different from those related to the shortest or longest fire cycle lengths. Scenario S14, representative of the natural reference mosaic in the studied area, was among the scenarios presenting the largest burned areas, suggesting that this mosaic acts as a long fire cycle mosaic.
Characteristics of cumulated distributions of burned areas: simulated versus observed fires
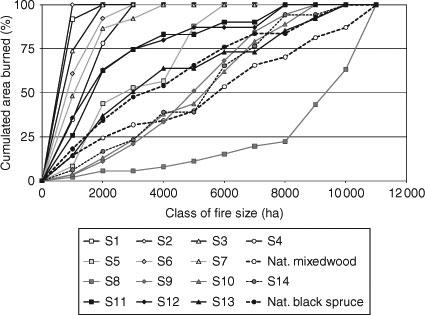
The comparison of the cumulated distributions of burned areas between the observed fire sizes in the Quebec black spruce forests and the simulated fires for the pure black spruce forest mosaic (S13) scenario showed that the natural fire curve was very similar to the curve computed solely with the 80–100% class of the probable fire extent (Fig. 4). We therefore selected this probability class to compute the statistics (Table 4), then to compare the cumulated distribution of fire sizes for each scenario with the curves computed for natural fires observed in the Quebec black spruce and mixedwood boreal forests (Fig. 5). Four patterns of cumulated area burned distribution could be distinguished among scenarios based on the shape of the distributions (Fig. 5) and the increase in statistical values (Table 4). The first pattern included a group of six scenarios (S1–S4, S6, and S7) associated with the shortest-term fire cycles. They presented the most convex curves of cumulated area burned, and were related to the smallest fires sizes in terms of mean, median and total cumulated area. The second pattern was made up of a group including three scenarios (S5, S11, and S12) presenting less convex curves than the first group, and larger area-burned statistics. The third pattern showed linear progressions of the cumulated burned area and grouped four scenarios (S9–S10 and S13–S14), which related to intermediate–long and long fire cycles. For these scenarios there was, however, no fire larger than 10 000 ha. The fourth pattern included only the S8 mosaic scenario, representative of a concave shaped curve associated with an intermediate–long fire cycle. This scenario showed the largest total burned area, which was almost two times larger than the total burned area of the third group, with 10% of simulated fires that burned the entire mosaic area.
The two cumulated area burned distributions computed from fires recorded in the Quebec SOPFEU database for the mixedwood and the black spruce boreal forests fitted in the third group of curves including the reference forest mosaic S14 over the Duparquet area (Fig. 5). It is necessary to note that only fire sizes from 1 to 11 000 ha were selected in the SOPFEU database, as this was the size of the studied area on which simulations were performed. The cumulated area-burned curves computed from the SOPFEU database for the Quebec mixedwood and black spruce forest fires were calculated based on a different number of recorded fires than for the scenarios (523 and 867 fires for mixedwood and black spruce forest fires respectively). However, the analysis showed both similarity in mean fire sizes (315 versus 311 ha) and variability (standard deviation) between the two Quebec SOPFEU forest types (Table 2), with fires less than 11 000 ha in size representing ∼35% of the total area burned recorded. Moreover, more than 50% of fires for both SOPFEU forest types were very small (less than 10 ha) compared with any of the tested scenarios (from 25 to 36% less than 10 ha).
Discussion
Climate versus vegetation effect on fire size
Previous studies dealing with the boreal fire environment have not always found the same relative importance of weather and vegetation composition on the boreal fire behaviour (Johnson 1992; Bessie and Johnson 1995; Hély et al. 2001). This is mainly because the Canadian boreal forest is quite large and covers different forest types, but also because both factors may not act at the same spatial scales. Previous studies showed that climate may be the first-order driver for fire on continental and subcontinental scales (Johnson 1992; Girardin 2007; Macias Fauria and Johnson 2008), mainly owing to positive 500-hPa geopotential height anomalies persisting over a given region for days (Johnson and Wowchuk 1993) and lightning strikes providing the ignition source (Flannigan and Wotton 1991). The present study showed that when fires are analysed as spatial processes taking place at the landscape level, weather related to propagation is the most important factor influencing fire size, followed by the forest fuel composition and to a lesser extent by weather conditions directly related to fire ignition (DMC).
Future fire risk may increase in eastern Canada over the 21st century (Wotton and Flannigan 1993; Flannigan et al. 1998), and may be different from causes and expected changes in western (Balshi et al. 2009) or central Canada (Girardin and Mudelsee 2008). The present study showed that in eastern Canadian boreal forests, even at the landscape level, future fire risk could create larger fires by enhancing fire propagation more than fire ignition per se. Also, our results may be conservative as fires larger than 11 000 ha in size from the SOPFEU database were not included in this study. Such fires represent ∼3% of fire occurrence but account for 65% of the total area burned, which is more or less consistent with proportions found over the entire Canadian boreal forest.
LaCroix et al. (2006) conducted a similar study within Wisconsin forest types using the FARSITE model (Finney 2004). Though the Wisconsin fuels are different than those in the Lake Duparquet area, some of the fuel models used there could be similar to those in the mixedwood boreal forest. They report that the most important factors influencing the fire spread in their modelling exercise were the fire ignition location followed by rain. Differences between both studies may be partly explained by the fact that LaCroix et al. (2006) conducted their simulations over a constant period (15 days), forcing fires to be homogeneous. This is different from our simulated fires where the period was computed as the difference between the ignition day and the end of the fire season on 30 September (though many fires stopped earlier when the DMC extinction threshold was reached). Moreover, LaCroix et al. (2006) conducted fire simulations on five landscape types with four differing from the fifth (the reference landscape) by varying the amount (2 and 4%) and method of harvesting. Such a scenario protocol therefore induced more homogeneous landscapes in Wisconsin than those in the present study. Finally, even though both studies used three fire weather risks, the present study ran 100 simulations per landscape scenario and fire weather risks that all differed from their ignition location, as compared with the 12 different ignition points in LaCroix et al. (2006). Other related studies (Ryu et al. 2007; LaCroix et al. 2008) have found that stands with low fuel amounts and a particular spatial shape (area-to-edge ratio) in the landscape could act as fire barriers. This is different from the results of the present study where tree species composition directly affected area burned, with ∼14% of the variance explained by landscape composition.
Landscape mosaic composition and fire size: a management issue
Over the last two decades, several forest management approaches for sustainable development have concluded that harvesting practices and rotation times that emulate the natural disturbance dynamics in these boreal forests should be among the best approaches for biodiversity conservation and sustainable forestry production (Burton et al. 2003; Gauthier et al. 2009). The present study showed that forest mosaics dominated by shade-intolerant species (as a result of short-term fire cycles) would be subject to small fires, whereas mosaics dominated by shade-tolerant and associated with intermediate- to long-term fire cycles would sustain significantly larger fires. Therefore, one could conclude from these results that forest managers should take fire size distribution into account when selecting the degree of harvesting. Bergeron et al. (2002) illustrated this concept using three distinct forest mosaics from western to eastern Canada whose landscape compositions differed significantly owing to the fire cycles (from 50–70 years in western Canada to 150 years in the Duparquet region and to more than 500 years near Labrador). Using information on fire size distribution, managers could also be aware of the potential disturbance sizes within their management zone resulting from the mosaic composition decisions within their forest management plan. Also, area burned could likely increase owing to the superimposed effect of ongoing climate change in the coming decades.
The Duparquet mosaic: likely a special playground too small for modellers
The analysis pointed out the potential bias associated with the study area due to its spatial configuration and to its relatively small size (∼11 000 ha). This bias is reflected in that the computed cumulated distribution from observed black spruce forest fires matched the 80–100% class of probable fire extent (and not the median size) for scenario S13. This may be due to the fact that except for large water bodies, the fractured landscape of the Duparquet area, with rivers, streams and marshes, was not captured within the PFAS modelling environment (Fig. 1). Indeed, the modelling environment used would highly favour fire spread, and therefore PFAS overestimated the fire size at the median probable fire extent class.
Regarding the study area size, the fact that 10% of simulated fires with scenario S8 spread over the entire study area means that their final size could have been even greater if a larger landscape mosaic had been used. Nevertheless, the use of the 80–100% class of probable fire extent to assess fire size and to compute cumulated distribution of area burned allowed us to find fair agreement between curves computed from Quebec mixedwood forest fires and simulated fires in the S14 Duparquet mosaic. The slight differences between these two curves could come from factors that have influenced forest composition in the recent past. Indeed, there are only 13% of the stands within the SOPFEU records that are pure deciduous (D1), whereas the same fuel type represents ∼37% in the Duparquet reference mosaic. We are also aware that the mosaic over the entire province is highly fragmented near or within agricultural areas. This in part explains the fact that so many records dealt with very small fires in the mixedwood boreal forest over the province (see SOPFEU database statistics in Table 2). Small fires are also easily extinguished by fire prevention teams, further biasing the sizes within the records. In contrast to this, the mixedwood boreal forest in the Abitibi region where Lake Duparquet is located has been under silvicultural management only since 1910 (Bergeron et al. 2004), such management having been gentle and over a short period around Lake Duparquet (Bescond 2002). As a consequence, Dansereau and Bergeron (1993) have estimated a fire cycle longer than 200 years around Lake Duparquet. This would have directly affected the forest composition towards late successional species associated to longer-term fire cycles (Bergeron et al. 2002) and also affected fire size distribution towards larger fires. Simultaneously, the last spruce budworm outbreak (Morin 1995) that affected the western part of the Quebec province and the Duparquet Lake region further increased the percentage of deciduous and early successional species by destroying large areas of balsam fir stands (Bergeron and Dansereau 1993).
For the black spruce mosaics (the natural one over Quebec based on C1 and C2 stands from the SOPFEU database versus scenario S13), differences in the cumulated burned-area curves computed for each class of probable fire extent are likely attributed to the mosaic size bias explained above. Indeed, in the natural black spruce mosaic of the SOPFEU database, 15 fires since 1994 (less than 3% of the fires recorded) were larger than 11 000 ha. These were responsible for more than 65% of the total burned area since the fire records exist (and including fires at least 1 ha in size). The proportions are almost equivalent for the mixedwood boreal forest types (19 fires larger than 11 000 ha representing 2% of fires and 64% of the total burned area). However, these largest fires were not included in the cumulated burned-area curves reported in Figs 4 and 5. Therefore, if the study area where simulations took place was larger, the S13 scenario representative of a simulated pure black spruce mosaic probably would have better matched the cumulated area burned presented.
Conclusion
Models are recognised to be useful tools to explore phenomena that occur at spatial and temporal scales at which extensive direct observation and experimentation are prohibitive, if not impossible (Shugart 1998). In the present case, a modelling exercise was mandatory as it was impossible to find several actual mosaics presenting different vegetation compositions while being subject to a large number of fires over time. However, true mosaics and their fire records such as the mixedwood and black spruce boreal forests over the Quebec province have been compared with the different simulated scenarios.
This study presented interesting results from the vegetation dynamics modelling perspective. Indeed, such information of fire size distribution related to forest mosaic composition is mandatory when modelling forest ecosystem functions and dynamics with a long-term perspective. It tested one of the likely feedbacks of vegetation composition on fire disturbance. Moreover, this study presented a wide range of mosaic compositions likely to occur under varying climate change conditions over all the boreal forest. Coupled with the expected trends in climate change, and with different complementary modules usually found in forest dynamics modelling at the stand and the mosaic scales (regeneration, growth…), the use of models such as the PFAS system in a disturbance module of vegetation models could enhance our knowledge of the interaction between vegetation composition, disturbances as internal ecosystem processes, and climate variability.
Acknowledgements
We thank the Chaire Industrielle en Aménagement Durable des Forêts for funding part of this research, and the SOPFEU members for providing us with their fire database and for valuable advice to improve the comparison analysis between the simulated fire sizes and those extracted from lightning fires recorded in the database.
References
Anderson KR (2010) A climatologically based long-range fire growth model. International Journal of Wildland Fire 19, 879–894.| A climatologically based long-range fire growth model.Crossref | GoogleScholarGoogle Scholar |
Balshi MS, McGuire AD, Duffy D, Flannigan M, Walsh J, Melillo J (2009) Assessing the response of area burned to changing climate in western boreal North America using a multivariate adaptive regression splines (MARS) approach. Global Change Biology 15, 578–600.
| Assessing the response of area burned to changing climate in western boreal North America using a multivariate adaptive regression splines (MARS) approach.Crossref | GoogleScholarGoogle Scholar |
Bergeron Y, Dansereau PR (1993) Predicting the composition of Canadian southern boreal forest in different fire cycles. Journal of Vegetation Science 4, 827–832.
| Predicting the composition of Canadian southern boreal forest in different fire cycles.Crossref | GoogleScholarGoogle Scholar |
Bergeron Y, Leduc A, Harvey BD, Gauthier S (2002) Natural fire regime: a guide for sustainable management of the Canadian boreal forest. Silva Fennica 36, 81–95..
Bergeron Y, Gauthier S, Flannigan MD, Kafka V (2004) Fire regimes at the transition between mixedwood and coniferous boreal forest in north-western Quebec. Ecology 85, 1916–1932.
| Fire regimes at the transition between mixedwood and coniferous boreal forest in north-western Quebec.Crossref | GoogleScholarGoogle Scholar |
Bescond H (2002) Reconstitution de l’historique de l’exploitation forestière sur le territoire de la forêt d’enseignement et de recherche du Lac Duparquet au cours du 20ème siècle et influence sur l’évolution des peuplements forestiers. MSc (Biology) thesis, University of Québec in Montréal.
Bessie WC, Johnson EA (1995) The relative importance of fuels and weather on fire behavior in subalpine forest. Ecology 76, 747–762.
| The relative importance of fuels and weather on fire behavior in subalpine forest.Crossref | GoogleScholarGoogle Scholar |
Burton PJ, Messier C, Smith DW, Adamowicz WL (2003) ‘Towards Sustainable Management of the Boreal Forest.’ (National Research Council Research Press: Ottawa, ON)
Chambers JM, Cleveland WS, Kleiner B, Tukey PA (1983) ‘Graphical Methods for Data Analysis.’ (Chapman and Hall: New York)
Conover WJ, Iman RL (1981) Rank transformations as a bridge between parametric and non-parametric statistics. The American Statistician 35, 124–129.
| Rank transformations as a bridge between parametric and non-parametric statistics.Crossref | GoogleScholarGoogle Scholar |
Dansereau PR, Bergeron Y (1993) Fire history in the southern boreal forest of north-western Quebec. Canadian Journal of Forest Research 23, 25–32.
| Fire history in the southern boreal forest of north-western Quebec.Crossref | GoogleScholarGoogle Scholar |
Drever CR, Peterson G, Messier C, Bergeron Y, Flannigan MD (2006) Can forest management based on natural disturbances maintain ecological resilience? Canadian Journal of Forest Research 36, 2285–2299.
| Can forest management based on natural disturbances maintain ecological resilience?Crossref | GoogleScholarGoogle Scholar |
Fenton NJ, Simard M, Bergeron Y (2009) Emulating natural disturbances: the role of silviculture in creating even-aged and complex structures in the black spruce boreal forest of eastern North America. Journal of Forest Research 14, 258–267.
| Emulating natural disturbances: the role of silviculture in creating even-aged and complex structures in the black spruce boreal forest of eastern North America.Crossref | GoogleScholarGoogle Scholar |
Finney MA (2004) FARSITE: Fire Area Simulator – Model development and evaluation. USDA Forest Service, Rocky Mountain Research Station, Research Paper RMRS-RP-4. (Ogden, UT)
Flannigan MD, Wotton BM (1991) Lightning-ignited forest fires in north-western Ontario. Canadian Journal of Forest Research 21, 277–287.
| Lightning-ignited forest fires in north-western Ontario.Crossref | GoogleScholarGoogle Scholar |
Flannigan MD, Bergeron Y, Engelmark O, Wotton BM (1998) Future wildfire in circumboreal forests in relation to global warming. Journal of Vegetation Science 9, 469–476.
| Future wildfire in circumboreal forests in relation to global warming.Crossref | GoogleScholarGoogle Scholar |
Flannigan MD, Campbell I, Wotton BM, Carcaillet C, Richard P, Bergeron Y (2001) Future fire in Canada’s boreal forest: paleoecology results and general circulation model–regional climate model simulations. Canadian Journal of Forest Research 31, 854–864.
| Future fire in Canada’s boreal forest: paleoecology results and general circulation model–regional climate model simulations.Crossref | GoogleScholarGoogle Scholar |
Forestry Canada Fire Danger Group (1992) Development and structure of the Canadian Forest Fire Behavior Prediction System. Forestry Canada, Science and Sustainable Development Directorate, Information report ST-X-2. (Ottawa, ON)
Gauthier S, Vaillancourt M-A, Leduc A, De Grandpré L, Kneeshaw D, Morin H, Drapeau P, Bergeron Y (2009) ‘Sustainable Management in the Boreal Forest.’ (Presses de l’Université du Québec: Montréal)
Girardin MP (2007) Interannual to decadal changes in area burned in Canada from 1781 to 1982 and the relationship to Northern hemisphere land temperatures. Global Ecology and Biogeography 16, 557–566.
| Interannual to decadal changes in area burned in Canada from 1781 to 1982 and the relationship to Northern hemisphere land temperatures.Crossref | GoogleScholarGoogle Scholar |
Girardin MP, Mudelsee M (2008) Past and future changes in Canadian boreal wildfire activity. Ecological Applications 18, 391–406.
| Past and future changes in Canadian boreal wildfire activity.Crossref | GoogleScholarGoogle Scholar |
Harvey B (1999) The Lake Duparquet research and teaching forest: building a foundation for ecosystem management. Forestry Chronicle 75, 389–393..
Hély C, Flannigan MD, Bergeron Y, McRae D (2001) Role of vegetation and weather on fire behavior in the Canadian mixedwood boreal forest using two fire behavior prediction systems. Canadian Journal of Forest Research 31, 430–441.
| Role of vegetation and weather on fire behavior in the Canadian mixedwood boreal forest using two fire behavior prediction systems.Crossref | GoogleScholarGoogle Scholar |
Johnson EA (1992) ‘Fire and Vegetation Dynamics: Studies from the North American Boreal Forest.’ (Cambridge University Press: Cambridge, UK)
Johnson EA, Wowchuk DR (1993) Wildfires in the southern Canadian Rocky Mountains and their relationship to mid-tropospheric anomalies. Canadian Journal of Forest Research 23, 1213–1222.
| Wildfires in the southern Canadian Rocky Mountains and their relationship to mid-tropospheric anomalies.Crossref | GoogleScholarGoogle Scholar |
Kourtz P, Nozaki S, O’Regan WG (1977) Forest fires in the computer – a model to predict the perimeter location of a forest fire. Canadian Forestry Service, Petawawa Research Forest Station, Information Report FF-X-65. (Petawawa, ON)
LaCroix JJ, Ryu SR, Zheng D, Chen JQ (2006) Simulating fire spread with landscape management scenarios. Forest Science 52, 522–529..
LaCroix JJ, Li Q, Chen JQ, Henderson R, John R (2008) Edge effects on fire spread in a disturbed northern Wisconsin landscape. Landscape Ecology 23, 1081–1092.
| Edge effects on fire spread in a disturbed northern Wisconsin landscape.Crossref | GoogleScholarGoogle Scholar |
Macias Fauria M, Johnson EA (2008) Climate and wildfires in the North American boreal forest. Philosophical Transactions of the Royal Society B 363, 2317–2329.
| Climate and wildfires in the North American boreal forest.Crossref | GoogleScholarGoogle Scholar |
Morin H (1995) Importance et évolution des épidémies de la tordeuse des bourgeons de l’épinette dans la zone boréale au vingtième siècle. In ‘En Savons Nous Assez pour Lutter Efficacement contre la Tordeuse?’ pp. 92–95. (Ministère des ressources naturelles, Direction de la recherche forestière: Quebec, QC)
Pelletier G, St-Onge J, Bordeleau P, De Rainville P, Bart F, Aubin E, Roy JF, Thériault G (2009) Classification des peuplements forestiers en tant que combustibles, selon la méthode Canadienne de prévision du comportement des incendies de forêt. Ministere des ressources naturelles, Troisième programme décennal d’inventaire forestier du Québec, report number DEPF-0317. (Québec)
R Development Core Team (2007) R: a language and environment for statistical computing. R Foundation for Statistical Computing. (Vienna, Austria) Available at http://www.R-project.org [Verified 15 November 2010]
Richards GD (1994) The properties of elliptical wildfire growth for time dependent fuel and meteorological conditions. Combustion Science and Technology 95, 357–383.
| The properties of elliptical wildfire growth for time dependent fuel and meteorological conditions.Crossref | GoogleScholarGoogle Scholar |
Rowe JS (1972) Forest regions of Canada. Environment Canada, Canadian Forestry Service, Publication No. 1300. (Ottawa, ON)
Ryu SR, Chen JQ, Zheng D, LaCroix JJ (2007) Relating surface fire spread to landscape structure: an application of FARSITE in a managed forest landscape. Landscape and Urban Planning 83, 275–283.
| Relating surface fire spread to landscape structure: an application of FARSITE in a managed forest landscape.Crossref | GoogleScholarGoogle Scholar |
Shugart HH (1998) ‘Terrestrial Ecosystems in Changing Environments.’ (Cambridge University Press: Cambridge, UK)
Shugart HH, Leemans R, Bonan GB (1992) ‘A Systems Analysis of the Global Boreal Forest.’ (Cambridge University Press: Cambridge, UK)
Stocks BJ, Lawson BD, Alexander ME, van Wagner CE, McAlpine RS, Lynham TJ, Dubé DE (1989) The Canadian Forest Fire Danger Rating System: an overview. Forestry Chronicle 65, 258–265..
van Wagner CE (1987) Development and structure of the Canadian Forest Fire Weather Index System. Canadian Forestry Service, Forestry Technical Report no 35. (Ottawa, ON)
Vincent JS, Hardy L (1977) L’évolution et l’extension des lacs glaciaires Barlow et Ojibway en territoire québécois. Géographie Physique et Quaternaire 31, 357–372..
Whelan RJ (1995) ‘The Ecology of Fire.’ (Cambridge University Press: Cambridge, UK)
Wotton BM, Flannigan MD (1993) Length of the fire season in a changing climate. Forestry Chronicle 69, 187–192..