

Where wildfires destroy buildings in the US relative to the wildland–urban interface and national fire outreach programs
H. Anu Kramer A D , Miranda H. Mockrin B , Patricia M. Alexandre C , Susan I. Stewart A and Volker C. Radeloff AA SILVIS Lab, Department of Forest and Wildlife Ecology, University of Wisconsin-Madison, 1630 Linden Drive, Madison, WI 53706, USA.
B Northern Research Station, USDA Forest Service, 5523 Research Park Dr Suite 350, Baltimore, MD 21228, USA.
C Forest Research Centre, School of Agriculture, University of Lisbon, Tapada da Ajuda, PT-1349-017 Lisboa, Portugal.
D Corresponding author. Email: hakramer@wisc.edu
International Journal of Wildland Fire 27(5) 329-341 https://doi.org/10.1071/WF17135
Submitted: 26 August 2017 Accepted: 13 March 2018 Published: 24 April 2018
Journal Compilation © IAWF 2018 Open Access CC BY-NC-ND
Abstract
Over the past 30 years, the cost of wildfire suppression and homes lost to wildfire in the US have increased dramatically, driven in part by the expansion of the wildland–urban interface (WUI), where buildings and wildland vegetation meet. In response, the wildfire management community has devoted substantial effort to better understand where buildings and vegetation co-occur, and to establish outreach programs to reduce wildfire damage to homes. However, the extent to which the location of buildings affected by wildfire overlaps the WUI, and where and when outreach programs are established relative to wildfire, is unclear. We found that most threatened and destroyed buildings in the conterminous US were within the WUI (59 and 69% respectively), but this varied considerably among states. Buildings closest to existing Firewise communities sustained lower rates of destruction than further distances. Fires with the greatest building loss were close to outreach programs, but the nearest Firewise community was established after wildfires had occurred for 76% of destroyed buildings. In these locations, and areas new to the WUI or where the fire regime is predicted to change, pre-emptive outreach could improve the likelihood of building survival and reduce the human and financial costs of structure loss.
Additional keywords: Firewise, natural disaster, risk, WUI.
Introduction
Fires are becoming more destructive and more costly, both in the US and globally (Association for Fire Ecology et al. 2015; Abatzoglou and Williams 2016). Although wildfire suppression is effective at stopping most fires, wildfires that escape suppression often occur during the most extreme weather conditions, causing dangerous and destructive fire behaviour (Calkin et al. 2005). Such fires can result in the loss of buildings, homes and human lives, as well as widespread social, health and economic costs through evacuations, smoke exposure and loss of tourism revenue (Richardson et al. 2012; Moritz et al. 2014). Greater housing and associated infrastructure in and near wildland vegetation has been associated with a greater cost of wildfire suppression and damage (Hammer et al. 2007; Gude et al. 2013). Although not all studies show a direct or causal relationship between buildings within fire perimeters and the cost of suppression, many show a relationship between the number of homes near a fire and suppression expenditures (Gude et al. 2013; Hand et al. 2016).
Areas where houses mix or intermingle with wildland vegetation are referred to as the wildland–urban interface (WUI), which can be divided into areas where buildings are in close proximity to large contiguous patches of flammable vegetation (interface) and areas where buildings are interspersed within flammable vegetation (intermix) (Radeloff et al. 2005). The close proximity of buildings to flammable vegetation increases the likelihood of buildings burning. To better anticipate and understand the wildfire problem, the WUI has been mapped for multiple countries. The first WUI maps for the conterminous US were developed by Radeloff et al. (2005) and Wilmer and Aplet (2005), and others have developed alternative mapping approaches (Theobald and Romme 2007; Calkin et al. 2011a; Bar-Massada et al. 2013). Similarly, the WUI has been mapped in other countries where wildfires are of concern, including Argentina (Argañaraz et al. 2017), Spain (Chas-Amil et al. 2013), Lebanon (Mhawej et al. 2017) and France (Lampin-Maillet et al. 2010).
Not all areas of the WUI are at high or moderate risk of burning in wildfire. For example, throughout the north-eastern United States, buildings are adjacent to and intermixed with dense forests that have a low probability of burning (Finney et al. 2011; Haas et al. 2013). Furthermore, in those areas that are prone to fire, several factors determine the overall likelihood of building loss, including building design and maintenance, spatial configuration of flammable wildland vegetation, and suppression capabilities and response (Radeloff et al. 2005; Price and Bradstock 2013; Alexandre et al. 2016; Westhaver 2016). Despite the role of local- and landscape-level factors in building loss, the WUI as a whole remains a focus area for federal wildfire programs (United States Congress 2003; Wildland Fire Executive Council 2014), including a recent Executive Order (Obama 2016). Between 1990 and 2010, the WUI has grown by 33%, and housing within burned areas increased by 202% (Radeloff et al. 2018). However, it is not clear whether buildings threatened by wildfires, as well as those destroyed by wildfire, are actually located in the area mapped as WUI.
Homeowners who live in fire-prone locations can minimise the risk that their house will burn by altering building characteristics and the vegetation around their homes (Cohen 2000; Calkin et al. 2014). However, these guidelines are rarely mandatory (Schoennagel et al. 2009; McLennan et al. 2017; Wolters et al. 2017). Instead, voluntary efforts are promoted through fire outreach programs, including national programs (Firewise, Fire Adapted Communities, see http://www.fireadapted.org/, accessed 24 February 2017, and Fire Learning Networks, see http://www.conservationgateway.org/, accessed 19 April 2017), state programs (e.g. California Fire Safe Council and Nevada’s Living with Fire program), and local government and fire department outreach efforts. The Firewise program was established by the National Fire Protection Association (NFPA, a global non-profit organisation) in 1986. Firewise partnered with the US Forest Service and state forestry departments and Firewise communities were officially recognised in the United States in 2002 (see www.firewise.org/, accessed 24 February 2017). The Firewise program informs residents about the danger of living in fire-prone areas and details steps individuals and neighbours can take to reduce the likelihood of wildfire damaging or destroying homes (see www.firewise.org/usa-recognition-program.aspx, accessed 15 December 2016), while also encouraging neighbours to join forces (see www.firewise.org/, accessed 24 February 2017). The Fire Adapted Communities program, launched in 2012 through a partnership between NFPA and the US Forest Service, encourages individuals, neighbourhoods and communities to commit to creating and maintaining Firewise principles at different scales – homes, businesses, infrastructure and public areas within a neighbourhood or community – and incorporating community-level planning efforts, such as creating Community Wildfire Protection Plans (CWPPs) (see http://www.fireadapted.org/). Planning efforts like CWPPs are also important for helping communities reduce their likelihood of damage by wildfire, but there is no database that we know of that has reliable information about the location of CWPPs at the national scale. Accordingly, we focussed solely on outreach programs.
To complement Firewise and Fire Adapted Community outreach, which target action in communities at risk from wildfire, the Fire Learning Network operates at an even broader scale. The Fire Learning Network consists of landscapes and communities across the US where people work together to plan and implement workshops, outreach, and collaborative restoration, including prescribed fire, to build community and ecosystem resilience to wildfire (see www.conservationgateway.org/, accessed 24 February 2017). The Fire Learning Network is supported by a partnership between The Nature Conservancy, US Forest Service and US Department of the Interior (see http://www.conservationgateway.org/). These outreach programs often complement each other. For example, Fire Adapted Communities utilise Firewise resources, and the Fire Learning Network contains a subgroup – the Fire Adapted Community Learning Network – that facilitates the spread of Fire Adapted Communities.
However, it is unclear how, where and when the different wildfire outreach programs are active and if those patterns match those of wildfire losses and residential development. Residential development in fire-prone vegetation is widespread, and continues even after destructive wildfire (Alexandre et al. 2015). Regulations pertaining to WUI mitigation are often not adopted until after wildfires destroy homes (Duerksen et al. 2011), and are thus reactive, but it is not clear if fire outreach, such as Firewise community establishment, is reactive as well. Furthermore, hazard experience does not necessarily lead to behavioural changes by residents or risk reduction efforts by communities. Residents may lack funds or feel denial or fatalism whereas communities may face institutional challenges, limited budgets or inertia (Solecki and Michaels 1994; Birkland 2006; Champ and Brenkert‐Smith 2016; Mockrin et al. 2016). Determining the timing of outreach program establishment in relation to wildfire exposure and new development can therefore provide insight into where residents are served by outreach programs and whether past wildfire influenced program establishment.
Given the need to prevent and reduce building losses to wildfire, we ask:
-
Does the WUI overlap the area where buildings have been threatened or destroyed by wildfires?
-
Where are national wildfire outreach programs located relative to wildfires and to buildings threatened or destroyed by wildfires?
-
When were Firewise programs (the most common outreach program) established relative to wildfires that threatened or destroyed buildings?
Methods
Data
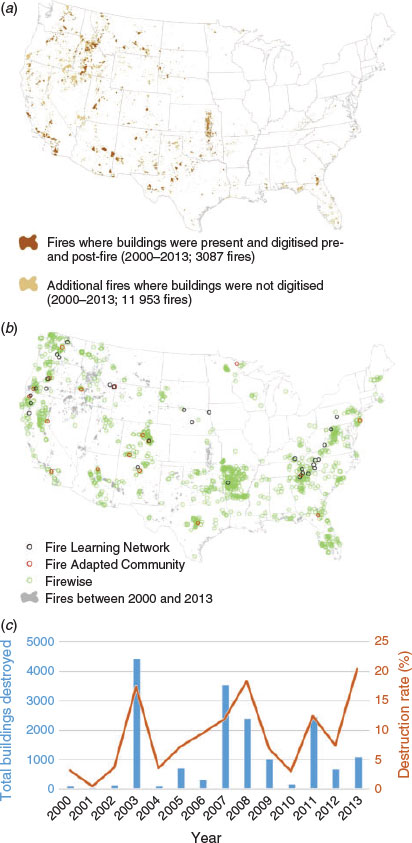
Our study area was the conterminous United States (Fig. 1). We obtained fire perimeters for fires that burned between 2000 and 2013 from the Monitoring Trends in Burn Severity (MTBS) dataset, which includes all fires greater than 404 ha (1000 acres) in the western, and 202 ha (500 acres) in the eastern US (see www.mtbs.gov/, accessed 19 April 2017).
|
To map the locations of buildings threatened or destroyed by wildfire, we selected MTBS fire perimeters from 2000–2013 that, according to the 2000 US decennial census, had housing within them (Fig. 1a). We then analysed Google Earth imagery within these fire perimeters from as close to the fire’s date (before and after) as possible, as well as up to 5 years after the fire. We eliminated fires where such imagery was not available, or where imagery showed no buildings. Of 11 244 fires (covering 302 728 km2, of which 3012 km2 were WUI) that burned between 2000 and 2013, 3087 fires (122 427 km2, of which 2591 km2 were WUI) had sufficient imagery and contained buildings (Fig. 1a). Thus, we mapped 86% of burned WUI area in this sample. Within these fire perimeters, we digitised all buildings present before the fire and defined these as buildings threatened by fire (totalling 150 936 buildings). This included buildings that were no longer present after the fire (defined as destroyed; 17 079 buildings) and buildings that were present after the fire (defined as survived; 133 857 buildings). All buildings not present before the fire, but appearing within 5 years after the fire, were defined as new buildings (6554 buildings). See Alexandre et al. (2015) for detailed methods. We calculate annual total destruction and destruction rate.
We used the WUI delineation developed by Radeloff et al. (2005) based on the Federal Register (US Department of Agriculture and US Department of the Interior 1995; Glickman and Babbitt 2001), for the conterminous United States, that was based on the 2000 census for housing and 2001 National Land Cover Database for vegetation. We chose these years to characterise the WUI at the beginning of the 2000–2013 timeframe. Areas mapped as WUI are census blocks (with public lands removed) with at least 6.17 housing units km−2 that had >50% wildland vegetation within the terrestrial area of the census block (intermix WUI), or were within 2.4 km of a large area (over 5 km2) with at least 75% wildland vegetation (interface WUI) (Radeloff et al. 2005). We chose this WUI map because it has been widely used by federal and state agencies, and was recently affirmed by a Presidential Executive Order (Obama 2016).
We compiled data on fire education and mitigation outreach programs from several well established nationwide programs (‘national fire outreach programs’ hereafter; Fig. 1b). These included Fire Learning Network landscapes (for consistency with other data, centroids of landscape polygons were used), Fire Adapted Communities, Firewise Communities (active and inactive), and involvement in other activities linked to Firewise, such as Wildfire Community Preparedness Day (participants and winners), and Firewise Challenge (winners). The compiled dataset consisted of 1715 locations for national fire outreach programs (Fig. 1b). Note that for most of these data, point locations were the only spatial information available, limiting our analyses to the proximity to the centroid of the outreach program, rather than their boundaries. Initiation dates for Fire Adapted Communities and Fire Learning Network landscapes were not available. The 1668 Firewise communities in our dataset were all established between 2002 (when the program was launched) and 2015. Although 1194 Firewise communities were reported as currently active, we were unable to determine the dates of activity for the remaining 28% of Firewise communities (see www.firewise.org/, accessed 24 February 2017). We included all of these communities in our analyses because prior outreach effort may still have had an effect. In addition to national resources, some states also have their own fire outreach programs (e.g. California Fire Safe Council, Texas A&M Forest Service, Nevada’s Living with Fire program). We focussed a case study on California, the state with the greatest number of threatened and destroyed buildings, where we gathered the locations of California’s Fire Safe Councils (California Fire Safe Council 2016) in order to compare national and state programs.
Analyses of WUI extent and fire-affected buildings
To measure how completely buildings that were threatened or destroyed by wildfires were within the mapped WUI, we determined the WUI designation for each building threatened or destroyed. We calculated the percentage of buildings destroyed or surviving located in: non-WUI, intermix, interface and all WUI (intermix or interface) areas. For all buildings outside the WUI – destroyed, surviving, threatened and new – we reported the average distance to the WUI. For buildings that were destroyed outside the WUI, we examined the housing density and wildland vegetation density in their census block and compared them to the WUI definition threshold values (i.e. housing density >6.17 housing units km−2, >50% wildland vegetation, or within 2.4 km of a large (>5 km2) dense (>75%) vegetation patch) to determine why the area was not classified as WUI. We also examined the magnitude of destroyed buildings in low-density non-WUI census blocks that may have been classified as WUI under a different mapping method because of the modifiable areal unit problem (Bar-Massada et al. 2013). We calculated the number of destroyed buildings in non-WUI, low housing density census blocks in a cross-tabulation based on the area and the total number of housing units in those census blocks.
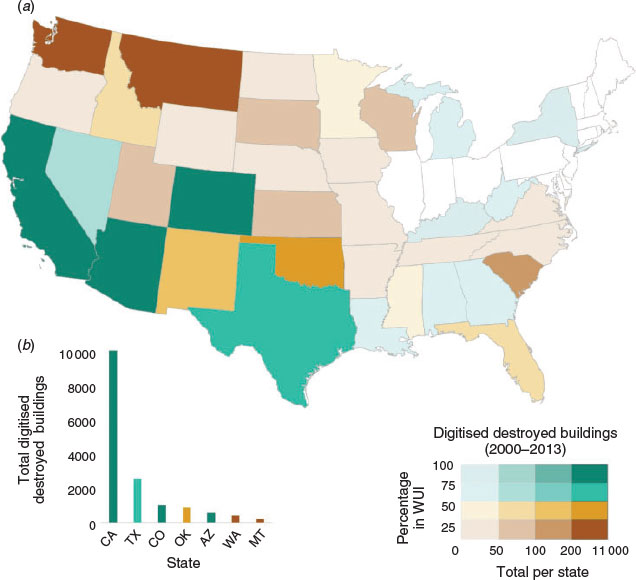
We also calculated and mapped the proportion of destroyed buildings located outside the WUI in each state to see if there were regional differences. To examine the WUI area within fire perimeters, we classified MTBS fires as containing no buildings, only surviving buildings, or destroyed and surviving buildings. For MTBS fires containing buildings, we calculated the area and percentage area of intermix, interface, and non-WUI within each fire perimeter.
To determine whether our results for buildings threatened, surviving or destroyed in the WUI were skewed by a few, highly destructive fires, we also examined the 20 most destructive fires (where the greatest number of buildings were lost), which contained 70% of all destroyed buildings. For these fires, we recalculated the (a) number and (b) percentage of buildings, as well as (c) fire area, and (d) proportion of fire area in the intermix, interface, WUI and non-WUI, and compared these with the results for all fires.
Analyses of outreach programs, wildfire and fire-affected buildings
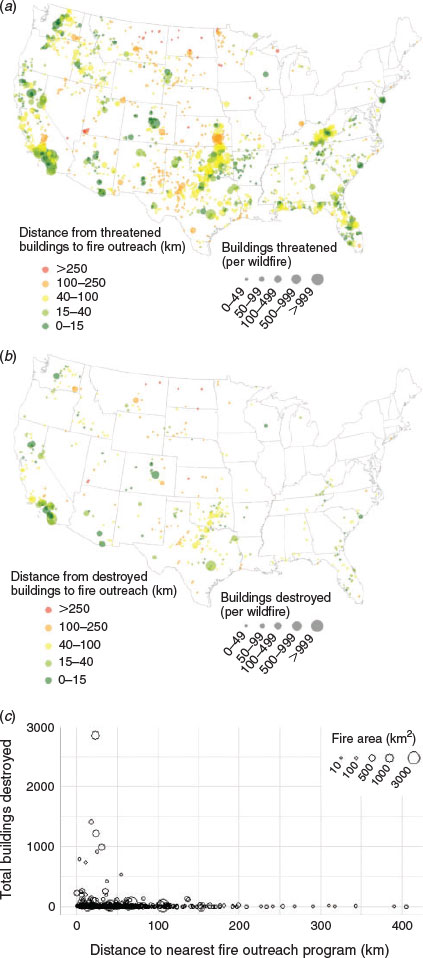
To determine where national fire outreach programs are located relative to wildfires, and to buildings threatened or destroyed by wildfires, we calculated the distance from each outreach point location to the nearest fire perimeter of all fires in the MTBS dataset. We conducted this analysis for all MTBS fires from 2000 to 2013, and from 1990 to 2013 to assess if older fires influenced the establishment of some outreach programs (the latter results are in the supplementary material).
To examine the relationship between buildings and fire outreach at the scale of wildfires, we calculated the number of buildings threatened and destroyed within each fire perimeter, and the average distance from these to the nearest national fire outreach program. We also examined this relationship at the scale of individual buildings and calculated the distance from each building to the nearest national fire outreach location for destroyed, surviving, threatened and new buildings within fire perimeters. Although a linear distance does not fully describe the extent and transmission of wildfire mitigation and education activities (e.g. through community members talking with one another and sharing ideas), it was our best option for approximating resident exposure to fire outreach programs. Accordingly, we summarised data by both average distance and percentage of buildings within 5, 10, 25 and 50 km of outreach programs. We chose these distances to represent a range of potential exposure levels, with 5 km being the closest distance, where it was likely that a resident would be aware of outreach activity, and 50 km being a drivable distance where media sources could be the same, and therefore potential for awareness was possible.
For California, we analysed data from the California Fire Safe Council outreach programs. We mapped the locations of California Fire Safe Councils, national fire outreach programs, and fires that threatened buildings, scaled by the total number of buildings threatened per fire and the distance to the nearest national fire outreach program.
Timing of Firewise establishment
Firewise programs were the most prevalent among the national fire outreach programs, and the only program for which we had dates of establishment. We compared the date of establishment of a given Firewise community to the date that nearby buildings were threatened or destroyed by fire. First, we identified the closest Firewise community centroid to each building that was destroyed by wildfire and determined whether that Firewise program began before or after the fire. From this, we calculated the proportion of all destroyed buildings where Firewise programs were put into place after destructive wildfires.
We also assigned all threatened buildings to the nearest Firewise community centroid to determine whether Firewise was established in that community before or after the majority of fire activity (some areas experienced multiple fires). We classified each Firewise community as either reactive (with most buildings threatened before Firewise establishment) or pre-emptive (with most buildings threatened after Firewise establishment). Although some areas experienced multiple fires, very few communities experienced fires that threatened a large proportion of buildings both before and after Firewise community establishment. Finally, we summarised the distance to the nearest national fire outreach program by building type (i.e. threatened and new buildings), and compared the distributions of these values using a 2-way t-test to test for significant differences. We also compared the destruction rate for different distances to the nearest pre-emptive Firewise community (using breakpoints of 5, 10, 25 and 50 km) to test whether and how proximity affects building survival.
Accuracy assessment
To assess the accuracy of our datasets of digitised buildings, we compared our data to reports of buildings destroyed in each fire, based on Incident Command Status (ICS-209) reports, and to housing unit counts within each fire boundary based on the 2000 and 2010 US censuses (National Wildfire Coordinating Group 2016). These analyses are described in detail and available as Supplementary Material to this paper, and showed good agreement between digitised destroyed buildings and the ICS-209 reports of destroyed primary structures. Digitised threatened buildings showed close correlation with the US census (P < 0.001; R2 = 0.945; slope = 0.97).
Results
WUI extent and fire-affected buildings
A total of 11% of all buildings threatened by wildfire (i.e. within fire perimeters) were destroyed by fire; most buildings survived (Table 1), though inter-annual variability was high (Fig. 1c). Of 689 000 km2 of WUI in the conterminous US, 0.4% burned between 2000 and 2013, yet most buildings threatened by fire were in the WUI (59%; Table 1), and were more often in the intermix than the interface (36 v. 23% respectively; Table 1). Of the 41% of threatened buildings not in the WUI, most were close to it (1.60 km and 2.07 km on average for destroyed and surviving buildings respectively; Table 2). Buildings that were destroyed were more often located in the WUI than buildings that survived (69 v. 58% respectively), despite the fact that nearly 98% of the burned area of those fires that included buildings was outside the WUI (Table 1). For the 31% of destroyed buildings that were outside the WUI, low housing density was almost always the reason for non-WUI designation (93% were below the WUI housing threshold, v. 8.5% below the WUI vegetation threshold; estimates include 1.4% that were below both thresholds, Fig. 2). These destroyed buildings outside the WUI were also not on the cusp of the housing density threshold (most were below 0.5 housing units km−2, compared with the WUI threshold of 6.17 housing units km−2). Examining non-WUI, low density census blocks in a cross-tabulation by size and total housing units, we found that the majority of destroyed buildings in low density, non-WUI census blocks (3093 of 4759) were in blocks with less than 10 total housing units, which are very likely truly low-density (Table 3). In other words, these census blocks were mapped as non-WUI because they contained too few houses, not because they were too large.

|

|

|
|
Examining variation across the US, 16 states had 50 or more buildings destroyed by wildfire, but the majority of destruction occurred inside the WUI in only five states. Here, a total of 76% of destroyed buildings were located in the WUI, and those states contained most of buildings destroyed by fire (85%, mostly in California, which contained 60% of all destroyed buildings). Rates of destruction overall were higher in these states as well (16% for those states v. 11% for all states; Fig. 3b). For the remaining 11 states (accounting for 13% of destroyed buildings), only 32% of destroyed buildings were located in the WUI, and the rate of destruction was low (5% for those states v. 11% for all states; Fig. 3a).
|
The 20 most destructive fires contained the majority of destroyed buildings, a higher rate of building destruction, and a greater proportion of threatened buildings within the WUI. Although these most destructive fires occurred in multiple states, 12 occurred in California. These 20 destructive fires comprised 3.5% of the burned area in our sample, but contained 70% of all destroyed buildings and 31% of threatened buildings (Appendix 1). A higher proportion of threatened buildings were destroyed in these 20 fires than the less destructive fires (25 v. 4.9% respectively; Appendix 1), and the proportion of threatened buildings that were in the WUI was higher than less destructive fires (80 v. 50% respectively).
Outreach programs, wildfire and fire-affected buildings
National wildfire outreach programs were generally close to both recent fire perimeters and buildings threatened by fire. Most national fire outreach programs (89%) were within 50 km of a fire, and 51% of buildings destroyed by wildfire were within 25 km of a national fire outreach program (Table 2). Although 17% of buildings destroyed by wildfire were 50 km or more from the nearest national fire outreach program (Table 2), the total number of buildings threatened or destroyed by wildfires that were that distant from a program was low (Fig. 4a, b). Although there were clear spatial gaps in national fire outreach programs (Fig. 4), those typically involved fires that destroyed few buildings. Indeed, among the 23 fires that threatened 1000 or more buildings, 17 of which were in California, the average distance between threatened buildings and the nearest national fire outreach program was more than 100 km for only one fire, and more than 40 km for only 4 (Fig. 4a).
|
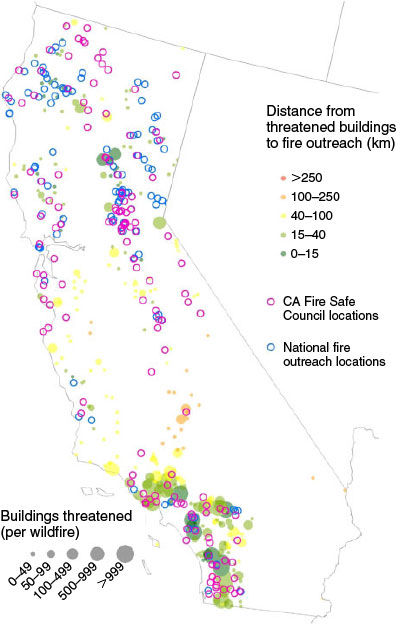
In our California-specific analyses, we analysed 114 national fire outreach program locations and 156 locations of California Fire Safe Councils. Although there was some overlap between locations of the two, most California state programs were dispersed in areas that the national programs did not reach, providing better outreach coverage jointly than indicated by national program locations alone (Fig. 5). Many areas that were close to state programs, but far from national programs, contained buildings threatened by wildfire (Fig. 5), highlighting the importance of a web of national, state and local outreach programs. For example, five fires had threatened or destroyed 324 buildings near Bakersfield, California, 250 km from a national fire outreach program, but within 20 km of the Kern River Valley Fire Safe Council.
|
Timing of Firewise establishment
In many cases, Firewise community establishment occurred after a fire had burned buildings, not before, with a higher rate of destruction near these reactive communities. The majority (76%) of destroyed buildings were located closest to a Firewise community centroid that was established after that building was destroyed (with an average rate of destruction of 12.7% near these communities). When we considered all threatened buildings in relation to pre- or post-fire program establishment, we found that 31% of 1194 Firewise communities were established after the majority of nearby buildings were threatened (Fig. 6a). Of the 69% of Firewise communities that appeared to be pre-emptive, 13% (n = 106) experienced fire that threatened nearby buildings after the program was established, whereas the remaining 87% were not closest to any threatened buildings during our study period. Among buildings nearest to these 106 pre-emptive Firewise communities that were later exposed to wildfire, there was an average destruction rate of 7.3%, with lowest destruction in the immediate vicinity of Firewise community centroids (1.2% within 5 km), increasing to the highest destruction rate between 25 and 50 km (9.5%), and decreasing for further distances (5.0%; Appendix 2). Irrespective of Firewise establishment, we found that new buildings constructed within fire perimeters were significantly farther (P < 0.01) from national fire outreach programs than buildings threatened by the fire with a mean distance of 40 and 47 km respectively (Fig. 6b).

|
Discussion
Our results confirm that the WUI, i.e. the area where houses and wildland vegetation mix, as mapped by Radeloff et al. (2005), overlaps the area where the majority of buildings (69%) were threatened and destroyed by wildfires, despite WUI area only making up a small portion (2%) of the area within perimeters of fires that threatened buildings. However, the location of the WUI relative to buildings destroyed varied across the conterminous United States. WUI losses were most notable in states where the most buildings have been destroyed by fires such as California. However, WUI is a poor predictor of destruction for numerous states with lower, yet not insignificant, building destruction. A sizable portion of buildings that were destroyed here were outside the WUI, typically in areas where housing density was too low to qualify as WUI. Even here, however, most of non-WUI buildings were located in close proximity to WUI (average of 1.6 km nationally for destroyed buildings).
The fact that areas mapped as WUI are indeed where most destroyed buildings are found is both encouraging from a management perspective, but also unsurprising, because these are areas with both wildland vegetation to carry the fire and buildings to burn. It is also unsurprising that WUI comprises a small portion of the total area burned, because areas with extensive wildland fuels are outside the WUI. However, we also expect there to be limitations to using the national WUI maps, as defined by the Federal Register (US Department of Agriculture and US Department of the Interior 1995). The Federal Register definition does not consider risk explicitly, and sizeable WUI areas, especially in the north-eastern US, have low risk of wildfire. Although the overall area of the WUI is small (10% of the conterminous US in 2010), it contained 33% of all housing units (totalling 43 million), showing that the WUI alone is a poor predictor of the location of the 17 079 buildings destroyed by fire in our 14-year sample (Radeloff et al. 2018). By combining the WUI map with wildfire risk data (e.g. Haas et al. 2013; Hawbaker et al. 2013; Dillon et al. 2015), managers can further determine key areas where fire prevention and outreach should be concentrated. In addition, the WUI map we used is based on housing data from the decennial census, which is provided for polygons, not individual houses. Where we found that housing density was too low to meet WUI thresholds of 6.17 housing units km−2, these densities are based on entire census blocks, and not on the housing densities around actual buildings lost. Where datasets on housing locations are available, building-level WUI mapping is possible (Bar-Massada et al. 2013), but such data were not available to us for the conterminous US. Without such spatial data on buildings at a national extent, the details of these non-WUI environments remain somewhat unknown, but the low housing densities within these Census blocks (less than 0.5 housing units km−2) and lower rates of loss in wildfire events suggest that these states and environments may be substantially different than popular conceptions of the WUI. Here, a more varied approach to fire prevention and outreach may be necessary, given the diversity of communities at risk to wildfire (Alexandre et al. 2016; Paveglio and Edgeley 2017; Paveglio et al. 2017). More detailed information on building locations could help communities generate local assessments of WUI risk (e.g. Bar-Massada et al. 2013), but nationally consistent estimates will remain important for larger-scale policy and management.
The main tool for addressing wildfire risk nationally remains fire outreach programs, and we found that these programs were typically near recent fire perimeters (89% within 50 km), especially for fires that threatened many buildings. Fires that threatened 1000 or more buildings almost always had a nearby national fire outreach program. There were some notable gaps with no programs despite fire activity (Fig. 4), but in some locations those gaps may be filled by state or local programs, for which we lacked spatial data. For example, our case study of California’s Fire Safe Council programs revealed that the area near Bakersfield in south-eastern California, where five fires destroyed hundreds of buildings, was far from national fire outreach programs, yet within 20 km of local outreach.
Analyses of national wildfire outreach programs revealed that many of these programs were established after a destructive fire event, indicating that, although wildfire losses may spur community level action, there remains a temporal gap between need and establishment. This need continues to increase: new construction within recent fire perimeters occurred farther from existing fire outreach programs than buildings at the time of the fire, indicating an expansion of this area of need. WUI growth has been consistent over the past two decades (Radeloff et al. 2018) and residential development continues even after wildfire losses (Alexandre et al. 2015). Although these newer buildings may use more fire-resistant building materials, codes mandating the use of these materials are not present in many fire-prone areas, and many additional factors, including building accessibility, determine the susceptibility of a building to wildfire, suggesting that the need for wildfire education and outreach will remain (Mockrin et al. 2016; Syphard et al. 2017). Although continued program expansion seems to be occurring for Firewise, which has been increasing steadily since its establishment in 2002, it is unclear how much expansion will be necessary to meaningfully reduce wildfire risk, and indeed, how effective these programs are in reducing wildfire losses (Paveglio and Kelly 2017).
Our results indicate that buildings near pre-existing Firewise community centroids had a lower rate of destruction than those further from Firewise communities, but more research is needed to establish that Firewise programs lead to a reduction in wildfire risks. Although our results showed that many Firewise programs were reactive, we are not suggesting that they do not have value, and it is important to point out that many buildings are lost even where fire outreach programs are proactive (Calkin et al. 2011b). Numerous factors other than the existence of nearby fire resources influence a resident’s decision to reduce fire susceptibility on their property (Price and Bradstock 2013; Olsen et al. 2017), including differences in social vulnerability (Collins and Bolin 2009; Ojerio et al. 2010; Gaither et al. 2011; Wigtil et al. 2016). Additionally, factors outside a landowner’s control can have a major effect on the survivability of a building, such as topography, nearby vegetation, and nearby buildings (Price and Bradstock 2013; Syphard et al. 2013; Alexandre et al. 2016; Clark et al. 2016), as well as differences in values among neighbours in a community (Collins and Bolin 2009; Skowronski et al. 2016; Singer et al. 2017). However, programs such as CWPPs can create important partnerships and build relationships that are critical for communities after a wildfire (Jakes and Sturtevant 2013). These benefits of fire outreach programs are important even if they do not directly contribute to preventing structural loss to wildfire.
Furthermore, the national fire outreach programs that we analysed did not specify the area, neighbourhood, or community that they were serving, making it necessary to use some proximity metric and rendering an exact assessment of inside or outside a Firewise community infeasible. If agencies were to record outreach program boundaries spatially and at the national scale, additional meaningful analyses would be possible. When testing the effect of distance from Firewise community centroids on building survival, numerous potential confounding factors were ignored (such as specific weather, topography and vegetation present during the fire, and for different locations), so our findings should be considered in this rough, general context. Residential development occurs against the back drop of other landscape-level changes, which combine to alter wildfire risk. Historic fire patterns, such as the fire perimeters and losses we use for these analyses, may not be reliable indicators of current and future fire risk (Schoennagel et al. 2017). Climate change and continued fire suppression indicate a future with more frequent, larger and more destructive fires (Hessburg et al. 2005; Abatzoglou and Williams 2016). As people continue to build new homes in the wildland, the WUI (as well as nearby non-WUI areas) will require increased fire outreach programs in addition to improvements in road, water and fire-fighting infrastructure. Continuing efforts to change homeowner behaviour in mitigating for fire on their own property and throughout the community is vital. Land-use planning, building regulations and zoning laws could also be used to encourage safer building practices (Syphard et al. 2013; Mockrin et al. 2016). Even communities that are deeply committed to community fire resilience are not completely safe. Recently, disaster research has turned its attention to planning for recovery, which is critical for all communities at risk of fire, regardless of their level of preparedness. Fire outreach programs have not yet incorporated recovery planning, though incorporating it into the various fire outreach programs would be a logical next step. Communities that plan for recovery may be better poised to take advantage of the post-wildfire window of opportunity to better adapt to wildfire (McGee 2011; Mockrin et al. 2016), and maintaining local autonomy and control in this planning process is consistent with the emphasis that State Foresters and other advocates (Western Governors’ Alliance) place on local autonomy.
In summary, most buildings destroyed by wildfire were within the WUI, especially in the states where most destroyed buildings were located, but in other states, the majority of destroyed buildings were located outside the WUI, largely because housing densities were far below the WUI threshold. The WUI is important, especially for fires that threaten and destroy many buildings, but our results identify regions where residents outside the WUI are also in need of outreach. National fire outreach programs were typically near buildings that were threatened and destroyed by wildfire, but many were not established until after a destructive fire event, indicating an ongoing need to support communities to be proactive about wildfire risk.
Conflicts of interest
The authors declare that they have no conflicts of interest.

|
|
Acknowledgements
We gratefully acknowledge support for this work by the Joint Fire Science Program and the Rocky Mountain Research Station and Northern Research Station of the USDA. We thank J. Canfield, J. M. Grove, and anonymous reviewers for helpful comments on this manuscript. D. Helmers provided guidance on geoprocessing, and C. Frederick, A. Ciurro, A. Bontje, C. Trott, B. Fendt and Teng H. Ng assisted with data collection.
References
Abatzoglou JT, Williams AP (2016) Impact of anthropogenic climate change on wildfire across western US forests. Proceedings of the National Academy of Sciences of the United States of America 113, 11770–11775.| Impact of anthropogenic climate change on wildfire across western US forests.Crossref | GoogleScholarGoogle Scholar | 1:CAS:528:DC%2BC28Xhs1elur3K&md5=adc1c122ca004fbc9bfa5a07150a254fCAS |
Alexandre PM, Mockrin MH, Stewart SI, Hammer RB, Radeloff VC (2015) Rebuilding and new housing development after wildfire. International Journal of Wildland Fire 24, 138–149.
| Rebuilding and new housing development after wildfire.Crossref | GoogleScholarGoogle Scholar |
Alexandre PM, Stewart SI, Keuler NS, Clayton MK, Mockrin MH, Bar‐Massada A, Syphard AD, Radeloff VC (2016) Factors related to building loss due to wildfires in the conterminous United States. Ecological Applications 26, 2323–2338.
| Factors related to building loss due to wildfires in the conterminous United States.Crossref | GoogleScholarGoogle Scholar |
Argañaraz J, Radeloff V, Bar-Massada A, Gavier-Pizarro G, Scavuzzo C, Bellis L (2017) Assessing wildfire exposure in the wildland–urban interface area of the mountains of central Argentina. Journal of Environmental Management 196, 499–510.
| Assessing wildfire exposure in the wildland–urban interface area of the mountains of central Argentina.Crossref | GoogleScholarGoogle Scholar |
Association for Fire Ecology (2015) Reduce wildfire risks or we’ll continue to pay more for fire disasters. Available at http://fireecology.org/Resources/Documents/Reduce-Wildfire-Risk-16-April-2015-Final-Print.pdf [Verified 22 February 2017]
Bar-Massada A, Stewart SI, Hammer RB, Mockrin MH, Radeloff VC (2013) Using structure locations as a basis for mapping the wildland–urban interface. Journal of Environmental Management 128, 540–547.
| Using structure locations as a basis for mapping the wildland–urban interface.Crossref | GoogleScholarGoogle Scholar |
Birkland TA (2006) ‘Lessons of disaster: policy change after catastrophic events.’ (Georgetown University Press: Washington, DC, USA)
California Fire Safe Council (2016) California Fire Safe Council: map of local fire safe councils. Available at http://www.cafiresafecouncil.org/index2.php/?page_id=1155 [Verified 15 December 2016]
Calkin DE, Gebert KM, Jones JG, Neilson RP (2005) Forest Service large fire area burned and suppression expenditure trends, 1970–2002. Journal of Forestry 103, 179–183.
Calkin DE, Rieck JD, Hyde KD, Kaiden JD (2011a) Built structure identification in wildland fire decision support. International Journal of Wildland Fire 20, 78–90.
Calkin DC, Finney MA, Ager AA, Thompson MP, Gebert KM (2011b) Progress towards and barriers to implementation of a risk framework for US federal wildland fire policy and decision making. Forest Policy and Economics 13, 378–389.
| Progress towards and barriers to implementation of a risk framework for US federal wildland fire policy and decision making.Crossref | GoogleScholarGoogle Scholar |
Calkin DE, Cohen JD, Finney MA, Thompson MP (2014) How risk management can prevent future wildfire disasters in the wildland–urban interface. Proceedings of the National Academy of Sciences of the United States of America 111, 746–751.
| How risk management can prevent future wildfire disasters in the wildland–urban interface.Crossref | GoogleScholarGoogle Scholar | 1:CAS:528:DC%2BC2cXotFCgug%3D%3D&md5=cfdb2d5a3108bd05cefd8f9ab300109aCAS |
Champ PA, Brenkert‐Smith H (2016) Is seeing believing? Perceptions of wildfire risk over time. Risk Analysis 36, 816–830.
| Is seeing believing? Perceptions of wildfire risk over time.Crossref | GoogleScholarGoogle Scholar |
Chas-Amil M, Touza J, García-Martínez E (2013) Forest fires in the wildland–urban interface: a spatial analysis of forest fragmentation and human impacts. Applied Geography 43, 127–137.
| Forest fires in the wildland–urban interface: a spatial analysis of forest fragmentation and human impacts.Crossref | GoogleScholarGoogle Scholar |
Clark AM, Rashford BS, McLeod DM, Lieske SN, Coupal RH, Albeke SE (2016) The impact of residential development pattern on wildland fire suppression expenditures. Land Economics 92, 656–678.
| The impact of residential development pattern on wildland fire suppression expenditures.Crossref | GoogleScholarGoogle Scholar |
Cohen JD (2000) Preventing disaster: home ignitability in the wildland–urban interface. Journal of Forestry 98, 15–21.
Collins TW, Bolin B (2009) Situating hazard vulnerability: people’s negotiations with wildfire environments in the US Southwest. Environmental Management 44, 441–455.
| Situating hazard vulnerability: people’s negotiations with wildfire environments in the US Southwest.Crossref | GoogleScholarGoogle Scholar |
Dillon GK, Menakis J, Fay F (2015) Wildland fire potential: a tool for assessing wildfire risk and fuels management needs. In ‘Proceedings of the large wildland fires conference’, 19–23 May 2014, Missoula, MT. (Eds RE Keane, M Jolly, R Parsons, K Riley) USDA Forest Service, Rocky Mountain Research Station, Proceedings RMRS-P-73, pp. 60–76. (Fort Collins, CO, USA)
Duerksen C, Elliot D, Anthony P (2011) Addressing Community Wildfire Risk: A Review and Assessment of Regulatory and Planning Tools. The Fire Protection Research Foundation, Quincy, MA, USA.
Finney MA, McHugh CW, Grenfell IC, Riley KL, Short KC (2011) A simulation of probabilistic wildfire risk components for the continental United States. Stochastic Environmental Research and Risk Assessment 25, 973–1000.
| A simulation of probabilistic wildfire risk components for the continental United States.Crossref | GoogleScholarGoogle Scholar |
Gaither CJ, Poudyal NC, Goodrick S, Bowker J, Malone S, Gan J (2011) Wildland fire risk and social vulnerability in the southeastern United States: an exploratory spatial data analysis approach. Forest Policy and Economics 13, 24–36.
| Wildland fire risk and social vulnerability in the southeastern United States: an exploratory spatial data analysis approach.Crossref | GoogleScholarGoogle Scholar |
Glickman D, Babbitt B (2001) Urban–wildland interface communities within the vicinity of federal lands that are at high risk from wildfire. Federal Register 66, 751–777.
Gude PH, Jones K, Rasker R, Greenwood MC (2013) Evidence for the effect of homes on wildfire suppression costs. International Journal of Wildland Fire 22, 537–548.
| Evidence for the effect of homes on wildfire suppression costs.Crossref | GoogleScholarGoogle Scholar |
Haas JR, Calkin DE, Thompson MP (2013) A national approach for integrating wildfire simulation modeling into wildland–urban interface risk assessments within the United States. Landscape and Urban Planning 119, 44–53.
| A national approach for integrating wildfire simulation modeling into wildland–urban interface risk assessments within the United States.Crossref | GoogleScholarGoogle Scholar |
Hammer RB, Radeloff VC, Fried JS, Stewart SI (2007) Wildland–urban interface housing growth during the 1990s in California, Oregon, and Washington. International Journal of Wildland Fire 16, 255–265.
| Wildland–urban interface housing growth during the 1990s in California, Oregon, and Washington.Crossref | GoogleScholarGoogle Scholar |
Hand MS, Thompson MP, Calkin DE (2016) Examining heterogeneity and wildfire management expenditures using spatially and temporally descriptive data. Journal of Forest Economics 22, 80–102.
| Examining heterogeneity and wildfire management expenditures using spatially and temporally descriptive data.Crossref | GoogleScholarGoogle Scholar |
Hawbaker TJ, Radeloff VC, Stewart SI, Hammer RB, Keuler NS, Clayton MK (2013) Human and biophysical influences on fire occurrence in the United States. Ecological Applications 23, 565–582.
| Human and biophysical influences on fire occurrence in the United States.Crossref | GoogleScholarGoogle Scholar |
Hessburg PF, Agee JK, Franklin JF (2005) Dry forests and wildland fires of the inland Northwest USA: contrasting the landscape ecology of the pre-settlement and modern eras. Forest Ecology and Management 211, 117–139.
| Dry forests and wildland fires of the inland Northwest USA: contrasting the landscape ecology of the pre-settlement and modern eras.Crossref | GoogleScholarGoogle Scholar |
Jakes PJ, Sturtevant V (2013) Trial by fire: community wildfire protection plans put to the test. International Journal of Wildland Fire 22, 1134–1143.
| Trial by fire: community wildfire protection plans put to the test.Crossref | GoogleScholarGoogle Scholar |
Lampin-Maillet C, Jappiot M, Long M, Bouillon C, Morge D, Ferrier J-P (2010) Mapping wildland-urban interfaces at large scales integrating housing density and vegetation aggregation for fire prevention in the South of France. Journal of Environmental Management 91, 732–741.
| Mapping wildland-urban interfaces at large scales integrating housing density and vegetation aggregation for fire prevention in the South of France.Crossref | GoogleScholarGoogle Scholar |
McGee TK (2011) Public engagement in neighbourhood level wildfire mitigation and preparedness: case studies from Canada, the US and Australia. Journal of Environmental Management 92, 2524–2532.
| Public engagement in neighbourhood level wildfire mitigation and preparedness: case studies from Canada, the US and Australia.Crossref | GoogleScholarGoogle Scholar | 1:STN:280:DC%2BC3MjitlKnug%3D%3D&md5=08743dfa699dda1421f21160afe0d8ecCAS |
McLennan J, Every D, Bearman C, Wright L (2017) On the concept of denial of natural hazard risk and its use in relation to householder wildfire safety in Australia. International Journal of Disaster Risk Reduction 21, 176–186.
| On the concept of denial of natural hazard risk and its use in relation to householder wildfire safety in Australia.Crossref | GoogleScholarGoogle Scholar |
Mhawej M, Faour G, Adjizian-Gerard J (2017) Establishing the wildland–urban interface building risk index (WUIBRI): the case study of Beit-Meri. Urban Forestry & Urban Greening 24, 175–183.
| Establishing the wildland–urban interface building risk index (WUIBRI): the case study of Beit-Meri.Crossref | GoogleScholarGoogle Scholar |
Mockrin MH, Stewart SI, Radeloff VC, Hammer RB (2016) Recovery and adaptation after wildfire on the Colorado Front Range (2010–12). International Journal of Wildland Fire 25, 1144–1155.
| Recovery and adaptation after wildfire on the Colorado Front Range (2010–12).Crossref | GoogleScholarGoogle Scholar |
Moritz MA, Batllori E, Bradstock RA, Gill AM, Handmer J, Hessburg PF, Leonard J, McCaffrey S, Odion DC, Schoennagel T (2014) Learning to coexist with wildfire. Nature 515, 58–66.
| Learning to coexist with wildfire.Crossref | GoogleScholarGoogle Scholar | 1:CAS:528:DC%2BC2cXitFanu77P&md5=6dad93613a51010175b7d51f43b37939CAS |
National Wildfire Coordinating Group (2016) SIT-209. Available at https://fam.nwcg.gov/fam-web/hist_209/report_list_209 [Verified 15 December 2016]
Obama B (2016) Executive Order – wildland–urban interface federal risk mitigation. The White House, Washington, DC, USA.
Ojerio R, Moseley C, Lynn K, Bania N (2010) Limited involvement of socially vulnerable populations in federal programs to mitigate wildfire risk in Arizona. Natural Hazards Review 12, 28–36.
| Limited involvement of socially vulnerable populations in federal programs to mitigate wildfire risk in Arizona.Crossref | GoogleScholarGoogle Scholar |
Olsen C, Kline J, Ager A, Olsen K, Short K (2017) Examining the influence of biophysical conditions on wildland–urban interface homeowners’ wildfire risk mitigation activities in fire-prone landscapes. Ecology and Society 22, 21
| Examining the influence of biophysical conditions on wildland–urban interface homeowners’ wildfire risk mitigation activities in fire-prone landscapes.Crossref | GoogleScholarGoogle Scholar |
Paveglio T, Edgeley C (2017) Community diversity and hazard events: understanding the evolution of local approaches to wildfire. Natural Hazards 87, 1083–1108.
| Community diversity and hazard events: understanding the evolution of local approaches to wildfire.Crossref | GoogleScholarGoogle Scholar |
Paveglio TB, Kelly E (2017) Influences on the adoption and implementation of a wildfire mitigation program in an Idaho City. Journal of Forestry 116, 47–54.
| Influences on the adoption and implementation of a wildfire mitigation program in an Idaho City.Crossref | GoogleScholarGoogle Scholar |
Paveglio TB, Nielsen-Pincus M, Abrams J, Moseley C (2017) Advancing characterization of social diversity in the wildland-urban interface: an indicator approach for wildfire management. Landscape and Urban Planning 160, 115–126.
| Advancing characterization of social diversity in the wildland-urban interface: an indicator approach for wildfire management.Crossref | GoogleScholarGoogle Scholar |
Price O, Bradstock R (2013) Landscape scale influences of forest area and housing density on house loss in the 2009 Victorian bushfires. PLoS One 8, e73421
| Landscape scale influences of forest area and housing density on house loss in the 2009 Victorian bushfires.Crossref | GoogleScholarGoogle Scholar | 1:CAS:528:DC%2BC3sXhsVWht7rJ&md5=8da32ba935c00a3f4982af7353d3c927CAS |
Radeloff VC, Hammer RB, Stewart SI, Fried JS, Holcomb SS, McKeefry JF (2005) The wildland–urban interface in the United States. Ecological Applications 15, 799–805.
| The wildland–urban interface in the United States.Crossref | GoogleScholarGoogle Scholar |
Radeloff V, Helmers DP, Kramer Ha, Mockrin MH, Alexandre PM, Bar-Massada A, Butsic V, Hawbaker T, Martinuzzi S, Syphard AD, Stewart S (2018) Rapid growth of the US wildland–urban interface increases wildfire risk. Proceedings of the National Academy of Sciences of the United States of America 115, 3314–3319.
| Rapid growth of the US wildland–urban interface increases wildfire risk.Crossref | GoogleScholarGoogle Scholar |
Richardson LA, Champ PA, Loomis JB (2012) The hidden cost of wildfires: economic valuation of health effects of wildfire smoke exposure in Southern California. Journal of Forest Economics 18, 14–35.
| The hidden cost of wildfires: economic valuation of health effects of wildfire smoke exposure in Southern California.Crossref | GoogleScholarGoogle Scholar |
Schoennagel T, Nelson CR, Theobald DM, Carnwath GC, Chapman TB (2009) Implementation of National Fire Plan treatments near the wildland–urban interface in the western United States. Proceedings of the National Academy of Sciences of the United States of America 106, 10706–10711.
| Implementation of National Fire Plan treatments near the wildland–urban interface in the western United States.Crossref | GoogleScholarGoogle Scholar | 1:CAS:528:DC%2BD1MXos1ajsbc%3D&md5=c3f4779f8f5916f9483f50ebbfad8f5aCAS |
Schoennagel T, Balch JK, Brenkert-Smith H, Dennison PE, Harvey BJ, Krawchuk MA, Mietkiewicz N, Morgan P, Moritz MA, Rasker R (2017) Adapt to more wildfire in western North American forests as climate changes. Proceedings of the National Academy of Sciences of the United States of America 114, 4582–4590.
| Adapt to more wildfire in western North American forests as climate changes.Crossref | GoogleScholarGoogle Scholar | 1:CAS:528:DC%2BC2sXmtFGgu78%3D&md5=3e9664fccadcf6763c737e516f5f81e1CAS |
Singer A, Jetter AJ, Ellsworth LM, Gray SA, Zhang P, Laraichi MO (2017) Policy scenarios for fire-adapted communities: understanding stakeholder risk perceptions in Ashland, Oregon. Ver. 1.0; based on results of JFSP 14-2-01-26, March 6, 2017. Available at https://static1.squarespace.com/static/56eb240ab654f9cd9f495b83/t/58c1cd0f3a04110deee4eaa6/1489095961499/V1Ashland+Case+Study.pdf [Verified 11 April 2018]
Skowronski NS, Haag S, Trimble J, Clark KL, Gallagher MR, Lathrop RG (2016) Structure-level fuel load assessment in the wildland–urban interface: a fusion of airborne laser scanning and spectral remote-sensing methodologies. International Journal of Wildland Fire 25, 547–557.
| Structure-level fuel load assessment in the wildland–urban interface: a fusion of airborne laser scanning and spectral remote-sensing methodologies.Crossref | GoogleScholarGoogle Scholar |
Solecki WD, Michaels S (1994) Looking through the postdisaster policy window. Environmental Management 18, 587–595.
| Looking through the postdisaster policy window.Crossref | GoogleScholarGoogle Scholar |
Syphard AD, Massada AB, Butsic V, Keeley JE (2013) Land use planning and wildfire: development policies influence future probability of housing loss. PLoS One 8, e71708
| Land use planning and wildfire: development policies influence future probability of housing loss.Crossref | GoogleScholarGoogle Scholar | 1:CAS:528:DC%2BC3sXhtleru7fI&md5=4591060cb6c567390ca49be59bad2d5cCAS |
Syphard AD, Brennan TJ, Keeley JE (2017) The importance of building construction materials relative to other factors affecting structure survival during wildfire. International Journal of Disaster Risk Reduction 21, 140–147.
| The importance of building construction materials relative to other factors affecting structure survival during wildfire.Crossref | GoogleScholarGoogle Scholar |
Theobald DM, Romme WH (2007) Expansion of the US wildland–urban interface. Landscape and Urban Planning 83, 340–354.
| Expansion of the US wildland–urban interface.Crossref | GoogleScholarGoogle Scholar |
United States Congress (2003) Healthy Forests Restoration Act. Committee on House Agriculture; House Resources; House Judiciary; Senate Agriculture, Nutrition, and Forestry; Senate Energy and Natural Resources; House Transportation and Infrastructure. 108th Congress, 1st session. 2003. Public Law number 108–148, Washington, DC, USA.
US Department of Agriculture and US Department of the Interior (1995) ‘Federal wildland fire management policy and program review.’ (USDA: Washington, DC, USA)
Westhaver A (2016) Why some homes survived: learning from the Fort McMurray wildland–urban interface fire disaster; preliminary report. Institute for Catastrophic Loss Reduction. Toronto, ON, Canada.
Wigtil G, Hammer RB, Kline JD, Mockrin MH, Stewart SI, Roper D, Radeloff VC (2016) Places where wildfire potential and social vulnerability coincide in the coterminous United States. International Journal of Wildland Fire 25, 896–908.
| Places where wildfire potential and social vulnerability coincide in the coterminous United States.Crossref | GoogleScholarGoogle Scholar |
Wildland Fire Executive Council (2014) The National Strategy: the final phase in the development of the National Cohesive Wildland Fire Management Strategy. Available at https://www.forestsandrangelands.gov/strategy/documents/strategy/CSPhaseIIINationalStrategyApr2014.pdf [Verified 23 May 2017]
Wilmer B, Aplet G (2005) ‘Targeting the community fire planning zone: mapping matters.’ (The Wilderness Sociey: Washington, DC, USA)
Wolters EA, Steel BS, Weston D, Brunson M (2017) Determinants of residential Firewise behaviors in Central Oregon. The Social Science Journal 54, 168–178.
| Determinants of residential Firewise behaviors in Central Oregon.Crossref | GoogleScholarGoogle Scholar |