

A satellite-based burned area dataset for the northern boreal region from 1982 to 2020
José-Andrés Moreno-Ruiz A , José-Rafael García-Lázaro A , Manuel Arbelo B * and Pedro A. Hernández-Leal B
A Departamento de Informática, Universidad de Almería, 04120 Almería, Spain. Email: jaruiz@ual.es; jrgarcia@ual.es
B Departamento de Física, Universidad de La Laguna, 38200 San Cristóbal de La Laguna, Spain. Email: marbelo@ull.es; pedro.hernandez@ull.es
International Journal of Wildland Fire 32(6) 854-871 https://doi.org/10.1071/WF22102
Submitted: 22 June 2022 Accepted: 15 April 2023 Published: 4 May 2023
© 2023 The Author(s) (or their employer(s)). Published by CSIRO Publishing on behalf of IAWF. This is an open access article distributed under the Creative Commons Attribution-NonCommercial-NoDerivatives 4.0 International License (CC BY-NC-ND)
Abstract
Background: Fires in the boreal forest occur with natural frequencies and patterns. Burned area (BA) is an essential variable in assessing the impact of climate change in boreal regions.
Aims: Spatial wildfire occurrence data since the 1950s are available for North America. However, there are no reliable data for Eurasia, mainly for Siberia, during the 1980s and 1990s.
Methods: A Bayesian-network algorithm was applied to the Long-Term Data Record (LTDR) Version 5 to generate a BA DataSet (BA-LTDR-DS) for the Boreal region from 1982 to 2020, validated using official reference data and compared with the MODIS MCD64A1 product.
Key results: A high correlation (>93%) with all the reference BA datasets was found. BA-LTDR-DS data grouped by decades estimated a linear increase in BA of 4.47 million ha/decade. This trend provides evidence of how global warming affects fire activity in these boreal forests.
Conclusions: BA-LTDR-DS constitutes a unique data source for the pre-MODIS era, and becomes a reliable source when other products with higher spatial/spectral resolution are not available.
Implications: The BA-LTDR-DS dataset constitutes the longest time series developed for the boreal region at this spatial resolution. BA-LTDR-DS could be used as input in global climate models, helping improve wildfire prediction capabilities and understand the interactions between fire, climate and vegetation dynamics.
Keywords: AVHRR, Bayesian network algorithm, boreal forest, burned area mapping, Eurasia, LTDR, MODIS, North America, remote sensing, Siberia, time series analysis.
Introduction
The boreal forest is the most extensive terrestrial biome; it occupies ~14% of land on Earth in a circumpolar belt surrounding the subarctic regions of the northern hemisphere. Two-thirds of these forests are in Eurasia (Scandinavia and Russia), the remaining third in North America (Canada and Alaska). Boreal forests play a critical role in regulating climate and the global carbon cycle in the Earth–atmosphere system (Chapin et al. 2000; Kasischke et al. 2005). Boreal forests have been considered for years as a carbon sink (Jobbágy and Jackson 2000; Ciais et al. 2010; Pan et al. 2011). In fact, more carbon is stored in the boreal forest regions than in any other region of the planet, possibly up to twice as much carbon as is stored in tropical forests (Bradshaw and Warkentin 2015). However, recent studies show that boreal forest carbon sinks could even be becoming a net source of emissions (Bonan 2008; Kurz et al. 2008; Bradshaw and Warkentin 2015; Portier et al. 2019; Eckdahl et al. 2022). The rapid warming that the boreal and Arctic regions have experienced over the past 30 years is modifying the dynamics of natural disturbances that were historically dominated by fire (Walsh 2014). This anomalous increase in temperature alters the humidity of the fuels and, therefore, modifies the severity, the natural regime of boreal forest fires and the burned area, which leads, in turn, to possible feedback effects on climate change (Goldammer and Furyaev 1996; Flannigan et al. 2005; Balshi et al. 2009a, 2009b; Tchebakova et al. 2009; Georgiadi et al. 2010; de Groot et al. 2013; Kelly et al. 2013; Coffield et al. 2019). The monitoring of these changes and the analysis of future scenarios are of vital importance to implement management policies on climate change that protect both the boreal forest and the carbon it stores (Bonan et al. 1992; Kasischke et al. 1995; Fuchs et al. 2009; Shuman et al. 2011; Loboda et al. 2012; Krylov et al. 2014; Ponomarev et al. 2016).
Satellite remote sensing has become an effective technique for the identification and spatio-temporal characterisation of forest fires and burned areas owing to its coverage on both a global and regional scale (Andreae 1991; Cooke et al. 1996; Dwyer et al. 2000; Duncan 2003; Chu and Guo 2015). Currently, different platforms provide satellite images that are used in algorithms to map burned area (BA) (Vivchar 2011; Mouillot et al. 2014; Campagnolo et al. 2016; Chen et al. 2016a, 2016b). The Moderate-Resolution Imaging Spectroradiometer (MODIS) on board NASA’s Terra and Aqua satellites and the Advanced Very High Resolution Radiometer (AVHRR) on board the series of National Oceanic and Atmospheric Administration (NOAA) satellites are examples of such sensors. They provide daily imagery and higher-level land and atmosphere products for global mapping. For reliability and period covered, the most frequently used BA products are MODIS Collection 6 (MCD64A1) (Giglio et al. 2018; Boschetti et al. 2019) from the year 2000 onwards, the Global Fire Emissions Database version 4 (GFED-4) BA available from mid-1995 through to the present (Giglio et al. 2013), and the most recent MODIS product, Fire_cci v5.1, available for the years 2001–2020 (Chuvieco et al. 2018). As Chuvieco et al. (2008) argue, ‘Longer time series data are required to acquire a better understanding of fire regimes, and their mutual relationships with global warming.’ In spite of the fact that current satellite remote sensing systems (and their derived fire products) have enhanced temporal, spatial and spectral resolutions, the availability of well-built geospatial time series is scarce for Eurasia, especially for Siberia (de Groot et al. 2013; Chen et al. 2016a; Eberle et al. 2016; Ponomarev et al. 2016). In addition, measures from satellite data present strong discrepancies in BA estimations with regard to reported data in the official records (Soja et al. 2004; Sukhinin et al. 2004; Vivchar 2011; Kukavskaya 2013; Chen et al. 2016b), unlike North America, which has been well studied (Kasischke and French 1995; Al-Saadi et al. 2008; Chuvieco et al. 2008; Soja et al. 2009; Kasischke et al. 2011; Moreno Ruiz et al. 2012; Loboda et al. 2013; Moreno-Ruiz et al. 2014a, 2014b, 2019).
In this paper, we present the Burned Area Long-Term Data Record DataSet (BA-LTDR-DS), a unique long-term BA product of the boreal forest in the Climate Modelling Grid (CMG) resolution for four decades (1982–2020). The CMG format, in a latitude/longitude geographic projection with a resolution of 0.05°, allows the BA-LTDR-DS dataset to be used as input in global climate models, helping to improve wildfire prediction capabilities and understand the interactions between fire, climate and vegetation dynamics in the northern boreal region.
Materials and methods
Study region
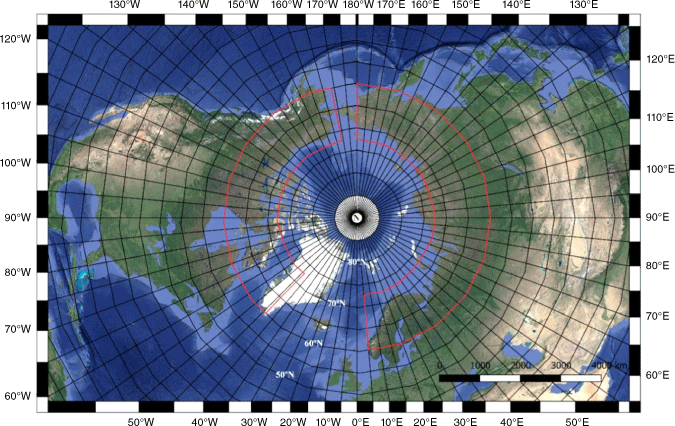
The study region is geographically delimited by the parallels 60°N and 72.5°N, divided in turn into two sub-regions, North America and Eurasia (Fig. 1). The first sub-region includes Alaska and the northern part of the Canadian boreal region and is bounded at the upper right corner of the map at 72.5°N, 168.5°W and the bottom left corner at 60°N 43.5°W. The North American sub-region contains approximately one-third of the entire boreal region of this continent based on the map described by Brandt (2009). The second region stretches from Scandinavia to the Pacific coasts of Siberia and is limited at the upper right corner at 72.5°N 5°E and the bottom left corner at 60°N 180°E. Evergreen coniferous forests (pine and spruce) predominate in the two sub-regions. However, deciduous forests, mainly birch and larch, can also be found, with a spatial distribution influenced by post-fire dynamics (Rogers et al. 2015). The forests of North America tend to have more black spruce, white spruce and pine species with branches lower to the ground, thinner bark and serotinous cones that open after being burned by fire. The Eurasian forests have more fire-resistant species with thick bark, wetter needles and fewer low branches. In addition, between 25 and 30% of the landscape of the boreal forest region is peatland (organic soils) (Gorham 1991; Wieder et al. 2006; Beaulne et al. 2021; Nelson et al. 2021). The presence of different species between North American and Eurasian forests marks a notable difference in fire regimes between the two regions (de Groot et al. 2013). Fire regimes can differ in the same biome, and the boreal forests of North America and Eurasia are an example of this (Haas et al. 2022). Fires in North America tend to be larger and more intense, with higher fuel consumption (crown fires); in contrast, fires in Eurasia tend to be less intense, with lower fuel consumption (surface fires) (Wooster and Zhang 2004; Wirth 2005; de Groot et al. 2013; Sitnov and Mokhov 2018).
The study region (red perimeter) covers the northern boreal region. It is divided into two sub-regions: North America (72.5°N 168.5°W; 60°N 43.5°W) and Eurasia (72.5°N 5°E; 60°N 180°E). Boreal forest (green) is differentiated from all the other land covers (brown), ice (white) and water bodies (blue).
Reference data
The only databases that include reliable information on fires detected in boreal forests for more than four decades are those created and maintained by US and Canadian forestry agencies. For Eurasia, however, there is no reliable BA reference set covering the study period under consideration (1980–2020), with only MODIS sensor-derived BA products available since 2000.
The Alaska Fire Service (AFS), at Fort Wainwright, AK, USA, maintains a detailed record of all detected fire events since 1940 (https://fire.ak.blm.gov/). This database, in addition to providing the perimeter of each BA, includes additional fire-related information such as the management office, fire name, geographical coordinates, estimated area, cause and relevant comments. The perimeters are always delineated from the best available data source, which can include aerial and high spatial resolution satellite imagery (Landsat type), as well as topographic maps. AFS recognises differences in the scale and accuracy of the perimeters depending on the period. Fires larger than 400 ha are included for fires before 1987, those larger than 40 ha from 1987 to 1989, whereas from 1990 onwards, all fires with a BA larger than 4 ha are considered.
The Canadian National Fire Database (CNFDB) is compiled and maintained by the Canadian Forest Service (https://cwfis.cfs.nrcan.gc.ca/ha/nfdb). CNFDB records fire data of all sizes since 1959 that include fire location and perimeter data supplied by Canadian territorial fire management agencies. The information contained in the CNFDB may not be complete or error-free owing to the different mapping techniques used. In addition, the completeness and quality of the data may vary between agencies and between years. The quality of this database and its usefulness have been demonstrated in several publications (Amiro et al. 2001; Stocks et al. 2003; Parisien et al. 2006; Burton et al. 2008; Hanes et al. 2019).
Recently, the Canada Centre for Mapping and Earth Observation and the Canadian Forest Service developed a new database called the National Burned Area Composite (NBAC) (Hall et al. 2020; Skakun et al. 2021). NBAC improves the BA determination of the CNFDB database using an automatic method based on hotspots and the Normalized Difference Vegetation Index (NDVI) applied to high spatial resolution (less than 30 m) satellite imagery (Hall et al. 2020). NBAC is available for fires recorded from 1986 onwards (Skakun et al. 2022).
The MODIS product selected was the MCD64A1 Collection 6 (Giglio et al. 2018), based on data from the Terra and Aqua satellites and distributed by the Land Processes Distributed Active Archive Center (LP DAAC). MCD64A1 is the NASA official BA product. It is a global monthly gridded product of 500-m spatial resolution. The algorithm used to detect burned pixels considers atmospherically corrected surface reflectances of the shortwave infrared Bands 5 and 7 through a normalised vegetation index in conjunction with active fire data at 1-km resolution. The product contains the estimated burn date, unburned, or even unmapped areas if there were no data to establish burned/unburned status (Giglio et al. 2018). MCD64A1 C6 is currently the product with the highest reliability compared with the other BA products (Padilla et al. 2015; Moreno-Ruiz et al. 2020), and it has the lowest commission and omission errors in the boreal forest region (Boschetti et al. 2019).
Pre-processing of the Long-Term Data Record (LTDR)
The LTDR funded by the Climate Data Record Program of the NOAA National Climatic Data Center is a consistent long-term dataset at a spatial resolution of 0.05° (~5 km) based on daily data from the AVHRR onboard the NOAA satellites and daily data acquired by MODIS onboard NASA’s Terra and Aqua satellites (Pedelty et al. 2007). The daily global LTDR version 5 (1981–2021) used in the present study was downloaded from https://ltdr.nascom.nasa.gov/cgi-bin/ltdr/ltdrPage.cgi. The original files, in hierarchical data format, cover the globe at a 0.05° resolution CMG with 7200 × 3600 cells. The original files were transformed into a binary sequential format (BSQ). Conversion to physical values (surface reflectance and brightness temperature) considered the quality assessment (QA) fields of the Daily Surface Reflectance product (AVH09C1) to remove possible snow-covered pixels and to filter for the presence of clouds using the CLAVR-1 (Clouds from AVHRR-Phase I) algorithm (Stowe et al. 1999). Missing and invalid brightness temperature values found for the NOAA-16 and 18 satellites from 2000 to 2008 were directly replaced by the equivalent values from the MOD09CMG product for that period (https://ladsweb.modaps.eosdis.nasa.gov/archive/allData/6/MOD09CMG). In addition, the significantly decaying orbit of the NOAA-19 satellite from 2018 (Julien and Sobrino 2021; Giglio and Roy 2022) made it necessary to use the MOD09CMG product for this period as well. Finally, to eliminate residual clouds and cloud shadows that could interfere with the discrimination of burned pixels, the maximum brightness temperature (BT_CH3: 3.55–3.93 µm) criterion constructed 10-day composites from the LTDR-BSQ files (Barbosa et al. 1998). This compositing criterion has proved to be effective in discerning burned from unburned areas (Chuvieco et al. 2005). Temperature values above 350 K were considered as erroneous values. Next, two vegetation indices derived from the original bands were calculated, which were useful for BA discrimination in the boreal regions: Global Environmental Monitoring Index (GEMI) (Pinty and Verstraete 1992) and Burned Boreal Forest Index (BBFI) (Moreno Ruiz et al. 2012). Table 1 describes the band configurations of each 10-day composite file in the BSQ format with floating data type.
| Band name | Description | Equation |
| ρ1 | Surface reflectance for red channel | SREFL_CH1 (0.5–0.7 µm) |
| ρ2 | Surface reflectance for near-infrared channel | SREFL_CH2 (0.7–1.0 µm) |
| T | Top of atmosphere brightness temperature (K) | BT_CH3 (3.55–3.93 µm) |
| GEMI | Global Environmental Monitoring Index | |
| BBFI | Burned Boreal Forest Index | |
| QA | Quality assessment field |
The burned area detection algorithm
The methodology developed by Moreno Ruiz et al. (2012), based on a Bayesian network algorithm (BA-LTDR), was applied to the entire study area to obtain the annual BA maps and their corresponding temporal distribution (Moreno Ruiz et al. 2012). This methodology has been previously applied and successfully validated in different boreal regions and for different periods (Núñez-Casillas et al. 2013; Moreno-Ruiz et al. 2014a; García-Lázaro et al. 2018). In the current work, the study region was extended to the northern boreal region (above 60°N) using a single algorithm. This approach allowed the coherence in the two sub-regions (North America and Eurasia) and the two study periods (MODIS and pre-MODIS eras) to be assessed jointly, such that the estimates obtained for one sub-region and period can be extrapolated to other boreal sub-regions and periods. The different steps that constitute this methodology are summarised in Fig. 2 and are described in greater depth in previous studies by the same authors (Moreno-Ruiz et al. 2012, 2014b; Núñez-Casillas et al. 2013; García-Lázaro et al. 2018; Guindos-Rojas et al. 2018). The algorithm calculates 12 statistical variables based on the surface reflectance bands ρ1 and ρ2, the brightness temperature T, and the BBFI and GEMI indices, for the 10-day composite of potential fire dates before and after the fire for the year of the fire event, the year before and the year after. In the northern boreal forest, vegetation takes several years to recover, even more than a decade, which is why it was decided to also analyse the year before and after the fire, with a duration of 2 months for the pre-fire and post-fire periods of each year, starting from the hypothetical ignition date determined by the value of the maximum of the BBFI (Moreno Ruiz et al. 2012). The Bayesian network classifier calculated the normalised probability for the unburned and burned classes using a training set based on the perimeters of the BA that was larger than 1000 ha in the NE Siberia region in 2010. These perimeters were generated from 53 pairs of Landsat-TM images obtained from the United States Geological Survey (USGS) considering pre- and post-fire information at 30-m spatial resolution (García-Lázaro et al. 2018).
Flowchart of the process to obtain annual maps of the BA-LTDR-DS (Burned Area Long-Term Data-Record Dataset) in the northern boreal region for 1982–2020 and to assess their accuracy against reference data (Moreno Ruiz et al. 2012; Núñez-Casillas et al. 2013; Moreno-Ruiz et al. 2014b; García-Lázaro et al. 2018; Guindos-Rojas et al. 2018).
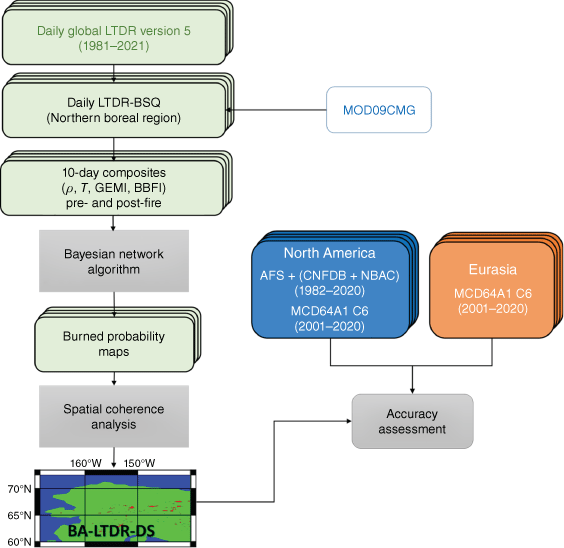
To improve the resulting BA probability maps, the spatial coherence was analysed using a filtering process based on cellular automata theory (Mojaradi et al. 2004; Espinola et al. 2015). Finally, the BA-LTDR algorithm developed was applied to the study region in order to generate a dataset of BA annual maps of the northern boreal forest (above 60°N) for the 1982–2020 period at 0.05° (~5 km) resolution. We refer to this dataset as the BA-LTDR-DS.
Technical validation
To assess the accuracy of the BA-LTDR-DS dataset, we split the time series for both sub-regions (Eurasia and North America), into two – pre-MODIS and post-MODIS. Since 2000 (MODIS era), accuracy assessment for the Eurasian sub-region was accomplished using only the MCD64A1 C6 BA product. Although MODIS data are not the most suitable for quantitative validation of the BA-LTDR-DS product, as they are affected by errors due to their spatial resolution of 500 m, their use may be considered according to the protocol of the Committee on Earth Observation Satellites (CEOS). CEOS recommends that an assessment can be made for systematic quality control of a product by statistical comparison with independently obtained BA datasets of better spatial resolution when no other official reference set exists (Morisette et al. 2006; Boschetti et al. 2009). Before 2000 (pre-MODIS era), accuracy assessments could not be evaluated in this way because other BA products with a higher spatial resolution for this study sub-region (Eurasia) were not available. Fortunately, this is not the case for the North American sub-region, for which official reference data are available to compare with the BA-LTDR-DS dataset, as described in Reference data section. The AFS database and the CNFDB have already been used successfully as reference data to assess the accuracy of satellite-derived BA products (Chuvieco et al. 2008; Chang and Song 2009; Giglio et al. 2009; Núñez-Casillas et al. 2013; Moreno-Ruiz et al. 2019, 2020). The new reference database NBAC, available for the period 1986–2020, was used as the reference set for Canada. The first 4 missing years (1982–1985) were completed with data from CNFDB. NBAC significantly improves the CNFDB BA polygons by including small fires and some fires in remote locations not previously considered in CNFDB, and by removing unburned islands and water bodies within those polygons (Hall et al. 2020; Skakun et al. 2021, 2022). The polygons of all the fires registered in the AFS and CNFDB + NBAC between 1982 and 2020 were used to produce the annual vector layers for ground-truth verification. Next, these vector layers were reprojected to a geographic projection with a pixel size of 0.005° (~500 m) to generate annual ground-truth maps. To determine how the pixel was assigned a burned/non-burned value, the method of maximum area within the pixel was used (Arnone et al. 2016).
However, to compute spatial and temporal accuracy, the annual BA maps from the BA-LTDR-DS and the MCD64A1 C6 datasets were clipped to the North American (72.5°N, 168.5°W, 60°N, 141°W) and Eurasian (72.5°N, 5°E, 60°N, 180°E) boreal sub-regions. All reference data maps were resized to a geographic projection with a pixel size of 5 × 5 km by pixel aggregation (an aggregated pixel represents the percentage of BA at the subpixel level).
The temporal accuracy of the BA-LTDR-DS product in each sub-region was assessed considering the total calculated annual BA. A timing distribution of the BA-LTDR-DS product was represented on a chart together with the time series of reference BAs, and a correlation analysis was carried out. The relative percentages of the annual BA of the BA-LTDR-DS product were calculated with respect to the reference data for the common years when available.
For the spatial accuracy assessment, scatter plots of the annual BA proportions on 50 × 50 km grids distributed uniformly for the BA-LTDR-DS dataset against the reference data in each sub-region were constructed and a linear regression analysis was performed. Next, a detailed analysis of the spatial accuracy for the BA-LTDR-DS dataset was made based on error matrixes versus the reference maps at the pixel level on an annual basis, calculating commission and omission errors of the burned class (Stehman 1997). Omission errors were calculated as the ratio of burned pixels classified as unburned to the total burned pixels in the BA reference map, while commission errors were calculated as the ratio of unburned pixels classified as burned to the total burned pixels in each BA product under analysis. We considered a pixel size of 50 km to prevent errors derived from geo-referencing of the images due to the difference in spatial resolution (Moreno-Ruiz et al. 2014a).
Results
Annual burned area maps for the northern boreal region (LTDR-BA-DB)
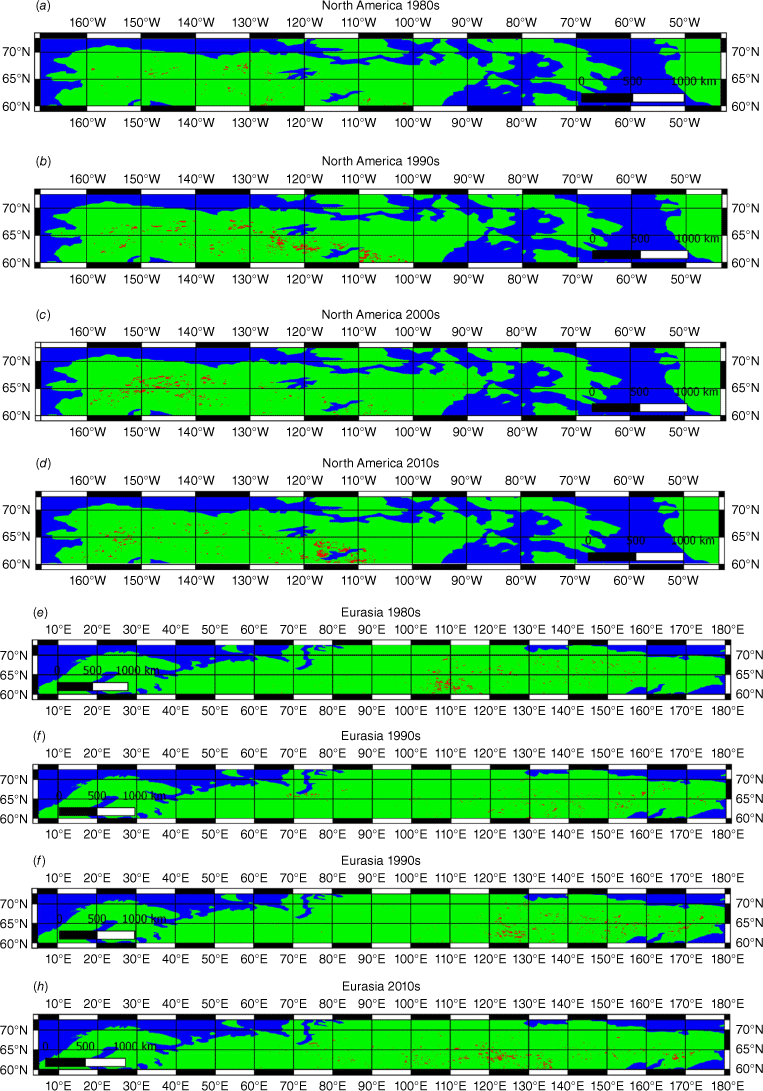
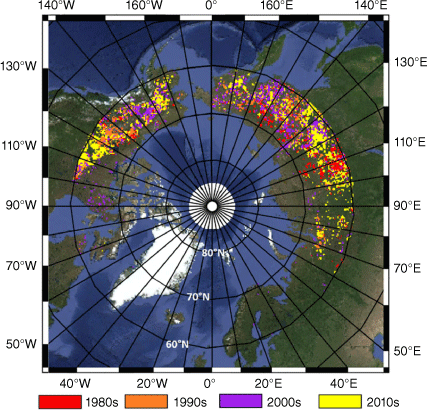
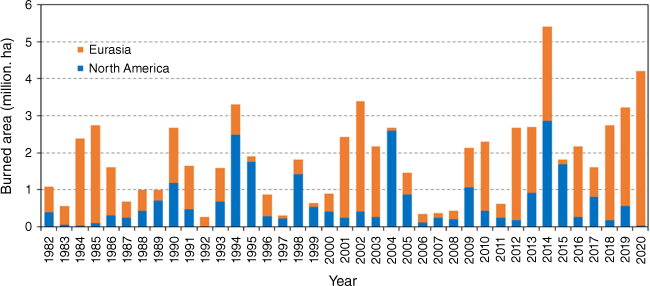
Fig. 3 presents the grouping by decade of the annual maps of BAs for the two boreal sub-regions considered (North America and Eurasia) obtained from the LTDR-BA-DS product with the burned pixels represented in red. Fig. 4 shows a composition with the four decades of the BA detected by BA-LTDR-DS for the northern boreal region considered between the parallels 60°N and 72.5°N.
Annual distribution of the burned area estimates
Fig. 5 shows the estimated annual distribution of BA in the northern boreal region for the period 1982–2020 from the BA-LTDR-DS. A non-uniform pattern was observed with years where strong fire activity was detected (BA > 3 million ha) and other years where barely 0.5 million ha BA was detected. On average, for the entire region and period, ~1.84 million ha burned per year, but with high variability. For example, in 2014 (the year with the greatest BA detected), 5.41 million ha burned whereas in 1992 (the year with the least BA detected), ~0.26 million ha burned. For the entire period analysed, North America had 35.9% of the BA compared with 64.1% in Eurasia. However, this average contribution of each sub-region seems to have no statistical significance owing to the large annual fluctuations. It should be noted, for example, that the greatest imbalances occurred in the year 2020, with a contribution of 0.8% from North America compared with 99.2% from Eurasia, or the opposite case for 2004, where North America contributed 96.7% to the total compared with 3.3% from the rest.
Temporal accuracy
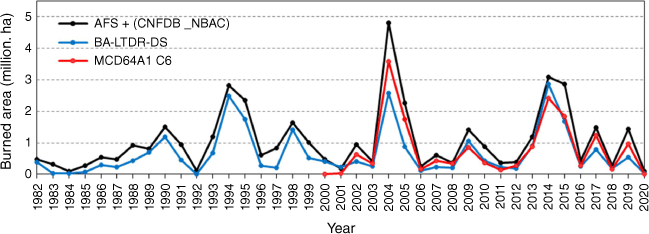
In the North America boreal sub-region, the total BA registered by the AFS and CNFDB + NBAC databases in the 1982–2020 period was 41.23 million ha, with an irregular annual distribution. The highest fire activity (4.79 million ha) occurred in 2004, and the lowest in 1984, when only 0.10 million ha burned. Fig. 6 shows the annual distribution of BA from the reference AFS and CNFDB + NBAC databases, the estimated BA for the BA-LTDR-DS product for the period 1982–2020 and estimates for the MCD64A1 C6 product for the period 2000–2020. The BA-LTDR-DS detected 62% of the reference BA, underestimating the BA in all years in the time series. There is a strong correlation (0.93) between the LTDR-BA-DS data and the reference data. If we divide the time series into two parts, pre-MODIS (1982–1999) and MODIS (2000–2020), the BA-LTDR-DS presents almost homogeneous behaviour, both in the percentage of the estimate of BA (66% vs 60%) and in the correlation coefficient (0.97 vs 0.93) with respect to the reference data. For its part, the MCD64A1 C6 product underestimated BA in North America by approximately 69% with a correlation coefficient of 0.99 with respect to the reference data. Making an inter-comparison of the BA-LTDR-DS with MCD64A1 C6 for the common period (2000–2020), a correlation of 0.93 was found.
Annual distribution of burned area estimate (ha) in the North American boreal sub-region from reference data of AFS (Alaska Fire Service) and CNFDB + NBAC (Canadian National Fire Database + National Burned Area Composite), and the BA-LTDR-DS (Burned Area Long-Term Data-Record Dataset) and the MODIS Collection 6 MCD64A1 C6 burned area products.
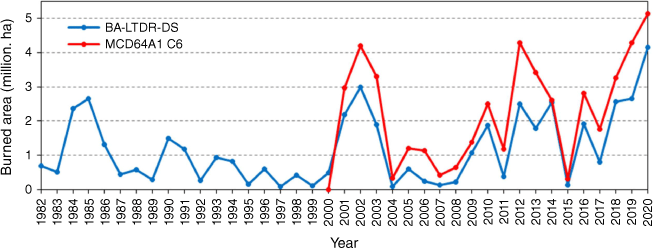
For the time accuracy assessment in the Eurasian sub-region, a correlation analysis between the time series of the BA-LTDR-DS and the MCD64A1 C6 product was conducted (Fig. 7). MCD64A1 C6 was used as the reference data for the common years (2000–2020). MCD64A1 C6 estimated a BA of 47.10 million ha for these years and the BA-LTDR-DS ~66% of that value. The BA-LTDR-DS underestimated the BA in all common years except for 2000. However, its temporal pattern fits remarkably well with that of the reference, yielding a correlation coefficient between MCD64A1 C6 and BA-LTDR-DS of 0.95.
Spatial accuracy
Table 2 shows the results of the linear regression analysis of the BA percentages of the BA-LTDR-DS and the MCD64A1 C6 products versus the reference data. The average determination coefficient (R2) over the 1982–2020 period for the BA-LTDR-DS product was 0.78, with a slope of 0.73, with no significant differences between the two time sub-intervals (pre and MODIS eras). The average determination coefficient (R2) over the 2000–2020 period for MCD64A1 C6 and the BA-LTDR-DS products was 0.88 and 0.78, with a slope of 0.69 and 0.69, respectively.
| Year | BA-LTDR-DS | MCD64A1 C6 | ||||
| Slope | R2 | Intercept | Slope | R2 | Intercept | |
| 1982 | 0.94 | 0.88 | −6.06 × 10⁻⁵ | |||
| 1983 | 0.22 | 0.54 | −3.23 × 10⁻⁵ | |||
| 1984 | 0.01 | 0.00 | 2.73 × 10⁻⁵ | |||
| 1985 | 0.42 | 0.34 | −5.19 × 10⁻⁵ | |||
| 1986 | 0.92 | 0.80 | −2.59 × 10⁻⁴ | |||
| 1987 | 0.73 | 0.79 | −1.28 × 10⁻⁴ | |||
| 1988 | 0.55 | 0.83 | −9.25 × 10⁻⁵ | |||
| 1989 | 1.02 | 0.89 | −1.44 × 10⁻⁴ | |||
| 1990 | 0.87 | 0.86 | −1.40 × 10⁻⁴ | |||
| 1991 | 0.51 | 0.78 | −3.13 × 10⁻⁵ | |||
| 1992 | 0.19 | 0.74 | −1.03 × 10⁻⁵ | |||
| 1993 | 0.69 | 0.86 | −1.94 × 10⁻⁴ | |||
| 1994 | 0.90 | 0.81 | −7.06 × 10⁻⁵ | |||
| 1995 | 0.82 | 0.92 | −2.01 × 10⁻⁴ | |||
| 1996 | 0.57 | 0.59 | −1.02 × 10⁻⁴ | |||
| 1997 | 0.22 | 0.53 | 3.97 × 10⁻⁵ | |||
| 1998 | 1.04 | 0.88 | −3.05 × 10⁻⁴ | |||
| 1999 | 0.76 | 0.80 | −2.89 × 10⁻⁴ | |||
| Subtotal | 0.77 | 0.80 | −1.29 × 10⁻⁴ | |||
| 2000 | 0.21 | 0.14 | 3.57 × 10⁻⁴ | 0 | 0 | 0.00 |
| 2001 | 0.47 | 0.40 | 1.60 × 10⁻⁴ | 0.08 | 0.18 | 2.78 × 10⁻⁵ |
| 2002 | 0.49 | 0.82 | −6.52 × 10⁻⁵ | 0.65 | 0.77 | 3.79 × 10⁻⁵ |
| 2003 | 0.77 | 0.76 | −5.08 × 10⁻⁵ | 0.65 | 0.86 | 1.11 × 10⁻⁴ |
| 2004 | 0.66 | 0.87 | −6.48 × 10⁻⁴ | 0.75 | 0.92 | −1.03 × 10⁻⁵ |
| 2005 | 0.42 | 0.66 | −7.60 × 10⁻⁵ | 0.74 | 0.95 | 7.96 × 10⁻⁵ |
| 2006 | 0.15 | 0.11 | 9.53 × 10⁻⁵ | 0.46 | 0.51 | 6.13 × 10⁻⁵ |
| 2007 | 0.51 | 0.70 | −9.83 × 10⁻⁵ | 0.74 | 0.84 | −2.05 × 10⁻⁵ |
| 2008 | 0.83 | 0.70 | −1.22 × 10⁻⁴ | 0.94 | 0.84 | −1.20 × 10⁻⁵ |
| 2009 | 0.82 | 0.90 | −1.20 × 10⁻⁴ | 0.57 | 0.91 | 6.40 × 10⁻⁵ |
| 2010 | 0.52 | 0.58 | −4.72 × 10⁻⁵ | 0.41 | 0.72 | 6.61 × 10⁻⁶ |
| 2011 | 0.83 | 0.71 | −1.04 × 10⁻⁴ | 0.40 | 0.64 | −4.64 × 10⁻⁶ |
| 2012 | 0.65 | 0.57 | −9.59 × 10⁻⁵ | 0.66 | 0.73 | 3.66 × 10⁻⁵ |
| 2013 | 0.87 | 0.71 | −1.63 × 10⁻⁴ | 0.63 | 0.71 | 1.68 × 10⁻⁴ |
| 2014 | 1.01 | 0.91 | −2.79 × 10⁻⁴ | 0.80 | 0.93 | −4.80 × 10⁻⁵ |
| 2015 | 0.66 | 0.84 | −2.45 × 10⁻⁴ | 0.63 | 0.93 | 2.58 × 10⁻⁵ |
| 2016 | 0.85 | 0.78 | −1.32 × 10⁻⁴ | 0.63 | 0.85 | 1.24 × 10⁻⁵ |
| 2017 | 0.74 | 0.83 | −3.78 × 10⁻⁴ | 0.93 | 0.93 | −1.81 × 10⁻⁴ |
| 2018 | 0.48 | 0.58 | 5.31 × 10⁻⁵ | 0.56 | 0.77 | 8.28 × 10⁻⁶ |
| 2019 | 0.50 | 0.80 | −1.87 × 10⁻⁴ | 0.69 | 0.92 | −2.06 × 10⁻⁵ |
| 2020 | 0.00 | 0.00 | 4.17 × 10⁻⁵ | 0.17 | 0.51 | 3.29 × 10⁻⁶ |
| Subtotal | 0.69 | 0.78 | −1.37 × 10⁻⁴ | 0.71 | 0.88 | −2.25 × 10⁻⁵ |
| Total | 0.73 | 0.78 | −1.33 × 10⁻⁴ | |||
A detailed analysis of the spatial accuracy for the North American sub-region on an annual basis for the BA products BA-LTDR-DS and MCD64A1 C6 is shown in Table 3. The average commission and omission errors for the BA-LTDR-DS are 0.14 and 0.47 respectively for the entire study period whereas for the MODIS era, the MCD64A1 C6 product presents a commission error of 0.09 and omission error of 0.37.
| Year | Burned area product | BA-LTDR-DS | MCD64A1 C6 | ||||
| AFS + CNFDB + NBAC (ha) | BA-LTDR-DS (%) | MCD64A1 C6 (%) | Commission error (%) | Omission error (%) | Commission error (%) | Omission error (%) | |
| 1982 | 470 810.91 | 82.88 | 0.18 | 0.32 | |||
| 1983 | 312 106.13 | 13.45 | 0.13 | 0.88 | |||
| 1984 | 101 568.89 | 25.25 | 0.92 | 0.98 | |||
| 1985 | 281 521.91 | 28.11 | 0.26 | 0.81 | |||
| 1986 | 551 399.00 | 52.63 | 0.18 | 0.55 | |||
| 1987 | 471 069.31 | 50.67 | 0.10 | 0.54 | |||
| 1988 | 914 679.88 | 47.03 | 0.02 | 0.54 | |||
| 1989 | 806 896.13 | 86.53 | 0.20 | 0.31 | |||
| 1990 | 1 511 311.75 | 78.46 | 0.12 | 0.30 | |||
| 1991 | 956 113.50 | 48.88 | 0.11 | 0.57 | |||
| 1992 | 113 351.77 | 11.65 | 0.00 | 0.88 | |||
| 1993 | 1 202 942.50 | 55.73 | 0.06 | 0.48 | |||
| 1994 | 2 817 738.75 | 88.07 | 0.24 | 0.34 | |||
| 1995 | 2 347 522.75 | 74.65 | 0.07 | 0.31 | |||
| 1996 | 616 791.44 | 43.53 | 0.11 | 0.62 | |||
| 1997 | 831 015.56 | 26.50 | 0.02 | 0.74 | |||
| 1998 | 1 632 806.63 | 86.62 | 0.17 | 0.28 | |||
| 1999 | 1 020 825.06 | 52.21 | 0.08 | 0.51 | |||
| Subtotal | 16 960 471.85 | 66.04 | 0.14 | 0.44 | |||
| 2000 | 479 749.16 | 83.99 | 0.00 | 0.82 | 0.85 | 0.00 | 1.00 |
| 2001 | 198 068.03 | 115.33 | 20.63 | 0.64 | 0.57 | 0.28 | 0.85 |
| 2002 | 939 331.00 | 42.76 | 67.45 | 0.02 | 0.58 | 0.15 | 0.42 |
| 2003 | 401 733.69 | 66.45 | 86.16 | 0.22 | 0.48 | 0.29 | 0.38 |
| 2004 | 4 796 367.50 | 53.83 | 74.86 | 0.02 | 0.46 | 0.06 | 0.30 |
| 2005 | 2 259 686.00 | 38.59 | 77.47 | 0.13 | 0.66 | 0.07 | 0.28 |
| 2006 | 249 977.45 | 45.90 | 67.63 | 0.74 | 0.88 | 0.25 | 0.49 |
| 2007 | 615 408.69 | 38.84 | 69.77 | 0.14 | 0.67 | 0.18 | 0.42 |
| 2008 | 370 673.06 | 54.63 | 90.39 | 0.21 | 0.58 | 0.22 | 0.29 |
| 2009 | 1 414 926.75 | 74.69 | 61.33 | 0.08 | 0.31 | 0.05 | 0.42 |
| 2010 | 873 714.75 | 49.57 | 41.42 | 0.17 | 0.60 | 0.07 | 0.61 |
| 2011 | 378 564.19 | 61.19 | 39.67 | 0.18 | 0.52 | 0.11 | 0.65 |
| 2012 | 388 205.44 | 46.21 | 74.48 | 0.21 | 0.65 | 0.28 | 0.47 |
| 2013 | 1 189 221.38 | 76.28 | 74.65 | 0.24 | 0.43 | 0.22 | 0.41 |
| 2014 | 3 089 523.25 | 92.88 | 78.58 | 0.14 | 0.20 | 0.05 | 0.26 |
| 2015 | 2 869 939.50 | 58.78 | 63.98 | 0.07 | 0.46 | 0.04 | 0.39 |
| 2016 | 437 507.47 | 58.94 | 65.29 | 0.17 | 0.51 | 0.13 | 0.43 |
| 2017 | 1 481 237.00 | 53.77 | 83.58 | 0.05 | 0.50 | 0.09 | 0.25 |
| 2018 | 287 749.19 | 63.44 | 60.53 | 0.45 | 0.65 | 0.14 | 0.49 |
| 2019 | 1 436 877.00 | 38.38 | 67.88 | 0.02 | 0.62 | 0.06 | 0.36 |
| 2020 | 109 185.52 | 29.26 | 19.74 | 1.00 | 1.00 | 0.17 | 0.84 |
| Subtotal | 24 267 646.01 | 59.73 | 69.27 | 0.14 | 0.49 | 0.09 | 0.37 |
| Total | 41 228 117.86 | 62.33 | 0.14 | 0.47 | |||
Table 4 shows the results of the accuracy of the BA estimate obtained from the linear regression analysis of the BA percentages from the BA-LTDR-DS product versus MCD64A1 C6 using 50 × 50 km grids. The average determination coefficient (R2) over the 2001–2020 period for the BA-LTDR-DS product was 0.78, with a slope of 0.81.
| Year | Slope | R2 | Intercept |
| 2001 | 0.73 | 0.72 | 5.96 × 10⁻⁵ |
| 2002 | 0.80 | 0.89 | −2.92 × 10⁻⁴ |
| 2003 | 0.70 | 0.77 | −3.53 × 10⁻⁴ |
| 2004 | 0.13 | 0.04 | 4.57 × 10⁻⁵ |
| 2005 | 0.86 | 0.54 | −3.66 × 10⁻⁴ |
| 2006 | 0.17 | 0.14 | 4.01 × 10⁻⁵ |
| 2007 | 0.47 | 0.57 | −6.41 × 10⁻⁵ |
| 2008 | 0.17 | 0.11 | 9.40 × 10⁻⁵ |
| 2009 | 0.89 | 0.69 | −1.28 × 10⁻⁴ |
| 2010 | 0.94 | 0.87 | −3.70 × 10⁻⁴ |
| 2011 | 0.44 | 0.48 | −1.16 × 10⁻⁴ |
| 2012 | 0.73 | 0.76 | −5.00 × 10⁻⁴ |
| 2013 | 0.76 | 0.77 | −7.10 × 10⁻⁴ |
| 2014 | 0.97 | 0.89 | 2.63 × 10⁻⁵ |
| 2015 | 0.14 | 0.04 | 7.85 × 10⁻⁵ |
| 2016 | 0.91 | 0.76 | −5.10 × 10⁻⁴ |
| 2017 | 0.67 | 0.67 | −2.92 × 10⁻⁴ |
| 2018 | 0.95 | 0.85 | −3.87 × 10⁻⁴ |
| 2019 | 0.76 | 0.83 | −4.76 × 10⁻⁴ |
| 2020 | 0.90 | 0.81 | −4.05 × 10⁻⁴ |
| Total | 0.81 | 0.78 | −2.64 × 10⁻⁴ |
Table 5 shows the commission and omission errors derived from the error matrix for each year, taking as reference the MCD64A1 C6 product (only available from the year 2000). For this period, the average commission and omission errors for the BA-LTDR product were 0.21 and 0.47, respectively.
| Year | Burned area | BA-LTDR | ||
| MCD64A1 C6 (ha) | BA-LTDR-DS (%) | Commission error (%) | Omission error (%) | |
| 2001 | 2 961 227.25 | 73.90 | 0.33 | 0.49 |
| 2002 | 4 210 651.50 | 70.92 | 0.13 | 0.38 |
| 2003 | 3 313 822.75 | 57.12 | 0.09 | 0.47 |
| 2004 | 317 166.75 | 27.68 | 0.77 | 0.93 |
| 2005 | 1 201 341.38 | 48.96 | 0.48 | 0.73 |
| 2006 | 1 133 516.88 | 20.31 | 0.63 | 0.92 |
| 2007 | 408 733.25 | 28.54 | 0.45 | 0.85 |
| 2008 | 634 645.56 | 34.22 | 0.68 | 0.88 |
| 2009 | 1 382 174.63 | 76.81 | 0.36 | 0.50 |
| 2010 | 2 490 832.50 | 75.02 | 0.17 | 0.37 |
| 2011 | 1 171 507.13 | 32.29 | 0.17 | 0.74 |
| 2012 | 4 284 292.50 | 58.14 | 0.16 | 0.51 |
| 2013 | 3 418 850.00 | 52.13 | 0.13 | 0.55 |
| 2014 | 2 599 634.75 | 97.66 | 0.21 | 0.22 |
| 2015 | 298 284.50 | 42.98 | 0.87 | 0.94 |
| 2016 | 2 814 615.00 | 68.12 | 0.21 | 0.46 |
| 2017 | 1 753 758.75 | 55.02 | 0.18 | 0.62 |
| 2018 | 3 252 641.00 | 78.81 | 0.20 | 0.35 |
| 2019 | 4 299 331.50 | 61.98 | 0.07 | 0.41 |
| 2020 | 5 149 439.00 | 80.89 | 0.19 | 0.34 |
| Total | 47 096 466.56 | 66.14 | 0.21 | 0.47 |
Discussion
In this paper, we describe the BA-LTDR-DS dataset, which provides annual BA at a spatial resolution of 0.05° from 1982 to 2020 for the boreal region between 60°N and 72.5°N. We built this dataset from the latest released Version 5 of the LTDR dataset. The LTDR Version 5 incorporates improvements of the Bidirectional Reflectance Distribution Function (BRDF) correction, the calibration of AVHRR/3 data on board platforms NOAA-16, 18 and 19, compositing atmospheric corrections and the QAs (https://landweb.modaps.eosdis.nasa.gov/cgi-bin/ltdr/ltdr/ltdrPage.cgi?fileName=LTDR_update). However, as has been discussed in previous studies (Otón et al. 2019, 2021; Giglio and Roy 2022), these effects cannot be eliminated. Indeed, in this new version, we detected missing and wrong values for the TOA brightness temperature bands from the NOAA-16 and 18 satellites (from 2000 to 2008) in the northern boreal region. To preserve the coherence of the temperature bands in the LTDR dataset, we replaced the Band T3 with the Band 20 Brightness Temperature (3.360–3.840 μm) of the MOD09CMG product. In addition, the significantly decaying orbit of the NOAA-19 satellite from 2018 (Julien and Sobrino 2021; Giglio and Roy 2022) made it necessary to use the MOD09CMG product for this period. Finally, the QA bit was updated properly. Using this new modified version of the LTDR, we have generated the longest BA time series yet built at a spatial resolution of 0.05° in the CMG for the northern boreal region. To do this, a machine learning algorithm based on a Bayesian network was used, developed specifically for the detection of BA in that region. The BA-LTDR-DS extends by more than 10 years the time interval of the Global Fire Emissions Database (GFED4), which is from 1995 to the present (Giglio et al. 2013), and improves its spatial resolution by up to five times (from 0.25° to 0.05°) as well as the beta long-term BA dataset (FireCCILT1.0) developed by the Climate Change Initiative (CCI) program of the European Space Agency. In a recent version of the CCI program, Otón et al. (2021) obtained a new product (FireCCILT11) at the same spatial resolution as the BA-LTDR-DS. This product uses a random forest algorithm that calculates the percentages of BA for each pixel (soft classification), unlike BA-LTDR-DS, which only determines whether the pixel is completely burned or not (hard classification). The main problem encountered when comparing BA-LTDR_DS with FIRECCILT11 relates to the years composing both time series: FireCCILT11 is 2 years shorter (ending in 2018) and does not include the year 1994, which considerably distorts the comparison as 1994 was the year with the largest BA in North America.
Evaluating the spatial and temporal accuracy of the entire time series of BA obtained (BA-LTDR-DS) seems very difficult given the non-existence of another set of reference data for the boreal forest region and the period analysed (from 1982 to 2020) compared with similar products, either obtained from fire records perimeters of official agencies or from products derived from satellite images. That is why we were forced to evaluate our product for the two sub-regions already described (Eurasia and North America) and two different periods marked by the year 2000 when the MODIS sensor was put into operation.
For the assessment of the BA-LTDR-DS accuracy in the northern sub-region of North America, the best available baseline data (ground-truth) were used, i.e. the perimeters of BAs recorded by the AFS and Canada (CFSFND + NBAC). Few countries have detailed registries of BA perimeters available to use for a full assessment of products resulting from satellite images. The availability of the above information made it possible to conduct a detailed study of the various products based on the total amount of fires rather than a simple sample (Moreno-Ruiz et al. 2019). These databases, although regularly maintained and updated, may contain errors mainly due to the omission of small fires and the application of non-standardised techniques to delineate BA perimeters, which may result in a lack of comparability and the impossibility of performing integrated analyses. Delineation of BA perimeters is often done with semi-automated methods that involve significant human participation. Therefore, technicians may differ in their interpretation of the same fire (Vanderhoof et al. 2017; Franquesa et al. 2022a). Such errors can propagate during the accuracy assessment of BA maps, especially in regions with many small and/or low-severity fires, where the persistence of the burn signal is a few weeks (Franquesa et al. 2022b). However, this is not the case in the boreal regions analysed, characterised by long-lasting fires that leave a persistent scar for years (Moreno-Ruiz et al. 2014a; Andela et al. 2019; Boschetti et al. 2019), which makes them much easier to detect and interpret by the different official agencies. Concerning the possible impact of the errors mentioned on estimating the accuracy of the BA-LTDR-DS product, it should be taken into account that we are comparing a low spatial resolution product (5 km) with high-resolution reference data (30 m or even less), so it is unlikely to detect BAs smaller than 1000 ha, which also account for less than 10% of the total area burned in North America (Stocks et al. 2003; Burton et al. 2008; Moreno-Ruiz et al. 2020).
For the sub-region of Eurasia, the main challenge we faced was the absence of official reference data (ground-truth), which makes validation of any BA product impossible. Thus, an intercomparison was made with the MCD64A1 C6 product with 500-m spatial resolution, which is currently the official MODIS BA product. The accuracy of MCD64A1 C6 has been evaluated in several recent studies. In a global validation, Boschetti et al. (2019) revealed that the accuracy of this product varies significantly between biomes, reporting the lowest commission and omission errors for the boreal region, with 0.24 and 0.27 respectively, using a sample of 78 pairs of Landsat 8 images. In another assessment for the Alaska region and considering all BAs recorded by AFS (Moreno-Ruiz et al. 2019), the calculated average commission and omission errors obtained were 0.18 and 0.48 respectively for the MCD64A1 C6, with significant annual fluctuations, whereas for northeastern Siberia, García-Lázaro et al. (2018), using as reference data a set of 152 pairs of Landsat TM images in three assessment years (2002, 2010, 2011) and considering fires larger than 1000 ha, commission error = 15 and omission error = 23% were obtained. In general, it is seen that MCD64A1 underestimates BA in boreal regions. Small and spatially fragmented BAs are not discernable at the 500-m MODIS scale. However, MCD64A1 does map spatially extensive BAs (>1000 ha) in boreal forests, which can persist in the landscape for long periods, so their detection, even in cloudy conditions, remains possible (Melchiorre and Boschetti 2018; Boschetti et al. 2019). These errors will not have a significant impact on the BA-LTDR-DS evaluation owing to the difference in spatial resolution between both products (500 m vs 5 km). However, it should be noted that our aim in this work was to use MCD64A1 to validate not only the accuracy of BA-LTDR-DS in Eurasia (which could be extrapolated from the official reference data for the whole North America (NA) time series) but to assess its temporal consistency in this sub-region, where no high spatial resolution reference data are available. This assessment can be made given the high correlation (99%) between the MCD64A1 annual BA time series and the NA official reference data.
The assessment of the temporal accuracy of the BA-LTDR-DS in the two boreal sub-regions shows a high correlation in the annual estimates of BA with all the available reference data (including MCD64A1 C6 in the available years) above 0.93. As for spatial accuracy, for the North American sub-region, the average BA estimates of the BA-LTDR-DS are ~62% of the ground-truth. The slopes of the regression lines of the BA percentages in pixels of 50 km were ~0.73 with an R2 of 0.78 and with average errors of commission and omission of ~0.14 and 0.47, respectively. These results, as a whole, significantly improved those obtained for the boreal regions of Canada and Alaska with the previous versions of the LTDR dataset. With Version 3 of LTDR, in the period 1984–1999, an average slope of 0.63 for the regression line was obtained for Canada with an R2 of 0.72 (Moreno Ruiz et al. 2012). For North America, in the period 1984–1998, a slope of 0.62 with R2 of 0.75 (Moreno-Ruiz et al. 2014b) and, in the period 2001–2011, a slope of 0.69 with R2 of 0.75 (Moreno-Ruiz et al. 2014a) were obtained. With the LTDR Version 4, in the Alaska region and for the period 1982–2015, an estimate of 56% total BA was obtained, with commission and omission errors of 0.29 and 0.61, respectively (Moreno-Ruiz et al. 2019).
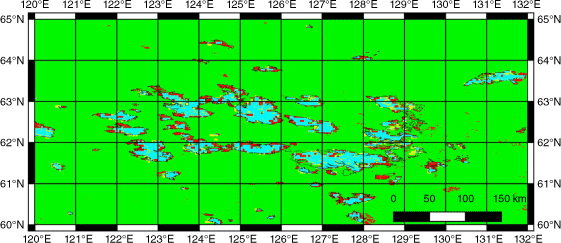
An analysis of the comparison of the BA-LTDR-DS with respect to MCD64A1 C6 by sub-regions shows hardly any differences in estimates of ~3%. For the North American sub-region, the percentage of the estimated BA (69%) is very similar to that obtained in the sub-region of Eurasia (66%). These results coincide with previous work on the NE region of Siberia (García-Lázaro et al. 2018), where Landsat images were used to delineate perimeters of all the BAs greater than 1000 ha in the years 2002, 2010 and 2011. García-Lázaro et al. (2018) reported percentages of estimated BA at 89% for MCD64A1 C6 and 65% for the BA-LTDR, similar to those we obtained in the North American sub-region. As the BA-LTDR-DS algorithm applied was the same in both sub-regions, we understand that the differences may be due to the influence of the dominant tree species on the fire dynamics of boreal forests in both sub-regions (Rogers et al. 2015). Forest fires in North America tend to be more intense and consume the entire vegetation mass from the ground to the canopies, being therefore of greater extent (Wooster and Zhang 2004; Wirth 2005; de Groot et al. 2013; Sitnov and Mokhov 2018), while fires in Eurasia tend to burn closer to the ground, which influences their extent and makes them difficult to detect with low spatial resolution remote sensors (>1 km), especially at the borders of the BAs. Fig. 8 shows a scene from 2002 when the differences in estimated BA between the BA-LTDR-DS and MCD64A1 C6 are very high (4.2 and 3.0 million ha, respectively). It was noted that both products detected the same BAs, but many border pixels were not identified as burned by the BA-LTDR-DS, with an approximate spatial resolution of 5 km.
Burned area map for the year 2002 in Eurasia detected by the MODIS Collection 6 MCD64A1 C6 and the BA-LTDR-DS (Burned Area Long-Term Data-Record Dataset). Colours: green, detected as non-burned; cyan, BA detected by BA-LTDR-DS and MCD64A1 C6; red, BA detected only by MCD64A1 C6; yellow, BA detected only by BA-LTDR-DS; black, perimeter of BA recorded by Landsat-TM.
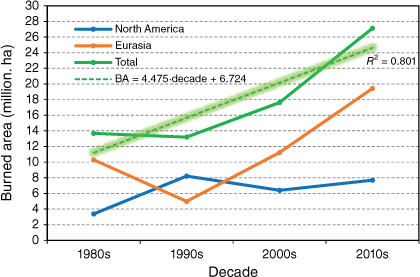
The generated BA-LTDR-DS product could be used as input for climate change-related applications, gas emission prediction in atmospheric models, or global vegetation modelling, among others. As an example for immediate application, we analysed the BA trend for the northern boreal region and the American and Eurasian sub-regions. Aggregating the BA data by decade, we observe a linear increase in BA across the northern boreal region of ~4.47 million ha per decade (Fig. 9). Notably, by the 1990s, the contribution from both sub-regions was reversed, with a sharp decrease in the Eurasian sub-region and an increase in BA for the North American sub-region. Thereafter, a pronounced increase was observed for Eurasia. For North America, there is no noticeable positive trend, with a total average BA per decade of ~7 million ha. The results of this analysis are in agreement with the increase of forest fire activity in boreal regions due toglobal warming reported by previous studies (Flannigan et al. 2009; Turetsky et al. 2011; Kelly et al. 2013). It confirms the trend found for the NE Siberia region by García-Lázaro et al. (2018), with an increase of 1.28 million ha per decade, but corrects the estimate that the same authors extrapolated for the northern boreal region and for which they estimated an increase of 50 million ha per decade. It should be noted that the calculation by García-Lázaro et al. (2018) was made based on a sample (NE Siberia) that may not be representative in terms of fire dynamics for the entire population, i.e. for the northern boreal region.
Conclusions
This study built a comprehensive BA dataset (1982–2020) for the northern boreal region using a Bayesian network algorithm from the LTDR v5 dataset (modified with brightness temperature data from MOD09CMG for the period 2000–2008 and 2018–2021) at 0.05° spatial resolution. This time series is the longest developed for this region at this spatial resolution. It constitutes a unique data source for the pre-MODIS era (1980s and 1990s) for the long-term study of fire dynamics in this region. This product becomes a reliable source for the 1980s and 1990s when other products with higher spatial/spectral resolution like MCD64A1 were not available.
The annual BA distributions of the BA-LTDR-DS product and the reference data in the North America Boreal sub-region follow a similar temporal pattern, with R2 over 0.93, but with an underestimation of 38%. In general, the BA estimated by our product turns out lower than the measurements from official inventories, which is to be expected considering the spatial resolution of the original LTDR data. But the results are comparable, both in terms of temporal and spatial accuracy, with the MCD64A1 C6 BA product, despite its spatial resolution being up to 10 times better. In the Eurasia sub-region, from the year 2000, both BA time distributions, the BA-LTDR-DS and MCD64A1 C6, also follow the same behaviour. However, a lower BA-LTDR-DS estimation was detected in the Eurasia sub-region compared with the North America sub-region, possibly due to differences in the dominant tree species between both sub-regions, which make the intensity of North American wildfires greater, on average, than that of Eurasian wildfires (de Groot et al. 2013), making it difficult to detect the latter with low spatial resolution satellite imagery. The derived dataset constitutes unique long-term BA information for studies of fire and carbon dynamics in the northern boreal region, as well as their effects on the climate system. As a result, the BA-LTDR-DS data grouped by decades estimated a linear increase in BA of 4.47 million ha/decade. This increasing trend provides new evidence of how global warming affects fire activity in the northern boreal forest.
Although in its present form, the BA-LTDR-DS product can be considered a valuable contribution to the field, with its congruency with existing BA datasets and its coverage of less-mapped regions such as Eurasia, it is still possible to implement improvements in the future. It is proposed to extend BA-LTDR-DS to the entire boreal region, including the 50°–60°N belt, where coniferous forests intermingle with other vegetation types whose fire dynamics follow different patterns. Concerning the complication of replacing the limited-usefulness data from the AVHRR-NOAA-19 sensor since 2018 due to the decay of its orbit, it would be convenient to replace it with the recently processed AVH09C1-METOP product from the same AVHRR sensor, but aboard the European MetOP-BP satellite (https://landweb.modaps.eosdis.nasa.gov/QA_WWW/forPage/user_guide/avhrr/LTDR_Ver5_Products_UserGuide_v1.0.pdf). AVH09C1-METOP includes measurements since early 2013, which would also allow the BA time series to be extended to the present with periodic updates every year.
Data availability
The data that support this study are available in the article and accompanying online supplementary material.
Acknowledgements
The authors wish to thank the LTDR project and its team for making the data available, and Alaska Fire Service, the Canada Centre for Mapping and Earth Observation of Natural Resources Canada, the Canadian Forest Service, NASA, NOAA and USGS for processing and distributing the AFS, CFNDB, NBAC, MCD64A1 and LTDR datasets.
References
Al-Saadi J, Soja A, Pierce RB, Szykman J, Wiedinmyer C, Emmons LK, Kondragunta S, Zhang X, Kittaka C, Schaak T, Bowman K (2008) Intercomparison of near-real-time biomass burning emissions estimates constrained by satellite fire data. Journal of Applied Remote Sensing 2, 021504.
| Crossref | Google Scholar |
Amiro BD, Todd JB, Wotton BM, Logan KA, Flannigan MD, Stocks BJ, Mason JA, Martell DL, Hirsch KG (2001) Direct carbon emissions from Canadian forest fires, 1959-1999. Canadian Journal of Forest Research 31, 512-525.
| Crossref | Google Scholar |
Andela N, Morton DC, Giglio L, Paugam R, Chen Y, Hantson S, van der Werf GR, Randerson JT (2019) The global fire atlas of individual fire size, duration, speed and direction. Earth System Science Data 11, 529-552.
| Crossref | Google Scholar |
Arnone E, Francipane A, Scarbaci A, Puglisi C, Noto LV (2016) Effect of raster resolution and polygon-conversion algorithm on landslide susceptibility mapping. Environmental Modelling & Software 84, 467-481.
| Crossref | Google Scholar |
Balshi MS, Mcguire AD, Duffy P, Flannigan M, Kicklighter DW, Melillo J (2009a) Vulnerability of carbon storage in North American boreal forests to wildfires during the 21st century. Global Change Biology 15, 1491-1510.
| Crossref | Google Scholar |
Balshi MS, McGuire AD, Duffy P, Flannigan M, Walsh J, Melillo J (2009b) Assessing the response of area burned to changing climate in western boreal North America using a Multivariate Adaptive Regression Splines (MARS) approach. Global Change Biology 15, 578-600.
| Crossref | Google Scholar |
Barbosa PM, Pereira JMC, Grégoire J-M (1998) Compositing criteria for burned area assessment using multitemporal low resolution satellite data. Remote Sensing of Environment 65, 38-49.
| Crossref | Google Scholar |
Beaulne J, Garneau M, Magnan G, Boucher É (2021) Peat deposits store more carbon than trees in forested peatlands of the boreal biome. Scientific Reports 11, 2657.
| Crossref | Google Scholar |
Bonan GB (2008) Forests and climate change: Forcings, feedbacks, and the climate benefits of forests. Science 320, 1444-1449.
| Crossref | Google Scholar |
Bonan GB, Pollard D, Thompson SL (1992) Effects of boreal forest vegetation on global climate. Nature 359, 716-718.
| Crossref | Google Scholar |
Boschetti L, Roy DP, Justice CO (2009) ‘International Global Burned Area Satellite Product Validation Protocol Part I – production and standardization of validation reference data (to be followed by Part II – accuracy reporting).’ Committee on Earth Observation Satellites: Silver Spring, MD, USA, Available at http://lpvs.gsfc.nasa.gov/PDF/BurnedAreaValidationProtocol.pdf [verified 8 February 2023]
Boschetti L, Roy DP, Giglio L, Huang H, Zubkova M, Humber ML (2019) Global validation of the Collection 6 MODIS burned area product. Remote Sensing of Environment 235, 111490.
| Crossref | Google Scholar |
Bradshaw CJA, Warkentin IG (2015) Global estimates of boreal forest carbon stocks and flux. Global and Planetary Change 128, 24-30.
| Crossref | Google Scholar |
Brandt JP (2009) The extent of the North American boreal zone. Environmental Reviews 17, 101-161.
| Crossref | Google Scholar |
Burton PJ, Parisien MA, Hicke JA, Hall RJ, Freeburn JT (2008) Large fires as agents of ecological diversity in the North American boreal forest. International Journal of Wildland Fire 17(6), 754-767.
| Crossref | Google Scholar |
Campagnolo ML, Sun Q, Liu Y, Schaaf C, Wang Z, Román MO (2016) Estimating the effective spatial resolution of the operational BRDF, albedo, and nadir reflectance products from MODIS and VIIRS. Remote Sensing of Environment 175, 52-64.
| Crossref | Google Scholar |
Chang D, Song Y (2009) Comparison of L3JRC and MODIS global burned area products from 2000 to 2007. Journal of Geophysical Research: Atmospheres 114, D16106.
| Crossref | Google Scholar |
Chapin FS, Mcguire AD, Randerson J, Pielke R, Baldocchi D, Hobbie SE, Roulet N, Eugster W, Kasischke E, Rastetter EB, Zimov SA, Running SW (2000) Arctic and boreal ecosystems of western North America as components of the climate system. Global Change Biology 6, 211-223.
| Crossref | Google Scholar |
Chen D, Loboda TV, Krylov A, Potapov P (2016a) Mapping stand age dynamics of the Siberian larch forests from recent Landsat observations. Remote Sensing of Environment 187, 320-331.
| Crossref | Google Scholar |
Chen W, Moriya K, Sakai T, Koyama L, Cao CX (2016b) Mapping a burned forest area from Landsat TM data by multiple methods. Geomatics, Natural Hazards and Risk 7, 384-402.
| Crossref | Google Scholar |
Chu T, Guo X (2015) Compositing MODIS time series for reconstructing burned areas in the taiga–steppe transition zone of northern Mongolia. International Journal of Wildland Fire 24, 419-432.
| Crossref | Google Scholar |
Chuvieco E, Ventura G, Martín MP (2005) AVHRR multitemporal compositing techniques for burned land mapping. International Journal of Remote Sensing 26, 1013-1018.
| Crossref | Google Scholar |
Chuvieco E, Englefield P, Trishchenko AP, Luo Y (2008) Generation of long time series of burn area maps of the boreal forest from NOAA-AVHRR composite data. Remote Sensing of Environment 112, 2381-2396.
| Crossref | Google Scholar |
Chuvieco E, Lizundia-Loiola J, Pettinari ML, Ramo R, Padilla M, Tansey K, Mouillot F, Laurent P, Storm T, Heil A, Plummer S (2018) Generation and analysis of a new global burned area product based on MODIS 250 m reflectance bands and thermal anomalies. Earth System Science Data 10, 2015-2031.
| Crossref | Google Scholar |
Ciais P, Canadell JG, Luyssaert S, Chevallier F, Shvidenko A, Poussi Z, Jonas M, Peylin P, King AW, Schulze ED, Piao S, Rödenbeck C, Peters W, Bréon FM (2010) Can we reconcile atmospheric estimates of the Northern terrestrial carbon sink with land-based accounting? Current Opinion in Environmental Sustainability 2, 225-230.
| Crossref | Google Scholar |
Coffield SR, Graff CA, Chen Y, Smyth P, Foufoula-Georgiou E, Randerson JT (2019) Machine learning to predict final fire size at the time of ignition. International Journal of Wildland Fire 28, 861-873.
| Crossref | Google Scholar |
Cooke WF, Koffi B, Grégoire J-M (1996) Seasonality of vegetation fires in Africa from remote sensing data and application to a global chemistry model. Journal of Geophysical Research: Atmospheres 101, 21051-21065.
| Crossref | Google Scholar |
de Groot WJ, Cantin AS, Flannigan MD, Soja AJ, Gowman LM, Newbery A (2013) A comparison of Canadian and Russian boreal forest fire regimes. Forest Ecology and Management 294, 23-34.
| Crossref | Google Scholar |
Duncan BN (2003) Interannual and seasonal variability of biomass burning emissions constrained by satellite observations. Journal of Geophysical Research 108, 4040.
| Crossref | Google Scholar |
Dwyer E, Pinnock S, Gregoire JM, Pereira JMC (2000) Global spatial and temporal distribution of vegetation fire as determined from satellite observations. International Journal of Remote Sensing 21, 1289-1302.
| Crossref | Google Scholar |
Eberle J, Urban M, Homolka A, Hüttich C, Schmullius C (2016) Multi-Source Data Integration and Analysis for Land Monitoring in Siberia. In ‘Novel Methods for Monitoring and Managing Land and Water Resources in Siberia’. (Eds L Mueller, AK Sheudshen, F Eulenstein) pp. 471–487. (Springer International Publishing: Cham)
Eckdahl JA, Kristensen JA, Metcalfe DB (2022) Climatic variation drives loss and restructuring of carbon and nitrogen in boreal forest wildfire. Biogeosciences 19, 2487-2506.
| Crossref | Google Scholar |
Espinola M, Piedra-Fernandez JA, Ayala R, Iribarne L, Wang JZ (2015) Contextual and hierarchical classification of satellite images based on cellular automata. IEEE Transactions on Geoscience and Remote Sensing 53, 795-809.
| Crossref | Google Scholar |
Flannigan MD, Logan KA, Amiro BD, Skinner WR, Stocks BJ (2005) Future area burned in Canada. Climatic Change 72, 1-16.
| Crossref | Google Scholar |
Flannigan MD, Krawchuk MA, de Groot WJ, Wotton BM, Gowman LM (2009) Implications of changing climate for global wildland fire. International Journal of Wildland Fire 18, 483-507.
| Crossref | Google Scholar |
Franquesa M, Rodriguez-Montellano AM, Chuvieco E, Aguado I (2022a) Reference data accuracy impacts burned area product validation: the role of the expert analyst. Remote Sensing 14, 4354.
| Crossref | Google Scholar |
Franquesa M, Stehman SV, Chuvieco E (2022b) Assessment and characterization of sources of error impacting the accuracy of global burned area products. Remote Sensing of Environment 280, 113214.
| Crossref | Google Scholar |
Fuchs H, Magdon P, Kleinn C, Flessa H (2009) Estimating aboveground carbon in a catchment of the Siberian forest tundra: Combining satellite imagery and field inventory. Remote Sensing of Environment 113, 518-531.
| Crossref | Google Scholar |
García-Lázaro JR, Moreno-Ruiz JA, Riaño D, Arbelo M (2018) Estimation of burned area in the northeastern Siberian boreal forest from a Long-Term Data Record (LTDR) 1982–2015 time series. Remote Sensing 10, 940.
| Crossref | Google Scholar |
Georgiadi AG, Milyukova IP, Kashutina EA (2010) Environmental change in Siberia. Environmental Change in Siberia: Earth Observation, Field Studies and Modelling 40, 157-169.
| Crossref | Google Scholar |
Giglio L, Roy DP (2022) Assessment of satellite orbit-drift artifacts in the long-term AVHRR FireCCILT11 global burned area data set. Science of Remote Sensing 5, 100044.
| Crossref | Google Scholar |
Giglio L, Randerson JT, van der Werf GR, Kasibhatla PS, Collatz GJ, Morton DC, DeFries RS (2009) Assessing variability and long-term trends in burned area by merging multiple satellite fire products. Biogeosciences Discussions 6, 11577-11622.
| Crossref | Google Scholar |
Giglio L, Randerson JT, van der Werf GR (2013) Analysis of daily, monthly, and annual burned area using the fourth-generation global fire emissions database (GFED4). Journal of Geophysical Research: Biogeosciences 118, 317-328.
| Crossref | Google Scholar |
Giglio L, Boschetti L, Roy DP, Humber ML, Justice CO (2018) The Collection 6 MODIS burned area mapping algorithm and product. Remote Sensing of Environment 217, 72-85.
| Crossref | Google Scholar |
Gorham E (1991) Northern peatlands: Role in the carbon cycle and probable responses to climatic warming. Ecological Applications 1, 182-195.
| Crossref | Google Scholar |
Guindos-Rojas F, Arbelo M, García-Lázaro JR, Moreno-Ruiz JA, Hernández-Leal PA (2018) Evaluation of a Bayesian algorithm to detect burned areas in the Canary Islands’ Dry Woodlands and forests ecoregion using MODIS data. Remote Sensing 10, 789.
| Crossref | Google Scholar |
Haas O, Prentice IC, Harrison SP (2022) Global environmental controls on wildfire burnt area, size, and intensity. Environmental Research Letters 17, 065004.
| Crossref | Google Scholar |
Hall RJ, Skakun RS, Metsaranta JM, Landry R, Fraser RH, Raymond D, Gartrell M, Decker V, Little J (2020) Generating annual estimates of forest fire disturbance in Canada: the National Burned Area Composite. International Journal of Wildland Fire 29(10), 878-891.
| Crossref | Google Scholar |
Hanes CC, Wang X, Jain P, Parisien M-A, Little JM, Flannigan MD (2019) Fire-regime changes in Canada over the last half century. Canadian Journal of Forest Research 49, 256-269.
| Crossref | Google Scholar |
Jobbágy EG, Jackson RB (2000) The vertical distribution of soil organic carbon and its relation to climate and vegetation. Ecological Applications 10, 423-436.
| Crossref | Google Scholar |
Julien Y, Sobrino JA (2021) NOAA-AVHRR orbital drift correction: Validating methods using msg-seviri data as a benchmark dataset. Remote Sensing 13, 925.
| Crossref | Google Scholar |
Kasischke ES, French NHF (1995) Locating and estimating the areal extent of wildfires in alaskan boreal forests using multiple-season AVHRR NDVI composite data. Remote Sensing of Environment 51, 263-275.
| Crossref | Google Scholar |
Kasischke ES, Christensen Jr NL, Stocks BJ (1995) Fire, global warming, and the carbon balance of boreal forests. Ecological Applications 5, 437-451.
| Crossref | Google Scholar |
Kasischke ES, Hyer EJ, Novelli PC, Bruhwiler LP, French NHF, Sukhinin AI, Hewson JH, Stocks BJ (2005) Influences of boreal fire emissions on Northern Hemisphere atmospheric carbon and carbon monoxide. Global Biogeochemical Cycles 19, GB1012.
| Crossref | Google Scholar |
Kasischke ES, Loboda T, Giglio L, French NHF, Hoy EE, de Jong B, Riano D (2011) Quantifying burned area for North American forests: Implications for direct reduction of carbon stocks. Journal of Geophysical Research: Biogeosciences 116, G04003.
| Crossref | Google Scholar |
Kelly R, Chipman ML, Higuera PE, Stefanova I, Brubaker LB, Hu FS (2013) Recent burning of boreal forests exceeds fire regime limits of the past 10,000 years. Proceedings of the National Academy of Sciences 110, 13055-13060.
| Crossref | Google Scholar |
Krylov A, McCarty JL, Potapov P, Loboda T, Tyukavina A, Turubanova S, Hansen MC (2014) Remote sensing estimates of stand-replacement fires in Russia, 2002–2011. Environmental Research Letters 9, 105007.
| Crossref | Google Scholar |
Kukavskaya EA, Soja AJ, Petkov AP, Ponomarev EI, Ivanova GA, Conard SG (2013) Fire emissions estimates in Siberia: evaluation of uncertainties in area burned, land cover, and fuel consumption. Canadian Journal of Forest Research 43, 493-506.
| Crossref | Google Scholar |
Kurz WA, Stinson G, Rampley GJ, Dymond CC, Neilson ET (2008) Risk of natural disturbances makes future contribution of Canada’s forests to the global carbon cycle highly uncertain. Proceedings of the National Academy of Sciences 105, 1551-1555.
| Crossref | Google Scholar |
Loboda TV, Zhang Z, O’Neal KJ, Sun G, Csiszar IA, Shugart HH, Sherman NJ (2012) Reconstructing disturbance history using satellite-based assessment of the distribution of land cover in the Russian Far East. Remote Sensing of Environment 118, 241-248.
| Crossref | Google Scholar |
Loboda TV, French NHF, Hight-Harf C, Jenkins L, Miller ME (2013) Mapping fire extent and burn severity in Alaskan tussock tundra: An analysis of the spectral response of tundra vegetation to wildland fire. Remote Sensing of Environment 134, 194-209.
| Crossref | Google Scholar |
Melchiorre A, Boschetti L (2018) Global analysis of burned area persistence time with MODIS Data. Remote Sensing 10, 750.
| Crossref | Google Scholar |
Mojaradi B, Lucas C, Varshosaz M (2004) Using learning cellular automata for post classification satellite imagery. International Archives of the Photogrammetry, Remote Sensing and Spatial Information Sciences - ISPRS Archives 35, 991-995.
| Google Scholar |
Moreno Ruiz JA, Riaño D, Arbelo M, French NHF, Ustin SL, Whiting ML (2012) Burned area mapping time series in Canada (1984–1999) from NOAA-AVHRR LTDR: A comparison with other remote sensing products and fire perimeters. Remote Sensing of Environment 117, 407-414.
| Crossref | Google Scholar |
Moreno-Ruiz JA, García-Lázaro JR, del Águila Cano I, Hernández-Leal P (2014a) Burned area mapping in the North American boreal forest using terra-MODIS LTDR (2001–2011): A comparison with the MCD45A1, MCD64A1 and BA GEOLAND-2 products. Remote Sensing 6, 815-840.
| Crossref | Google Scholar |
Moreno-Ruiz JA, Garcia-Lazaro JR, Riano D, Kefauver SC (2014b) The synergy of the 0.05° (~5km) AVHRR long-term data record (LTDR) and landsat TM archive to map large fires in the North American boreal region from 1984 to 1998. IEEE Journal of Selected Topics in Applied Earth Observations and Remote Sensing 7, 1157-1166.
| Crossref | Google Scholar |
Moreno-Ruiz JA, García-Lázaro JR, Arbelo M, Riaño D (2019) A comparison of burned area time series in the Alaskan boreal forests from different remote sensing products. Forests 10, 363.
| Crossref | Google Scholar |
Moreno-Ruiz JA, García-Lázaro JR, Arbelo M, Cantón-Garbín M (2020) MODIS sensor capability to burned area mapping—assessment of performance and improvements provided by the latest standard products in boreal regions. Sensors 20, 5423.
| Crossref | Google Scholar |
Morisette JT, Baret F, Privette JL, Myneni RB, Nickeson JE, Garrigues S, Shabanov NV, Weiss M, Fernandes RA, Leblanc SG, Kalacska M, Sanchez-Azofeifa GA, Chubey M, Rivard B, Stenberg P, Rautiainen M, Voipio P, Manninen T, Pilant AN, Lewis TE, Iiames JS, Colombo R, Meroni M, Busetto L, Cohen WB, Turner DP, Warner ED, Petersen GW, Seufert G, Cook R (2006) Validation of Global Moderate-Resolution LAI Products: A Framework Proposed Within the CEOS Land Product Validation Subgroup. IEEE Transactions on Geoscience and Remote Sensing 44, 1804-1817.
| Crossref | Google Scholar |
Mouillot F, Schultz MG, Yue C, Cadule P, Tansey K, Ciais P, Chuvieco E (2014) Ten years of global burned area products from spaceborne remote sensing – A review: Analysis of user needs and recommendations for future developments. International Journal of Applied Earth Observation and Geoinformation 26, 64-79.
| Crossref | Google Scholar |
Nelson K, Thompson D, Hopkinson C, Petrone R, Chasmer L (2021) Peatland-fire interactions: A review of wildland fire feedbacks and interactions in Canadian boreal peatlands. Science of The Total Environment 769, 145212.
| Crossref | Google Scholar |
Núñez-Casillas L, García Lázaro JR, Moreno-Ruiz JA, Arbelo M (2013) A comparative analysis of burned area datasets in Canadian boreal forest in 2000. The Scientific World Journal 2013, 289056.
| Crossref | Google Scholar |
Otón G, Ramo R, Lizundia-Loiola J, Chuvieco E (2019) Global detection of long-term (1982–2017) burned area with AVHRR-LTDR data. Remote Sensing 11, 2079.
| Crossref | Google Scholar |
Otón G, Lizundia-Loiola J, Pettinari ML, Chuvieco E (2021) Development of a consistent global long-term burned area product (1982–2018) based on AVHRR-LTDR data. International Journal of Applied Earth Observation and Geoinformation 103, 102473.
| Crossref | Google Scholar |
Padilla M, Stehman SV, Ramo R, Corti D, Hantson S, Oliva P, Alonso-Canas I, Bradley AV, Tansey K, Mota B, Pereira JM, Chuvieco E (2015) Comparing the accuracies of remote sensing global burned area products using stratified random sampling and estimation. Remote Sensing of Environment 160, 114-121.
| Crossref | Google Scholar |
Pan Y, Birdsey RA, Fang J, Houghton R, Kauppi PE, Kurz WA, Phillips OL, Shvidenko A, Lewis SL, Canadell JG, Ciais P, Jackson RB, Pacala SW, McGuire AD, Piao S, Rautiainen A, Sitch S, Hayes D (2011) A large and persistent carbon sink in the world’s forests. Science 333, 988-993.
| Crossref | Google Scholar |
Parisien MA, Peters VS, Wang Y, Little JM, Bosch EM, Stocks BJ (2006) Spatial patterns of forest fires in Canada 1980–1999. International Journal of Wildland Fire 15, 361-374.
| Crossref | Google Scholar |
Pedelty J, Devadiga S, Masuoka E, Brown M, Pinzon J, Tucker C, Vermote E, Prince S, Nagol J, Justice C, Roy D, Ju J, Schaaf C, Liu J, Privette J, Pinheiro A (2007) Generating a long-term land data record from the AVHRR and MODIS instruments. In ‘International Geoscience and Remote Sensing Symposium (IGARSS)’. pp. 1021–1025. (IEEE) 10.1109/IGARSS.2007.4422974
Pinty B, Verstraete MM (1992) GEMI: a non-linear index to monitor global vegetation from satellites. Vegetatio 101, 15-20.
| Crossref | Google Scholar |
Ponomarev EI, Kharuk VI, Ranson KJ (2016) Wildfires dynamics in Siberian larch forests. Forests 7, 125.
| Crossref | Google Scholar |
Portier J, Gauthier S, Bergeron Y (2019) Spatial distribution of mean fire size and occurrence in eastern Canada: influence of climate, physical environment and lightning strike density. International Journal of Wildland Fire 28, 927-940.
| Crossref | Google Scholar |
Rogers BM, Soja AJ, Goulden ML, Randerson JT (2015) Influence of tree species on continental differences in boreal fires and climate feedbacks. Nature Geoscience 8, 228-234.
| Crossref | Google Scholar |
Shuman JK, Shugart HH, O’Halloran TL (2011) Sensitivity of Siberian larch forests to climate change. Global Change Biology 17, 2370-2384.
| Crossref | Google Scholar |
Sitnov SA, Mokhov II (2018) A Comparative Analysis of the Characteristics of Active Fires in the Boreal Forests of Eurasia and North America Based on Satellite Data. Izvestiya, Atmospheric and Oceanic Physics 54, 966-978.
| Crossref | Google Scholar |
Skakun R, Whitman E, Little JM, Parisien MA (2021) Area burned adjustments to historical wildland fires in Canada. Environmental Research Letters 16, 064014.
| Crossref | Google Scholar |
Skakun R, Castilla G, Metsaranta J, Whitman E, Rodrigue S, Little J, Groenewegen K, Coyle M (2022) Extending the National Burned Area Composite Time Series of Wildfires in Canada. Remote Sensing 14, 3050.
| Crossref | Google Scholar |
Soja AJ, Cofer WR, Shugart HH, Sukhinin AI, Stackhouse PW, McRae DJ, Conard SG (2004) Estimating fire emissions and disparities in boreal Siberia (1998–2002). Journal of Geophysical Research: Atmospheres 109, D14S06.
| Crossref | Google Scholar |
Soja AJ, Al-Saadi J, Giglio L, Randall D, Kittaka C, Pouliot G, Kordzi JJ, Raffuse S, Pace TG, Pierce TE, Moore T, Roy B, Pierce RB, Szykman JJ (2009) Assessing satellite-based fire data for use in the National Emissions Inventory. Journal of Applied Remote Sensing 3, 031504.
| Crossref | Google Scholar |
Stehman SV (1997) Selecting and interpreting measures of thematic classification accuracy. Remote Sensing of Environment 62, 77-89.
| Crossref | Google Scholar |
Stocks BJ, Mason JA, Todd JB, Bosch EM, Wotton BM, Amiro BD, Flannigan MD, Hirsch KG, Logan KA, Martell DL, Skinner WR (2003) Large forest fires in Canada, 1959–1997. Journal of Geophysical Research 108(D1), 8149.
| Crossref | Google Scholar |
Stowe LL, Davis PA, McClain EP (1999) Scientific Basis and Initial Evaluation of the CLAVR-1 Global Clear/Cloud Classification Algorithm for the Advanced Very High Resolution Radiometer. Journal of Atmospheric and Oceanic Technology 16, 656-681.
| Crossref | Google Scholar |
Sukhinin AI, French NHF, Kasischke ES, Hewson JH, Soja AJ, Csiszar IA, Hyer EJ, Loboda T, Conrad SG, Romasko VI, Pavlichenko EA, Miskiv SI, Slinkina OA (2004) AVHRR-based mapping of fires in Russia: New products for fire management and carbon cycle studies. Remote Sensing of Environment 93, 546-564.
| Crossref | Google Scholar |
Tchebakova NM, Parfenova E, Soja AJ (2009) The effects of climate, permafrost and fire on vegetation change in Siberia in a changing climate. Environmental Research Letters 4, 045013.
| Crossref | Google Scholar |
Turetsky MR, Kane ES, Harden JW, Ottmar RD, Manies KL, Hoy E, Kasischke ES (2011) Recent acceleration of biomass burning and carbon losses in Alaskan forests and peatlands. Nature Geoscience 4, 27-31.
| Crossref | Google Scholar |
Vanderhoof MK, Fairaux N, Beal YJG, Hawbaker TJ (2017) Validation of the USGS Landsat burned area essential climate variable (BAECV) across the conterminous United States. Remote Sensing of Environment 198, 393-406.
| Crossref | Google Scholar |
Vivchar A (2011) Wildfires in Russia in 2000–2008: Estimates of burnt areas using the satellite MODIS MCD45 data. Remote Sensing Letters 2, 81-90.
| Crossref | Google Scholar |
Walsh JE (2014) Intensified warming of the Arctic: Causes and impacts on middle latitudes. Global and Planetary Change 117, 52-63.
| Crossref | Google Scholar |
Wooster MJ, Zhang YH (2004) Boreal forest fires burn less intensely in Russia than in North America. Geophysical Research Letters 31, L20505.
| Crossref | Google Scholar |